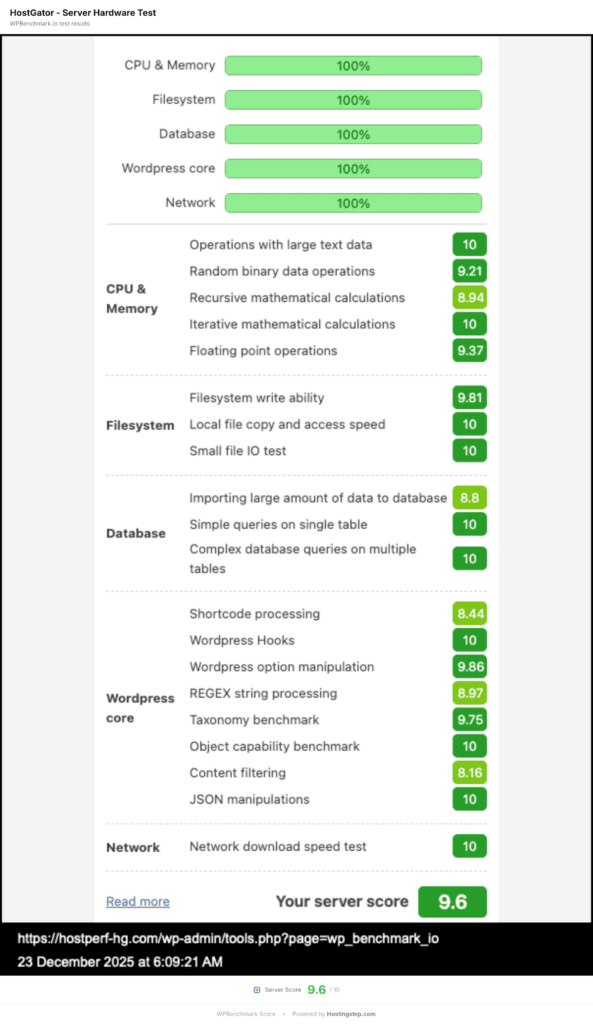
HostGator recorded 9.6 out of 10 in WPBench, reflecting more raw computation than hosting services that cost 5x to 8x more. The host recorded a cached global TTFB of 426 ms measured from 40 locations, though that average hides a wide regional spread.
The host recorded 99.97% uptime with roughly 10 minutes of downtime per month and a load handling of 213 ms with a 2.0% error rate.
In this article, I will walk you through HostGator’s load handling, global reach, comparisons with competitors, and most importantly, who should use it and who shouldn’t.
Note: This review is based on our testing of HostGator’s Hatchling plan. The performance figures are measured data; the recommendations reflect our editorial assessment of those results. Unless stated otherwise, everything here applies to the Hatchling plan while other HostGator plans may produce different benchmark results.
Performance Overview
| Metric | Value | Field Context |
| TTFB (US) | 496ms | Median 465ms; Best: WordPress.com 319ms |
| Uptime | 99.97% | 7 outages, 1h 21m total downtime |
| Load Test | 213ms, 2.0% errors | Best: Pressable 12ms |
| Global TTFB | 426ms | Median 390ms; Best: WP Engine 65ms |
| WPBench | 9.6/10 | Highest recorded, tied with Bluehost |
TTFB Response Time
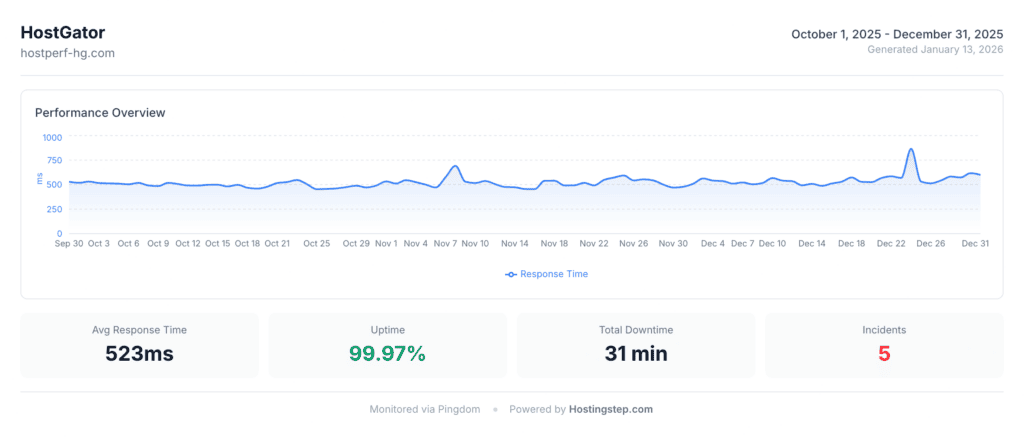
HostGator recorded a 496 ms average TTFB across the October 1, 2025 to May 31, 2026 monitoring window, which places it in the bottom half of the 34 providers we monitor. TTFB is the time a host takes to send the first byte of data when it receives a browser request.
| Window | Avg TTFB | Min TTFB | Max TTFB | Tests |
| Oct 1, 2025 – May 31, 2026 | 496ms | 374ms | 865ms | 349,920 |
Across 349,920 tests in the window, HostGator’s response time stayed between 374 ms and 865 ms. The 865 ms peak is 1.74x the average, which is a tighter spread than most budget shared hosts we monitor and points to reasonably consistent server response rather than occasional stalls.
HostGator recorded a TTFB of 496 ms for US while Pressable is among the fastest in this field with a TTFB of 320 ms. Even though HostGator uses a static CDN and serves images, CSS, and JS from the edge, it doesn’t cache HTML. Every single request reaches the origin server. HostGator’s approach to static CDN is different from that of WP Engine and Pressable which uses a full HTML caching at the edge. A TTFB of 496 ms is workable for a US audience, and the cached global TTFB of 426 ms holds up well across the Americas and Europe.
Uptime
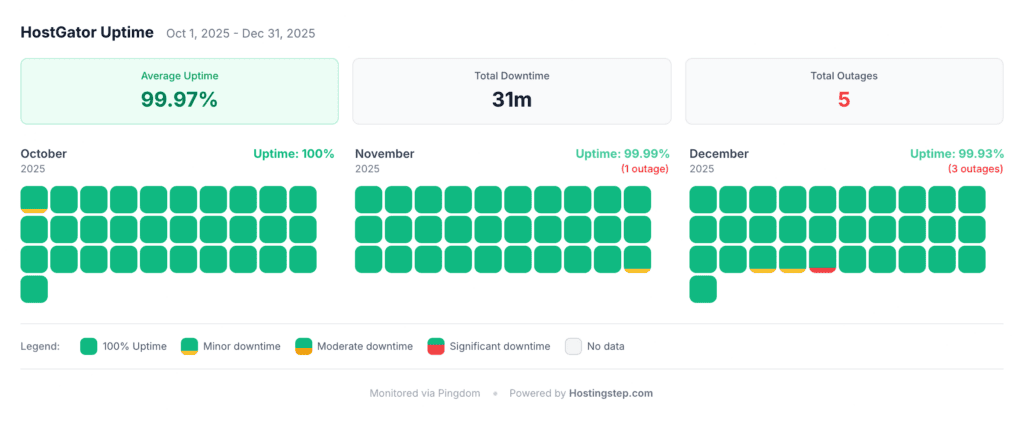
HostGator recorded 99.97% uptime with 1 hour 21 minutes of total downtime across 7 outages between October 1, 2025 and May 31, 2026. That works out to roughly 10 minutes of downtime per month and an average of 11.6 minutes per outage.
| Window | Uptime | Downtime | Outages | Avg/Outage |
| Oct 1, 2025 – May 31, 2026 | 99.9767% | 81 min (1h 21m) | 7 | 11.6 min |
HostGator edges Bluehost on uptime with 99.9767% vs 99.9760%, and recorded 7 outages against Bluehost’s 10. Hostinger Business is stronger at 99.9894%. SiteGround sits below both at 99.9695% with 29 outages over the same window, four times HostGator’s outage count.
Load Handling
HostGator recorded an average response time of 213 ms with a 2.0% error rate in the Load Test under 100 concurrent users. A 2.0% error rate means 20 out of every 1,000 requests failed. For a page pulling 30 resources, that works out to roughly a 45% chance a visitor hits at least one failed asset while the server is under that load.
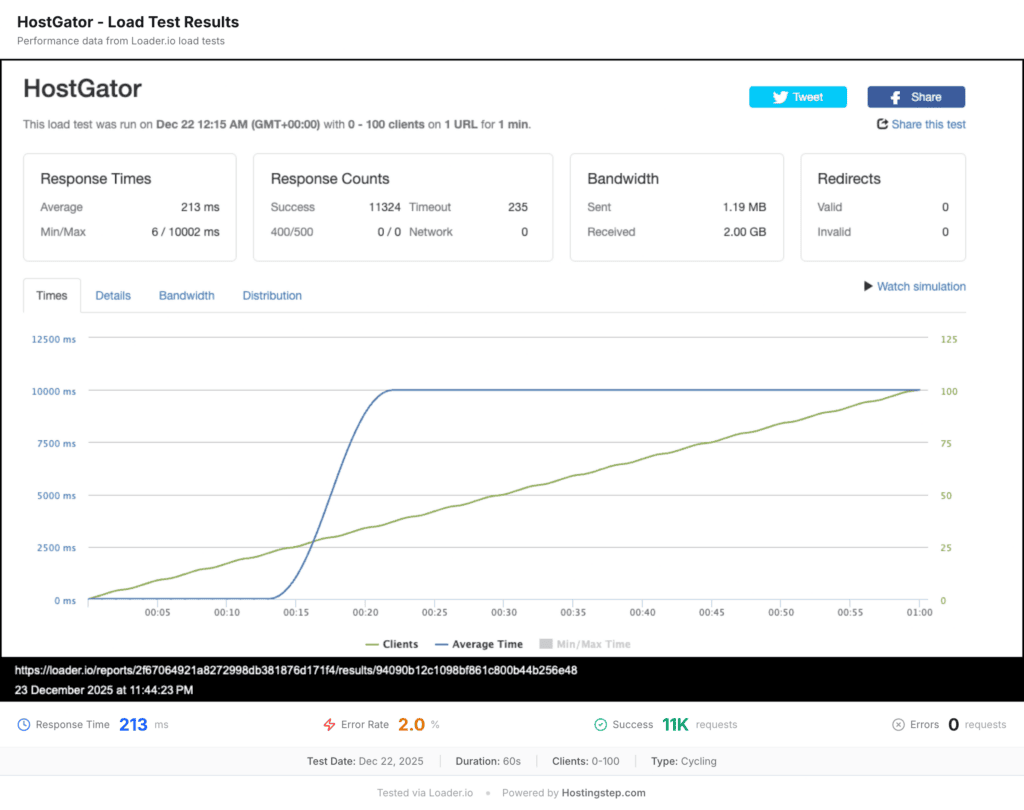
HostGator trails Hostinger Business with 213 ms at 2.0% errors against 31 ms at 0%. Against SiteGround the response times are closer with 213 ms vs 170 ms, but SiteGround completed the full run with 0% errors.
Server Hardware
While Kinsta costs $30 per month and scores 8.8 in WPBench, HostGator delivers more raw server power for just $3.75 per month. We conducted 21 tests relating to CPU, Memory, Filesystem, I/O, Database, and WP Core. We measured the server and not the delivery. Plugin heavy sites, Woocommerce stores, and complex builders like Elementor and Divi will largely benefit from HostGator’s raw server power.
| Rank | Host | WPBench | Price | Notes |
| #1 (tied) | Bluehost | 9.6 | $1.99 | Same parent (Newfold Digital) |
| #1 (tied) | HostGator | 9.6 | $3.75 | Same parent (Newfold Digital) |
| #3 (tied) | ScalaHosting | 8.8 | $2.95 | Independent |
| #3 (tied) | Kinsta | 8.8 | $30.00 | Premium managed |
| #5 | SiteGround | 8.4 | $3.99 | 1.2 pts below HostGator |
HostGator and Bluehost belong to the same parent company, which is why they have identical shared infrastructure and both scored 9.6. SiteGround is 1.2 points below HostGator with 8.4 out of 10. The 9.6 reflects the CPU, memory and disk I/O allocated to the plan, not the web server software HostGator runs.
Global TTFB
HostGator recorded a cached global TTFB of 426 ms across 40 locations, sitting just below the 390 ms median of the providers we monitor. The regional split matters far more than the average here. HostGator’s origin server sits in Northern Virginia, and the numbers fall away in a clean distance curve from there. Even though HostGator uses a static CDN, it serves images, CSS, and JS from the edge but serves HTML from the origin. Northern Virginia returned 79 ms because that is where the origin sits, not because HTML is cached at the edge. The further a visitor is from Virginia, the longer the wait, and HostGator’s static CDN cannot fix the latency of HTML delivery.
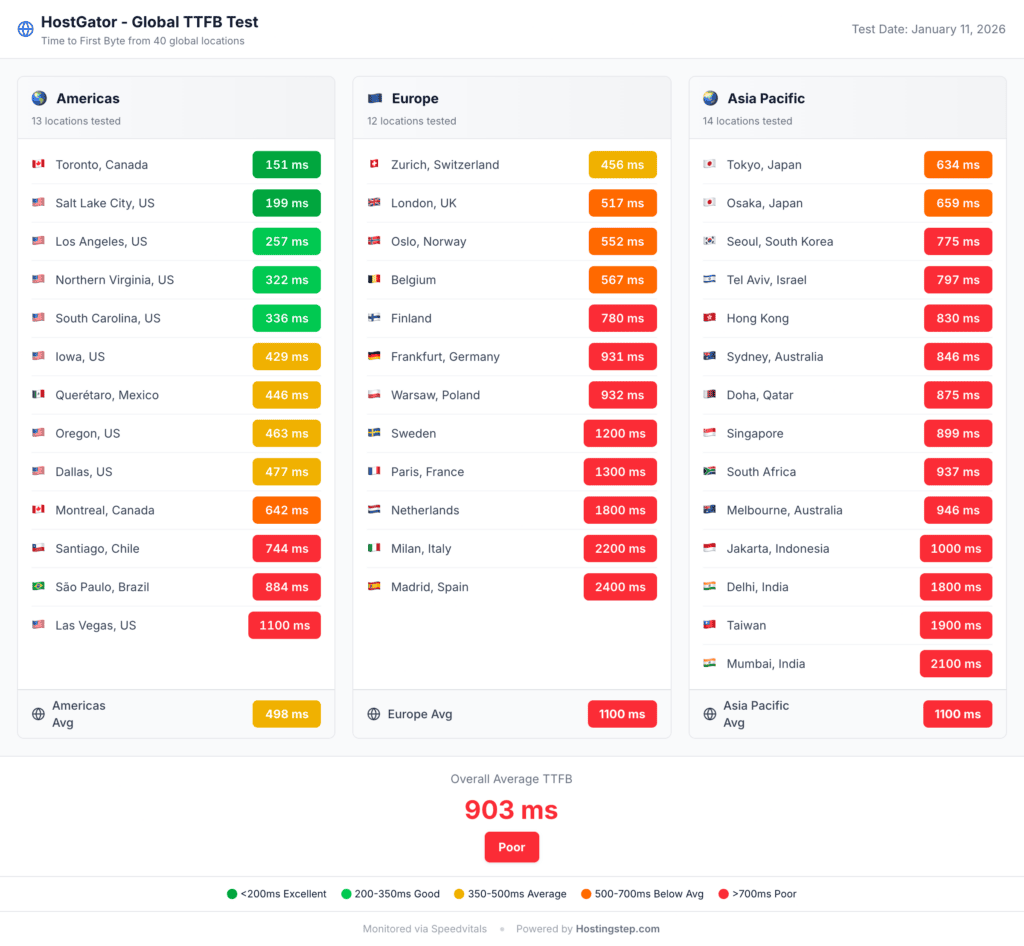
| Region | Locations | Avg TTFB | Best City | Worst City |
| Americas | 13 | 204ms | Northern Virginia (79ms) | São Paulo (400ms) |
| Europe | 11 | 337ms | Madrid (292ms) | Warsaw (411ms) |
| Asia-Pacific | 15 | 686ms | Tel Aviv (451ms) | Dubai (1.1 sec) |
Every Americas location came in under 400 ms and every European location under 420 ms, so a site serving North America or Western Europe is on solid ground. Asia-Pacific is the weak leg. At 1.1 seconds in Dubai, 907 ms in Delhi and 874 ms in Mumbai, a large share of Google’s 2.5 second LCP threshold is consumed before a pixel renders. For sites with meaningful Asian, Australian or Middle Eastern traffic, WP Engine at 65 ms is the stronger option.
HostGator vs Competitors
| Metric | HostGator | Bluehost | Hostinger Business | SiteGround |
| TTFB | 496ms | 501ms | 438ms | 745ms |
| Uptime | 99.9767% | 99.9760% | 99.9894% | 99.9695% |
| Load Test | 213ms/2.0% | 131ms/0% | 31ms/0% | 170ms/0% |
| Global TTFB | 426ms | 224ms | 351ms | 1,200ms |
| WPBench | 9.6 | 9.6 | 7.4 | 8.4 |
| CDN | Static | Static | Static | Addon |
| Addon ($) | Addon ($) | Addon ($) | Included ✓ | |
| Backups | Daily ✓ | Weekly | Daily ✓ | Daily ✓ |
| Price | $3.75/mo | $1.99/mo | $3.69/mo | $3.99/mo |
HostGator vs Bluehost:
Both HostGator and Bluehost belong to the same parent company, Newfold Digital and this is why they have identical hardware with a score of 9.6. Besides, both hosts have nearly the same TTFB with 496 ms vs 501 ms. However, Bluehost beats HostGator on global TTFB with 224 ms vs 426 ms.
Uptime is effectively a tie at 99.9767% vs 99.9760%, though HostGator recorded 7 outages against Bluehost’s 10. Bluehost takes load handling with 131 ms at 0% errors against HostGator’s 213 ms at 2.0%. Further, HostGator beats Bluehost with daily backups vs weekly backups. The remaining gap is global TTFB at 202 ms, which points to different edge caching configurations rather than different hardware.
HostGator vs Hostinger Business:
Hostinger Business beats HostGator in almost all metrics. Hostinger Business costs $0.06 per month less than HostGator yet offers better TTFB with 438 ms vs 496 ms, better uptime, load handling nearly 7x faster at 31 ms with 0% errors, and a faster global TTFB with 351 ms vs 426 ms.
HostGator wins only on server hardware with 9.6 vs 7.4, a 2.2 point advantage. Hostinger is ideal for most sites in both performance and pricing as Hostinger Coupon gets you 10% off on any plans. The hardware advantage that HostGator offers matters only for sites with over 20 plugins or WooCommerce stores.
HostGator vs SiteGround:
SiteGround has a good brand reputation but HostGator wins on TTFB by a wide margin with 496 ms vs 745 ms and on hardware with 9.6 vs 8.4. HostGator is also a little cheaper than SiteGround with $3.75 vs $3.99. Most importantly, HostGator recorded far fewer outages than SiteGround over the window with 7 vs 29. SiteGround wins on aspects like free Email plus a good load handling of 170 ms with 0% errors.
The global TTFB gap is the widest margin between the two. HostGator recorded 426 ms against SiteGround’s 1,200 ms, which is the slowest cached global figure in our current dataset. For a site with readers outside North America, that difference alone separates the two.
Who Should Use HostGator
US based blogs or small sites under 25k monthly visitors can choose HostGator since the host recorded a 496 ms US TTFB and a 204 ms average across 13 Americas locations, with Northern Virginia at 79 ms, Montreal at 93 ms and Toronto at 122 ms. Besides, HostGator is budget friendly with $3.75 per month and offers 99.97% uptime with roughly 10 min per month downtime, which is pretty reliable for non-commercial sites.
Sites serving Western Europe are also well covered. HostGator averaged 337 ms across 11 European locations, with Madrid at 292 ms, Paris and Belgium at 310 ms, and London at 329 ms. Every European location we tested came in under 420 ms, which is workable for a European readership.
WordPress sites with over 20 plugins and complex theming with Elementor, Divi or WooCommerce can largely benefit from HostGator’s strong server hardware. The host scored 9.6 out of 10 in WPBench, one of the highest raw server scores we recorded, which measures the CPU, memory, and disk I/O allocated to the plan. Only its sibling Bluehost matched that score, and no provider we tested scored higher at any price.
Users that need daily backups can benefit from HostGator’s daily backups for no extra charge. Bluehost offers only weekly backups despite belonging to the same parent company. 6 days of lost content can make a big difference sometimes, which is why daily backup is always the recommended way to go about managing a site.
Who Shouldn’t Use HostGator
HostGator is a poor fit for sites with Asia-Pacific audiences. The host averaged 686 ms across 15 Asia-Pacific locations, with Dubai at 1.1 seconds, Delhi at 907 ms, Mumbai at 874 ms and Jakarta at 742 ms. Even the fastest Asia-Pacific location, Tel Aviv at 451 ms, is slower than every European location we tested. Sites with meaningful traffic from India, Southeast Asia, Australia or the Middle East should look at WP Engine, which recorded 65 ms globally.
Ecommerce and revenue critical sites should note that HostGator recorded 7 outages and 1 hour 21 minutes of downtime across the window, while Pressable held 100% uptime with zero outages over the same period. For a store where a failed checkout is a lost sale, that gap matters. Such sites can go ahead with safer alternatives like WordPress.com with 100% uptime for $2.75 or WP Engine with 100% uptime for $27.
Sites that expect traffic spikes and need exceptional load handling can avoid HostGator since the host recorded 213 ms with a 2.0% error rate, the weakest load result of the four hosts compared above. Hostinger Business can be an ideal option for such sites as it recorded a load handling of 31 ms with 0% error, nearly 7x faster than HostGator.
Users that need email included can avoid HostGator as the host charges additional price for email. SiteGround is a better alternative to go with since it offers email for no extra charge for the same price point.
Our Verdict
HostGator is an ideal host for blogs serving North America or Western Europe and plugin heavy WordPress sites that need a budget host. HostGator delivers strong raw server resources with a WPBench score of 9.6 out of 10. Against its sibling Bluehost, HostGator holds a narrow uptime edge and better backups, but Bluehost is now faster under load.
Sites with Asia-Pacific audiences should avoid HostGator, which averaged 686 ms across 15 locations in that region against 204 ms in the Americas. Sites that expect traffic spikes and need the best load handling should also avoid HostGator since its average response time of 213 ms came with a 2.0% error rate. HostGator is not the right host for users that need email included as the host charges additional charges for email hosting.
Hostinger Business stands out as the best HostGator alternative as it comes at a slightly lower cost with $3.69 per month vs $3.75 per month, faster global TTFB with 351 ms vs 426 ms, and better load handling with 31 ms at 0% errors vs 213 ms at 2.0%. The only trade off is in terms of lower hardware score with 7.4 vs 9.6.
We reached our verdict based on 349,920 uptime and response time tests conducted between October 1, 2025 and May 31, 2026, alongside load testing, server benchmarking, and cached global TTFB measurement from 40 locations.
Methodology
We purchase hosting accounts with our own funds and conduct our tests using tools comprising Pingdom, GTmetrix, Loader.io, WPBenchmark, and SpeedVitals. We monitor at 60-second intervals, which produces 1,440 tests per provider per day. Our methodology data period runs from October 1, 2025 to May 31, 2026, a 243-day window producing 349,920 tests for HostGator. We tested a total of 34 providers.