SiteGround secured a performance score of 5.59 out of 10 in our 2026 rankings. The host recorded a TTFB of 745 ms and an uptime of 99.97% across our 8-month monitoring window from October 1, 2025 to May 31, 2026. We have been testing and monitoring SiteGround since 2020 with over 2,080 days of continuous monitoring and over 2.99 million individual performance tests conducted. SiteGround recorded its best TTFB in 2022 with 403 ms while the TTFB has now gone up to 745 ms, which clearly is an 85% degradation in the TTFB performance.
The host secured a WPBench score of 8.4 for hardware resource allocation, well clear of the 6.6 field median. However, the host recorded a global TTFB of 1,200 ms which reflects its weak delivery speed in global locations. In this article, we will get deeper into all the essential performance metrics and pricing to give you the clarity you need. Most importantly, we will explain who should choose SiteGround and who should avoid it.
Note: This review is based on our testing of SiteGround’s StartUp plan. The performance figures are measured data; the recommendations reflect our editorial assessment of those results. Unless stated otherwise, everything here applies to the StartUp plan while other SiteGround plans may produce different benchmark results.
Performance Overview
| Metric | Result | Score (/10) |
| TTFB (US) | 745ms | 3.75 |
| Uptime | 99.97% (29 outages) | 7.98 |
| Load Test | 170ms / 0.00% error | 6 |
| Global TTFB | 1,200ms | 3 |
| Server Hardware (WPBench) | 8.4 | 8.4 |
| Performance Total | 5.59/10 | — |
SiteGround secured 5.59 out of 10 for its overall performance. We see a contrast of excellent hardware and poor delivery speed. While SiteGround secured a WPBench score of 8.4 indicating strong hardware allocation on its plan, it secured 3.75 out of 10 in TTFB and 3 out of 10 in the global TTFB test, signaling poor delivery speed both in the origin server country and globally.
SiteGround passed the load test with 170 ms and 0% errors, which means the host can handle traffic spikes without error even though the page loading is slow.
The gap between SiteGround’s strong hardware and weak speed delivery also suggests that the host’s software stack or CDN implementation is not helping the performance. SiteGround’s 745 ms TTFB sits above the 700 ms mark alongside GoDaddy at 734 ms, against a field median of 465 ms.
TTFB Response Time
| Year | Avg TTFB | Uptime | Days Monitored | Tests | Outages |
| 2020 | 856ms | 99.99% | 110 | 158,400 | 7 |
| 2021 | 487ms | 99.99% | 365 | 525,600 | 14 |
| 2022 | 403ms | 99.99% | 364 | 524,160 | 52 |
| 2023 | 408ms | 99.99% | 365 | 525,600 | 17 |
| 2024 | 509ms | 99.99% | 366 | 527,040 | 18 |
| 2025 | 632ms | 99.96% | 362 | 521,280 | 44 |
SiteGround recorded a TTFB of 745 ms across our 8-month window, scoring 3.75 out of 10, which puts it above the 700 ms bracket and 280 ms slower than the field median of 465 ms. As we look into SiteGround’s historical data, we see a continuous regression. While the host recorded its worst calendar-year TTFB in 2020 with 856 ms, it got better in 2021 with 487 ms. The TTFB got even better in 2022 with 403 ms, which was also the best TTFB ever recorded by SiteGround. The performance declined slightly in 2023 with 408 ms, then further to 509 ms in 2024 and 632 ms in 2025. The current 745 ms figure is an 85% regression from the TTFB it recorded in 2022.
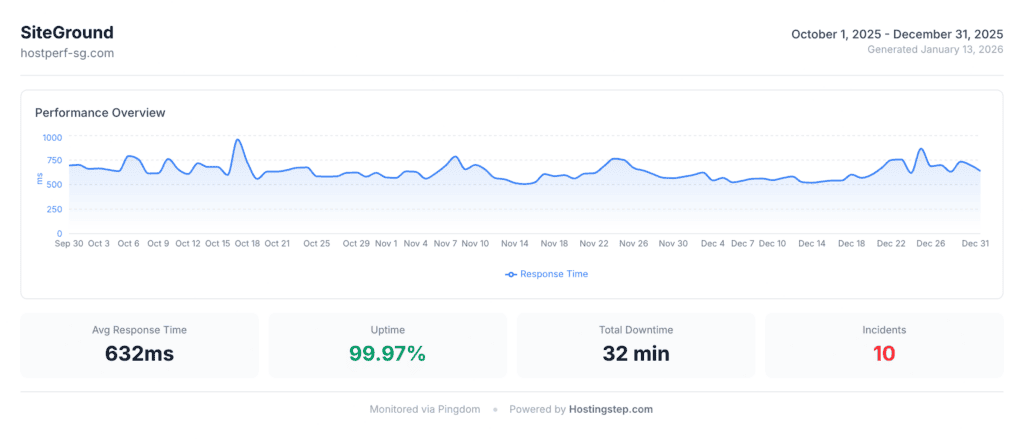
SiteGround showed genuine improvement from 2020 to 2022 since the host moved to Google Cloud Infrastructure during the period. However, the TTFB has worsened every year since, gaining 86 ms per year on average, and the current 745 ms figure now sits within 111 ms of the 2020 level. A TTFB of 745 ms means the host takes close to three quarters of a second just to respond before any page content loads. For a WordPress site that includes images and scripts, the total page loading time can go up to 3 to 4 seconds.
WordPress.com leads in this field with 319 ms, followed by Pressable with 320 ms and WP Engine with 355 ms. Even budget hosts like Hostinger and NameCheap recorded better TTFB than SiteGround with 447 ms and 471 ms respectively. It’s worth mentioning that the max response time reached 1,665 ms across our window while the minimum was 492 ms, a spike ratio of 2.24. This wide variance suggests inconsistent server performance.
Uptime
SiteGround recorded an uptime of 99.97% across our 8-month window, scoring 7.98 out of 10. The duration figure is acceptable but it is held back by 29 separate outages totalling 1 hour 47 minutes offline. As we look into the annual 2025 performance, it tells a similar story with 99.96% full year uptime with 193 minutes of total downtime caused by 44 outages over 44 days. 44 outages in 2025 is a big spike compared to 18 outages in 2024 and 17 outages in 2023 and 14 in 2021.
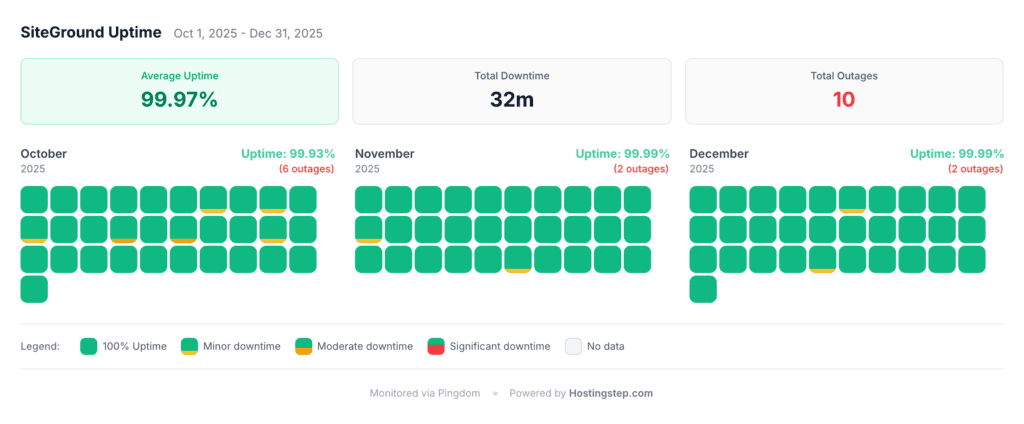
The worst single day uptime in 2025 was recorded as 95.35%, which means almost 5% of downtime with roughly 70 minutes offline in a single day. While SiteGround maintained 99.99% uptime from 2021 till 2024, the uptime dropped to 99.96% in 2025, and that was for the first time that the uptime dropped below 99.98% since the time we began monitoring.
193 minutes of downtime means over 3 hours offline across the year, which, for any eCommerce site doing $10k per month should cause a measurable revenue impact since every hour counts. Hosts that recorded 100% uptime with zero outages across our 8-month window include WordPress.com, Pressable, and WP Engine. While SiteGround’s 99.97% is adequate on duration, the outage count is a little concerning at 29 across the window and 44 across the 2025 calendar year.
Load Handling
SiteGround passes the load test with an average response of 170 ms with 0% errors under a concurrent traffic of 100 users. We tested the host’s load handling by using Loader.io to send 100 concurrent users in 60 seconds. Even though the host passed the load test, and no visitor will receive any error, the average response time was not that impressive since it falls in the bracket of 150 ms to 250 ms, indicating slow page loading.
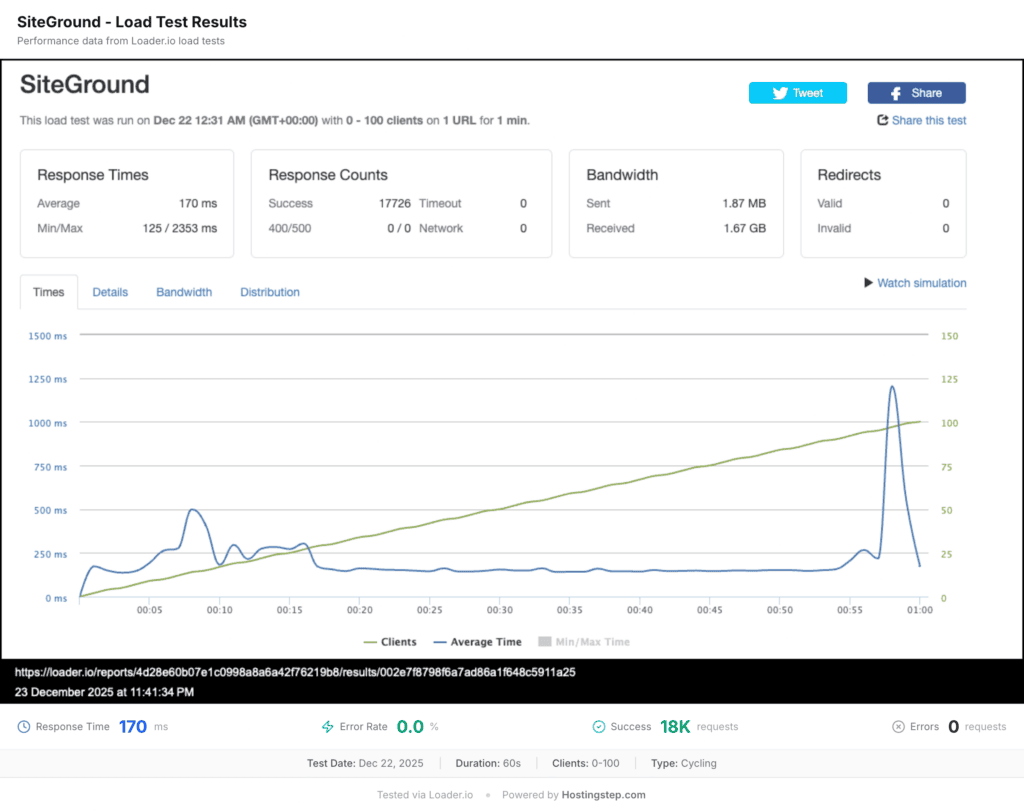
Hosts that did exceptionally well in this field include WP Engine with 27 ms, Hostinger Business with 31 ms, and GreenGeeks with 26 ms, and these hosts are 5x to 7x faster under load. Bluehost now completes the same test at 41 ms with 0% errors, roughly 4x faster than SiteGround. On the other side, hosts like Rocket.net, Ionos and GoDaddy returned error rates above 50% under the same test, and SiteGround is not in that group.
SiteGround’s 170 ms average response time with 0% error rate means your site visitors will experience slow page loading during traffic spikes but the site will stay up and running. At times like these, your site pages that usually take 2 seconds to load may take up to 3 seconds.
Server Hardware (WPBench)
SiteGround scored a WPBench score of 8.4 out of 10 and is one of the top performers in this field, well clear of the 6.6 field median. Hosts that scored higher include Bluehost and HostGator with 9.6, and ScalaHosting and Kinsta with 8.8. SiteGround’s WPBench score of 8.4 means the host allocates strong CPU, RAM, and disk I/O resources on its StartUp plan. However, that level of resource allocation would normally point to a sub 500 ms TTFB and the host delivers 745 ms.
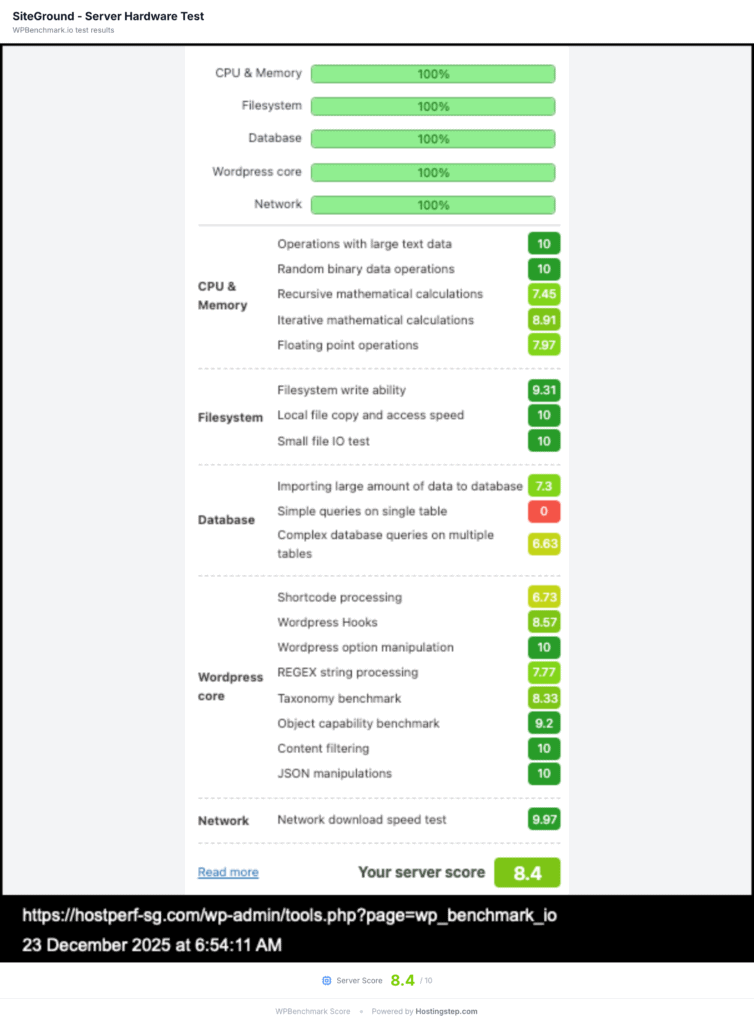
The gap suggests the bottleneck has nothing to do with hardware and is caused due to software configuration, or CDN implementation or server side caching effectiveness. For users, it means plugin heavy WordPress sites and WooCommerce stores with complex database queries will be smooth because of the strong underlying compute but the delivery speed still will remain slow. SiteGround offers more raw power than Hostinger Business with a WPBench score of 7.4 and Cloudways Standard with 4.7 in spite of having a cheaper intro price.
Global TTFB
| Region | Avg | Best City | Worst City |
| Americas | 679ms | Iowa 194ms | Montreal 1.9s |
| Europe | 1.6s | Netherlands 55ms | Paris 5.4s |
| Asia-Pacific | 1.4s | Taiwan 379ms | Delhi 3.9s |
SiteGround recorded an average global TTFB of 1,200 ms in our April 17, 2026 cached test from 40 locations, scoring 3 out of 10 against a field median of 390 ms. Even though SiteGround offers a CDN Addon, it’s not edge and doesn’t offer aggressive edge caching as used by WP Engine with an average global TTFB of 65 ms or Hostinger Business with 351 ms. The global TTFB average for the Americas is 679 ms, with Iowa recording the best result at 194 ms, followed by Oregon at 346 ms and South Carolina at 354 ms. The West Coast is average with 381 ms in Los Angeles and 380 ms in Las Vegas. The host recorded far higher TTFB elsewhere in the region with 886 ms in Santiago, 834 ms in São Paulo and 1.9 seconds in Montreal.
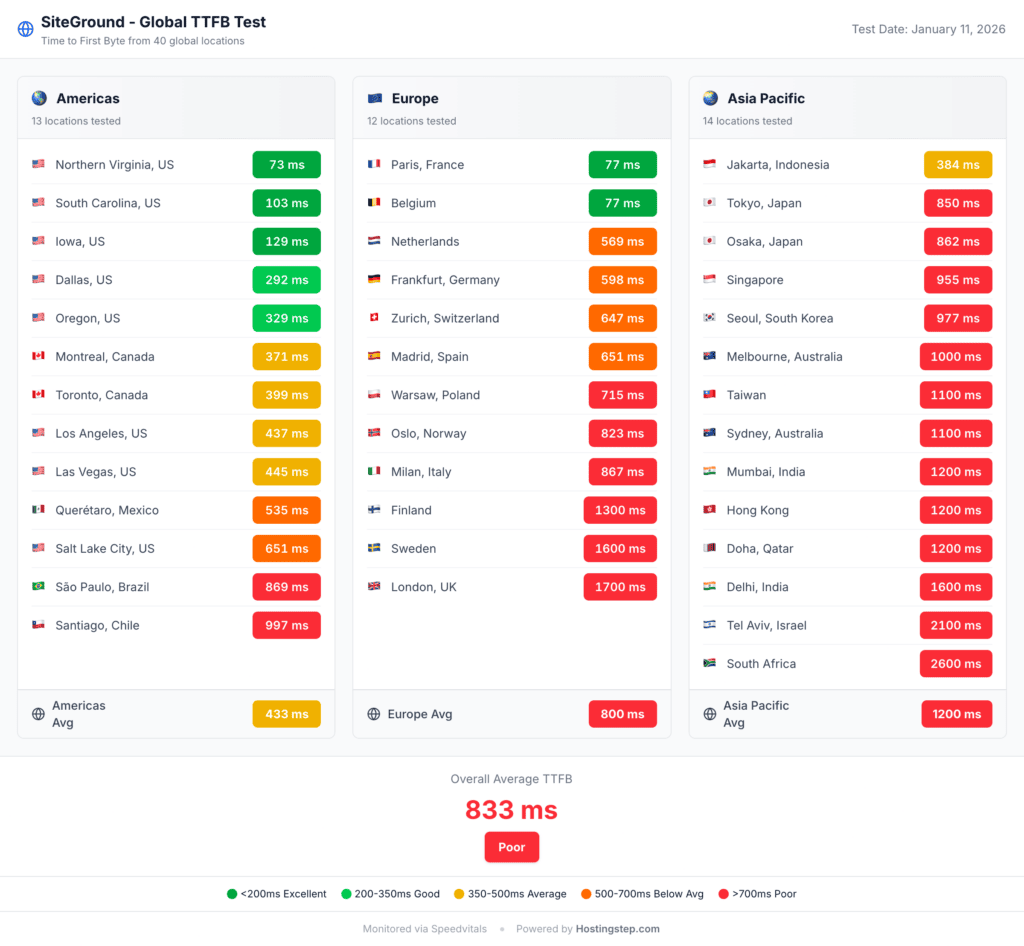
The global TTFB average in Europe is 1.6 seconds. The result was excellent in the Netherlands at 55 ms, but the rest of the continent is far slower with 598 ms in Frankfurt, 719 ms in Sweden, 902 ms in Zurich, 1.3 seconds in London, 1.9 seconds in Madrid, 3.2 seconds in Milan and 5.4 seconds in Paris. The European data indicates that SiteGround’s CDN is not caching consistently across the region, with Paris responding 98x slower than the Netherlands on the same continent.
The global TTFB is at its worst in Asia Pacific with an average of 1.4 seconds. Only Taiwan came in below 800 ms at 379 ms, with 885 ms in Sydney, 897 ms in Tokyo, 1 second each in Singapore, Seoul and Osaka, 1.3 seconds in Mumbai, 1.8 seconds in Dubai and Hong Kong, and 3.9 seconds in Delhi. For any site targeting Asian audiences, this is a dealbreaker. The best hosts in this field are WP Engine with 65 ms, Rocket.net with 66 ms, WordPress.com with 69 ms and Bluehost with 224 ms. SiteGround is 5x to 18x slower than these hosts in terms of global delivery speed. Choosing SiteGround can be a major disadvantage for any site that draws a meaningful share of its traffic from outside the United States.
SiteGround vs Competitors
| Metric | SiteGround | Hostinger Business | Bluehost | Cloudways Standard | WP Engine |
| Performance Score | 5.59 | 8.35 | 8.45 | 7.47 | 9.57 |
| TTFB | 745ms | 438ms | 498ms | 442ms | 355ms |
| TTFB Score | 3.75/10 | 8/10 | 7.25/10 | 8/10 | 9.25/10 |
| Uptime | 99.97% | 99.99% | 99.99% | 99.99% | 100% |
| Load Test | 170ms/0% | 31ms/0% | 41ms/0% | 282ms/2% | 27ms/0% |
| Load Score | 6/10 | 9/10 | 9/10 | 4.9/10 | 10/10 |
| Global TTFB | 1,200ms | 351ms | 224ms | 386ms | 65ms |
| Global Score | 3/10 | 7/10 | 8/10 | 7/10 | 10/10 |
| WPBench | 8.4 | 7.4 | 9.6 | 4.7 | 6.5 |
| CDN | Addon | Static | Static | Addon | Edge |
| Included | Addon | Addon | Addon | None | |
| Backups | Daily | Daily | Weekly | Daily | Daily |
| Intro Price | $2.99/mo | $3.69/mo | $1.99/mo | $11.00/mo | $27.00/mo |
| Renewal | $17.99/mo | $16.99/mo | $8.99/mo | $11.00/mo | $30.00/mo |
SiteGround vs Hostinger Business
Hostinger wins on delivery speed across every metric including TTFB with 438 ms vs 745 ms, global TTFB with 351 ms vs 1,200 ms, and Load test with 31 ms vs 170 ms. SiteGround wins on hardware with 8.4 vs 7.4 and also includes email hosting for no extra charges while Hostinger charges additionally for it.
Hence, you can choose SiteGround if you need email included and strong server hardware for plugin heavy sites with a US-based audience. You must choose Hostinger Business if you want a faster page load, better global reach and a stronger performance score at a similar price point. See our Hostinger coupon page for the latest pricing.(Check Hostinger Review)
SiteGround vs Bluehost
Bluehost beats SiteGround on TTFB with 498 ms vs 745 ms, global reach with 224 ms vs 1,200 ms, uptime with 99.99% vs 99.97%, load handling with 41 ms vs 170 ms and WPBench score with 9.6 vs 8.4. SiteGround offers daily backups while Bluehost offers only weekly, and includes email hosting at no extra cost.
You can choose SiteGround if you need daily backups and email included more than faster global delivery speed. However, if you need better global performance and raw server power, you must choose Bluehost over SiteGround. (Check Bluehost Review)
SiteGround vs Cloudways Standard
Cloudways has a leading edge over SiteGround in terms of speed with a TTFB of 442 ms, a global TTFB of 386 ms and an uptime of 99.99% across our window. SiteGround wins on price with $2.99 vs $11.00, on load handling with 170 ms vs 282 ms, and on WPBench score with 8.4 vs 4.7. Besides, SiteGround includes email for no extra cost and offers its own Site Tools control panel while Cloudways offers none.
You can choose SiteGround if you are under a tight budget and want an affordable and easy to use host with email included for no additional cost. You can choose Cloudways if you need cloud level performance and want developer friendly features. (Check Cloudways Review)
SiteGround vs WP Engine
WP Engine wins on TTFB with 355 ms vs 745 ms, Uptime with 100% vs 99.97%, Load handling with 27 ms vs 170 ms and Global TTFB with 65 ms vs 1,200 ms. While WP Engine has a clear performance edge over SiteGround, SiteGround wins on price with $2.99 vs $27.00, and WPBench with 8.4 vs 6.5. Besides, SiteGround offers email hosting for no additional cost while WP Engine doesn’t offer one. (Check WP Engine Review)
You can choose SiteGround if budget is your primary constraint and you can tolerate below average speed. You must choose WP Engine over SiteGround if performance and reliability matters more than 9x the cost.
Who Should Use SiteGround
Blogs and small sites with US based audiences and below 20k monthly visitors can consider SiteGround because of its best regional results such as 194 ms in Iowa and an affordable intro price of $2.99 per month with included email. SiteGround offers value for low traffic sites that do not need a global reach, provided you accept the $17.99 renewal.
Users who need email hosting included for no additional cost, SiteGround is one of best options to go with as it’s available at an affordable intro price of $2.99 per month, renewing at $17.99, plus included email at no extra cost. Hosts like Hostinger, Bluehost, and Cloudways charge extra for email.
Plugin heavy WordPress sites or WooCommerce sites can benefit from SiteGround’s excellent server compute since the host secured a WPBench score of 8.4 indicating strong CPU, RAM, and I/O allocation. The strong hardware allocation can efficiently handle the complex database queries even though the front end delivery is slow.
Who Should NOT Use SiteGround
Sites that rely on international traffic should avoid SiteGround since the host has poor global TTFB with an average of 1,200 ms. The average is as high as 1.6 seconds in Europe and 1.4 seconds in Asia Pacific. Such sites can choose Hostinger Business with 351 ms or WP Engine with 65 ms.
Ecommerce sites must avoid SiteGround since the host recorded a TTFB of 745 ms, which is slow for product pages. SiteGround’s TTFB alone adds 280 ms over the field median of 465 ms.
Sites expecting an increase in traffic should not choose SiteGround since our data reveals a TTFB performance regression from 403 ms in 2022 to 745 ms in our latest window, which raises concerns about future performance trajectory. If the same trend continues, sites growing with SiteGround may need to migrate later.
Sites with UK or EU audiences should avoid SiteGround since the host recorded 1.3 seconds in London, 1.9 seconds in Madrid, 3.2 seconds in Milan and 5.4 seconds in Paris. European visitors outside the Netherlands will experience poor page loading.
Our Verdict
SiteGround scored 5.59 out of 10 for performance in our 2026 rankings. We recommend SiteGround for users who need an affordable shared host with email included, daily backups and strong hardware for US audiences with low traffic.
We do not recommend SiteGround for sites that need fast global page loads and serve international traffic. We also do not recommend SiteGround for eCommerce sites where speed impacts revenue, as SiteGround’s TTFB has worsened 85% since 2022, from 403 ms to 745 ms.
Such sites can choose better alternatives like Hostinger Business at $3.69 per month, which scored 8.35 for performance and offers a 351 ms global TTFB. While Hostinger’s intro price is slightly higher than SiteGround’s at $3.69 vs $2.99, its renewal at $16.99 also comes in below SiteGround’s $17.99.
Methodology
We monitor a total of 34 providers and the hosting accounts we use for testing were purchased with our own funds. They are not promotional or press accounts. We use Pingdom for measuring TTFB and uptime, every 60 seconds, across 19 US locations, Loader.io for load testing, SpeedVitals for cached global TTFB across 40 locations, and WPBenchmark to measure server hardware, conducting 21 tests across 5 categories.
Our methodology based testing frequency consists of 1,440 tests per provider per day, or 525,600 per year, running every minute 24/7/365. Our current data period runs from October 1, 2025 to May 31, 2026, a 243-day window covering 349,920 individual tests on SiteGround. For writing this review, we also used SiteGround historical data going back to 2020, which amounts to 2,083 days and 2,999,520 tests in total.