Hosting.com, formerly A2 Hosting before it was acquired by World Host Group, recorded an average of 500 ms and 99.96% uptime across 349,920 checks between October 1, 2025 and May 31, 2026. The host secured an overall performance score of 6.84 out of 10 in our 2026 WordPress hosting rankings. The entry plan starts at $2.99 per month, which makes it a budget option.
The plan renews at $11.99 per month. The host has replaced A2 Hosting’s data centers with new infrastructure. Hence, this is a clean slate review for this host. In this review, we will walk you through Hosting.com’s TTFB, Uptime, Load test, Global TTFB, WP Bench (Hardware) and Pricing.
Besides, we will compare the host with its competitors: Hostinger Business, Bluehost, InMotion and SiteGround to see the strengths and weaknesses. Most importantly, we will explain who should choose the hosting service and who should avoid it.
Note: This review is based on our testing of Hosting.com’s Starter plan. The performance figures are measured data; the recommendations reflect our editorial assessment of those results. Unless stated otherwise, everything here applies to the Starter plan while other Hosting.com plans may produce different benchmark results.
Key Findings Summary
| Metric | Result | Score |
| TTFB (US) | 500ms (375–1,079ms, spike ratio 2.16) | 6.00 / 10 |
| Uptime | 99.96% (49 outages, 2h 12m down) | 7.29 / 10 |
| Load Test | 43ms / 0.00% error | 9 / 10 |
| Global TTFB | 642ms | 5.0 / 10 |
| WPBench (Hardware) | 5.5 / 10 | 5.5 / 10 |
| OVERALL PERFORMANCE | 6.84 / 10 |
Hosting.com recorded 43 ms with 0% in the Load test, reflecting excellent load handling capacity. Besides, Hosting.com recorded an uptime of 99.96%, held back by 49 separate outages against a field median of 9. The host offers a competitive intro price of $2.99 per month with email included for no extra charges. Besides, all plans come with daily backup included plus 30 day retention.
Hosting.com doesn’t come with a CDN, which significantly hampers its global performance. Further, the host has below average hardware with a WP Bench score of 5.5 out of 10. The renewal pricing is $11.99 per month, which is a 301% increase from the intro price ($2.99 per month). The global TTFB averaged 642 ms and falls away sharply outside America out of not having a CDN.
TTFB
Hosting.com recorded a TTFB of 500 ms over our 8-month window with a score of 6 out of 10, against a field median of 471 ms. The range matters more than the average here: responses ran from 375 ms at best to 1,079 ms at worst, a spike ratio of 2.16. A host that is usually acceptable but occasionally stalls past a second is harder on Core Web Vitals than a slightly slower host that stays steady. We tested the TTFB using the Pingdom tool monitoring across 19 US locations every 60 seconds 24/7, from October 1, 2025 to May 31, 2026.
A TTFB of 500 ms is adequate for a blog or small site with a US based audience, but it has moved the wrong way. Our first three months on the new infrastructure averaged 462 ms; five more months of data pushed that to 500 ms and exposed the spikes the shorter window hid. This remains the first full picture of the new Hosting.com infrastructure, so we have no multi-year baseline to compare it against.
Uptime
Hosting.com recorded an uptime of 99.96% over our 8-month window with a score of 7.29 out of 10, still above the host’s 99.9% SLA commitment. Now, this uptime is different from the provider’s marketing claim since we tested it.
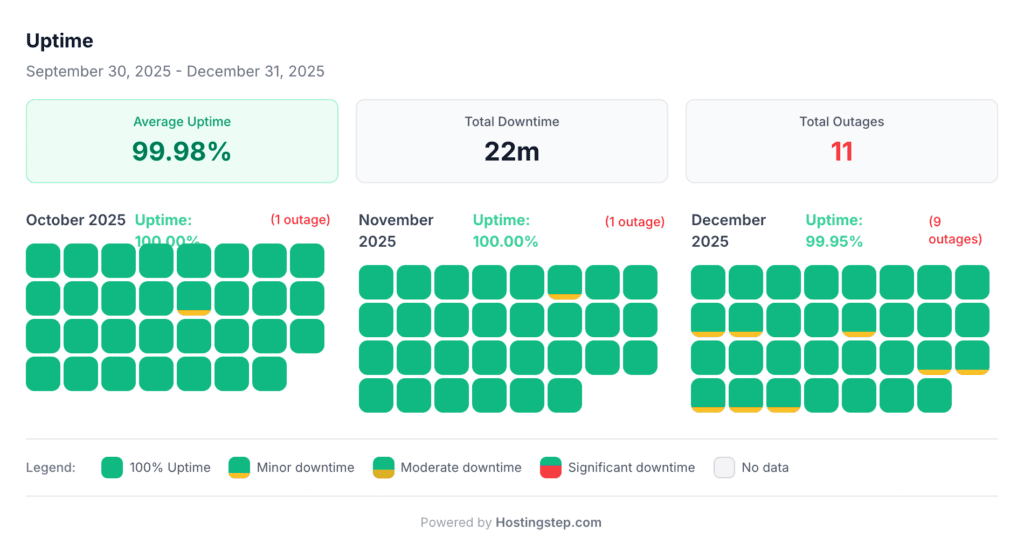
The headline percentage is not the problem. Total downtime came to 2 hours 12 minutes across eight months, which is unremarkable. The problem is how that downtime was distributed. Hosting.com logged 49 separate outages against a field median of 9. Short, frequent flickers are worse for visitors than one long outage of the same duration, because each one drops sessions, breaks checkouts and fails uptime checks, and none of it shows up in a percentage. Our Q4 2025 snapshot showed 99.98% and looked clean. The full eight months show a host that goes briefly unreachable roughly every five days.
Load Testing
For sites that expect traffic spikes, it’s crucial to get a host that can handle the traffic spikes and it’s one such area where cheap hosts often fail. We tested the load handling capacity of Hosting.com by using Loader.io to send 0 to 100 concurrent users over 60 seconds.
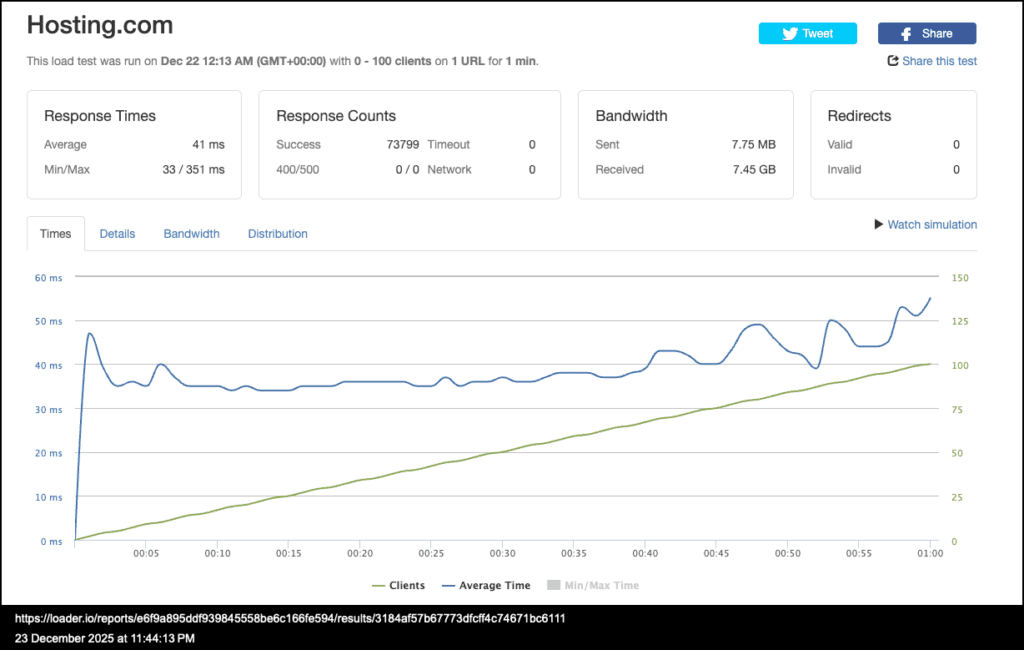
The host recorded an average response time of 43 ms with zero error rate, scoring 9 out of 10. This is Hosting.com’s strongest result by a wide margin and the one metric where it outperforms hosts several times its price, including Rocket.net.
Hosting.com stands among the best hosts in this field including Pressable with 12 ms, WordPress.com with 16 ms, GreenGeeks with 26 ms and InMotion with 31 ms. All of these providers including Hosting.com recorded zero errors in the Load test. Interestingly, Hosting.com at $2.99 per month actually outperformed hosts that cost 3x to 8x more.
Server Hardware (WPBench)
WP Bench tests the raw server resources meaning CPU, RAM, and disk I/O, independent of caching. Hosting.com scored 5.5 out of 10, which reflects modest allocated resources, which is expected for a $2.99 per month shared plan. The top performers in this field are Bluehost with 9.6, ScalaHosting with 8.8, Kinsta with 8.8, and SiteGround with 8.4.
The 5.5 score measures allocated CPU, RAM and disk I/O, not the web server software running on top of it. Cached pages will not feel the limit, but plugin heavy sites, WooCommerce stores and sites with complex database queries will, because those requests bypass the cache and run against the raw allocation.
The low score indicates limited allocated resources and doesn’t indicate any server issue. The Starter plan comes with 2GB RAM, 2 vCPUs, LiteSpeed Web Server, AMD EPYC CPU, and NVMe SSD.
Global TTFB
Hosting.com recorded an average global TTFB of 642 ms, scoring 5 out of 10 in the test, against a field median of 390 ms. The TTFB in America is strong as the server is US based. Outside America it degrades sharply, and that gap is what drags the average to 642 ms. The difference in TTFB is mainly caused due to the absence of a CDN as every request will have to travel to the origin server, which in our case is Dallas.
The issue can be largely avoided using an edge CDN. Hosts using edge CDN have recorded excellent global TTFB with WP Engine (65ms), and Pressable (74ms). Hostinger Business outperforms Hosting.com with 351 ms vs 642 ms just by using a static CDN. While Hosting.com is adequate for sites with US based audiences, sites with international audiences should avoid Hosting.com and choose good hosts with CDN like WP Engine, or Pressable. Hosting.com does advertise Cloudflare Enterprise CDN through a Rocket.net integration on its managed WordPress plans, starting at $11.99 per month, but the shared plan we tested did not include it. Hostinger Business bundles a static CDN at $3.69 per month.
Hosting.com does operate nine data centers, across Ashburn, Dallas, Toronto, London, Frankfurt, Mexico City, Mumbai, Singapore and Sydney, but these are an either/or choice at signup rather than a network. Your files live on one server in one location, with no replication between them. Our test site runs from Dallas, so the figures above measure the distance from Texas to each test city. Picking the region closest to your audience helps, but you only get to pick one, and every visitor outside it pays the latency.
Hosting.com vs Competitors
| Metric | Hosting.com | Hostinger Business | Bluehost | InMotion | SiteGround |
| Performance Score | 6.84 | 8.35 | 8.45 | 7.78 | 5.59 |
| TTFB | 500ms | 438ms | 498ms | 529ms | 745ms |
| Uptime | 99.96% | 99.99% | 99.99% | 99.98% | 99.97% |
| Outages | 49 | 6 | 10 | 32 | 29 |
| Load Test | 43ms/0% | 31ms/0% | 131ms/0% | 31ms/0% | 170ms/0% |
| Global TTFB | 642ms | 351ms | 224ms | 390ms | 1,200ms |
| WPBench | 5.5 | 7.4 | 9.6 | 7.4 | 8.4 |
| CDN | None | Static | Static | None | Addon |
| Included | Included | Addon | Included | Included | |
| Backups | Daily | Daily | Weekly | Addon | Daily |
| Intro Price | $2.99 | $3.69 | $1.99 | $4.79 | $3.99 |
| Renewal | $11.99 | $16.99 | $8.99 | $10.99 | $17.99 |
Hosting.com vs Hostinger Business
Hostinger Business scores higher than Hosting.com with 8.35 vs 6.84. Hostinger comes with static CDN and offers comparatively better global TTFB with 351 ms vs 642 ms. Hostinger also beats Hosting.com on hardware with a WP Bench score of 7.4 vs 5.5. Hosting.com is cheaper both to start at $2.99 vs $3.69 and at renewal with $11.99 vs $16.99.
However, Hostinger Business edges Hosting.com on load handling with 31 ms vs 43 ms, both at zero errors, and holds a far steadier uptime record with 6 outages vs 49. Hostinger Business is the stronger package on performance, while Hosting.com wins only on price at $2.99 to start and $11.99 on renewal.
Hosting.com vs Bluehost
Bluehost is cheaper to start at $1.99 vs $2.99 and scores higher with 8.45 vs 6.84. The two are effectively tied on TTFB with 500 ms vs 498 ms, but Bluehost holds better uptime with 99.99% vs 99.96% and far fewer outages with 10 vs 49. Hosting.com keeps an edge on load handling with 43 ms vs 131 ms, both at zero errors. Bluehost beats Hosting.com on global TTFB with 224ms vs 642ms, which is possible because of its CDN.
Bluehost also has a better hardware score with 9.6 vs 5.5 and cheaper renewals with $8.99 vs $11.99. Bluehost is the stronger pick on nearly every axis here: cheaper entry, cheaper renewal, fewer outages, almost three times faster global delivery and far more server resources. Hosting.com’s remaining case is load handling.
Hosting.com vs InMotion Hosting
Hosting.com is cheaper than InMotion Hosting at $2.99 per month vs $4.79 per month but scores lower with 6.84 vs 7.78. Hosting.com beats InMotion on TTFB with 500 ms vs 529 ms, but InMotion is well ahead on global TTFB with 390 ms vs 642 ms. Besides, Hosting.com includes daily backups where InMotion charges extra for them.
InMotion, on the other hand, has better uptime with 99.98% vs 99.96% and fewer outages with 32 vs 49, better load handling with 31 ms vs 43 ms and better hardware with a WP Bench score of 7.4 vs 5.5. Further, InMotion’s renewal price is lower than that of Hosting.com with $10.99 vs $11.99. Hosting.com is the cheaper entry point while InMotion is the better host for sites that need raw server resources, global reach and steadier uptime.
Hosting.com vs SiteGround
Hosting.com recorded better TTFB than SiteGround with 500 ms vs 745 ms, though SiteGround edges it on uptime with 99.97% vs 99.96%. The host beats SiteGround on load handling with 43 ms/0% vs 170 ms/0% and global TTFB with 642 ms vs 1,200 ms. However, SiteGround wins on hardware with 8.4 vs 5.5.
Hosting.com is cheaper to start at $2.99 vs $3.99, and SiteGround has a significantly higher renewal price with $17.99 vs $11.99. You can choose Hosting.com if you need performance but if you rely on brand reputation and Google Cloud infrastructure, you can go with SiteGround.
Pricing & Plans
| Plan | Sites | Storage | RAM | vCPUs | Intro/mo | Renew/mo | Increase |
| Starter | 1 | 15 GB | 2 GB | 2 | $2.99 | $11.99 | 301% |
| Pro | 10 | 50 GB | 6 GB | 4 | $6.99 | $22.99 | 229% |
| Max | 100 | 100 GB | 8 GB | 4 | $8.99 | $27.99 | 211% |
Hosting.com’s intro price of $2.99 per month undercuts SiteGround at $3.99 and InMotion at $4.79. However, the renewal price of $11.99 per month is a 301% increase from the intro price. SiteGround’s renewal is far steeper with $17.99 and Hostinger Business renews at $16.99, while Bluehost renews at $8.99 and InMotion at $10.99. Hence, Hosting.com’s renewal sits mid pack, cheaper than SiteGround and Hostinger Business but dearer than Bluehost and InMotion.
All three plans are billed on a 1-year term, so the advertised monthly rate is prepaid in full. Starter costs $35.88 upfront and $143.88 on renewal, Pro costs $83.87 upfront and $275.88 on renewal, and Max costs $107.88 upfront and $335.88 on renewal. Every plan includes email, daily backups and a free domain registration.
Who Should (and Shouldn’t) Use Hosting.com
Blogs with US based audiences and small business sites looking for a budget friendly host with reliable load handling can go with Hosting.com. Sites that expect traffic spikes can largely benefit from choosing Hosting.com since the host recorded an excellent load handling of 43 ms with zero errors at such a low price point.
Users who need email and daily backups included for no additional cost can choose Hosting.com. Users who are comfortable with cPanel and need a familiar interface can choose Hosting.com. Sites where brief unavailability is tolerable will be fine, but sites where it is not, such as checkout flows, lead forms and booking systems, should look elsewhere, because we recorded 49 separate outages over eight months.
Hosting.com is not ideal for sites that rely on international traffic since the host lacks CDN and averaged 642 ms global TTFB. Users who are looking for cheaper renewals should avoid Hosting.com as its renewal price of $11.99 is 301% more than the intro price of $2.99. Bluehost offers cheaper renewals than Hosting.com with $8.99 vs $11.99.
Users who largely rely on brand’s reputation, Hosting.com is a brand which is less than a year old. Most importantly, customer reviews are still mixed as it migrated from A2 Hosting.
Final Verdict
Hosting.com scored 6.84 out of 10 in our 2026 WordPress hosting rankings. At an entry price point of $2.99 per month for the Starter plan for 1 year term, it offers excellent load handling during traffic spikes and includes email and backups for no additional charges. However, the host suffers from poor global TTFB, has no CDN, and logged 49 outages over eight months.
It’s not an ideal choice for sites that rely on international traffic. Besides, the renewal price is expensive with $11.99 per month and is not an ideal host for users looking for budget plans. The host is also not ideal for heavy WordPress sites considering the poor WP Bench score of 5.5 out of 10.
The rebranding of A2 Hosting brought fresh infrastructure, and our first three months of data looked promising at 462 ms and 99.98%. Eight months tells a different story. Load handling held up at 43 ms, but TTFB drifted to 500 ms, global TTFB to 642 ms, and the outage count reached 49. This is exactly why we hold new infrastructure for a full window before recommending it.
At $2.99 per month, the host undercuts SiteGround and InMotion but no longer outperforms its price peers on the core metrics. Bluehost matches its TTFB, beats its uptime and triples its global delivery speed for a dollar less to start. As we compared, Bluehost at $1.99 and Hostinger Business at $3.69 both offer stronger overall packages, with a CDN included in each.
Methodology
We purchased all hosting accounts we needed for our testing with our own funds. None of these accounts are promotional or free press accounts. The tools we use for testing comprises Pingdom for TTFB and Uptime, Loader.io for Load Testing, WPBenchmark for hardware, and SpeedVitals for global TTFB. We conduct over 525,600 tests per provider every year and monitor them every 60 seconds, 24/7. We test the performance of 34 providers in over 40 cities across America, Europe, and Asia Pacific.
The data period we referred to for writing this article runs from October 1, 2025 to May 31, 2026, an eight month window covering 243 days and 349,920 TTFB and uptime checks on this host. Our history is limited to this window because A2 Hosting was rebranded to Hosting.com with completely new infrastructure, and we do not carry pre-migration data forward. We use a standardized test environment for testing using WordPress with the Twenty Twenty-Four theme and identical plugins. Our Hosting.com test site runs on the Starter plan from the Dallas data center.