Hostinger is one of the few hosts where we bought accounts on two different plans and tested them side by side. Both the Premium and Business plan recorded 99.98% uptime and sub-450ms TTFB response time across 243 days of monitoring, but the Business plan outperforms Premium on load handling (31ms vs 245ms) and global TTFB performance (351ms vs 404ms).
We have started monitoring Hostinger Premium since 2021 and we have accumulated over 2,793,600 performance tests across TTFB and uptime. Hostinger is one of the most popular hosting providers and we don’t want to rate them only based on the premium plan. So we bought their business plan in 2025, installed WordPress using our standardised setup and started monitoring the performance. Between October 1, 2025 and May 31, 2026, the major difference between the business and premium plan is that the business offers 8x faster load handling and 13% faster global performance due to the presence of CDN. In conclusion, Hostinger Premium suits best for sites that are just starting out with limited real time traffic and we recommend Hostinger’s business plan for sites which are already established and receiving a good number of concurrent visitors.
Note: This review is based on our testing of Hostinger’s Premium and Business plans. The performance figures are measured data; the recommendations reflect our editorial assessment of those results. Unless stated otherwise, everything here applies to the Premium and Business plans while other Hostinger plans may produce different benchmark results.
Performance overview
Here is the complete performance data for both the Hostinger plans, tested from October 1, 2025 to May 31, 2026 — 243 days and 349,920 tests per plan.
| Metric | Premium | Business |
| TTFB (US) | 447ms | 438ms |
| Uptime | 99.98% | 99.98% |
| Outages | 11 (38 min) | 6 (37 min) |
| Load Test | 245ms / 0% err | 31ms / 0% err |
| Global TTFB | 404ms | 351ms |
| Server Hardware | 7.4/10 | 7.4/10 |
The numbers tell a clear story where TTFB, uptime and server hardware scores are much similar as they are using the same server infrastructure. The difference can be seen in load handling where the business loads 8x faster under 100 concurrent users (31ms vs 245ms) and then the global TTFB serves 13% faster on the Business plan (351ms vs 404ms). There is a $0.70 per month difference between these two plans and that’s where the upgrade investment goes.
We have bought both the Hostinger premium and business plan using two separate accounts for testing. Usually we only test using the starter plan of the respective companies however Hostinger being popular and there is a big difference between the premium and business plan we have decided to test both the plans. This dual plan approach gives us unique test data where you can choose a plan based on your specific needs rather than a generic claim of whether Hostinger is good or bad.
TTFB Response Time
Hostinger Premium records an average TTFB of 447 ms and Business records 438 ms across 243 days of monitoring. There is a 9ms difference which is statistically negligible and upgrading to business does not improve the base server response time for your sites.
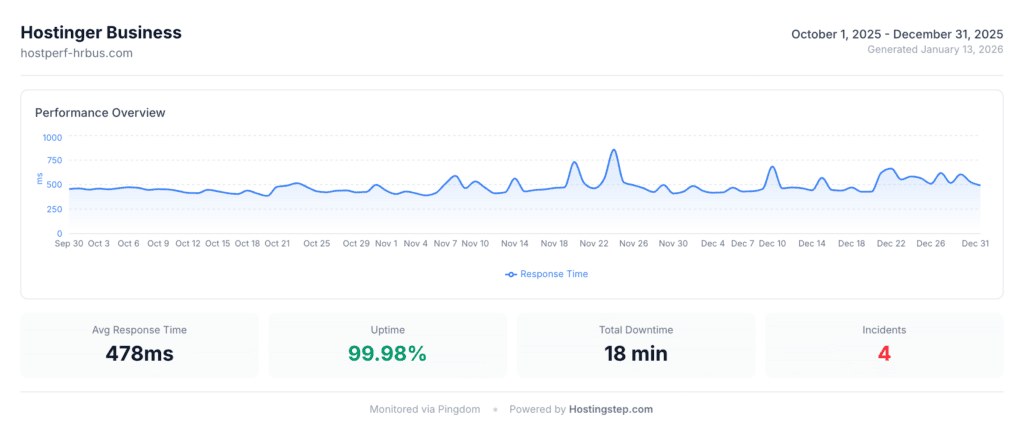
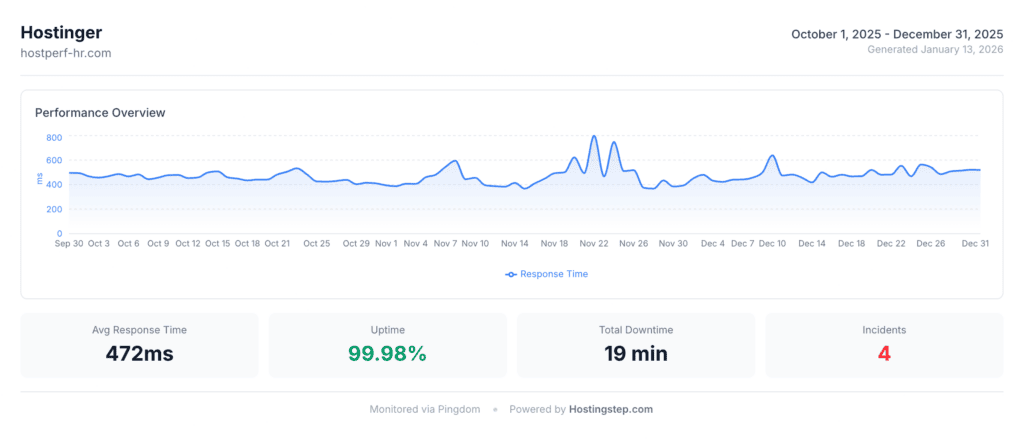
For context, Pressable records the fastest TTFB at 320 ms, while the median of all 34 hosts we monitor is approximately 465 ms. Our data shows Hostinger sits slightly ahead of the median, not so fast but not bad either and it is competitive and stable.
We tested Hostinger by hosting our test site in their US data centre. Hostinger offers 13 data center locations and choose a data center location close to your target audience for faster TTFB response time.
Historical TTFB: Premium Plan (2021 – 2025)
We have been testing Hostinger premium plans since 2021 and we can show you how Hostinger TTFB has performed over time.
| Year | Avg TTFB | Min | Max |
| 2021 | 424ms | 299ms | 3,210ms |
| 2022 | 428ms | 309ms | 3,232ms |
| 2023 | 381ms | 299ms | 691ms |
| 2024 | 444ms | 341ms | 707ms |
| 2025 | 483ms | 367ms | 799ms |
The TTFB of Hostinger has remained between 381-483 ms over the last five years. This indicates that its infrastructure is stable. The 2023 average of 381 ms is the best score out there. If you look into the Max TTFB, it was 3210 ms and 3232 ms in 2021 and 2022. Historically, we have not recommended them in the first three years of our testing and we have started recommending them only from 2024 as we got stable performance data with no max TTFB response times.
We have started monitoring the business plan performance from August 2025 and we now have 10 months of data. We are also currently monitoring Hostinger’s Cloud Startup plan and will add that data to this review once we have a full comparable testing window.
Methodology: Our Hostinger test site is hosted in their North Carolina data center. We use the Pingdom synthetic monitoring tool to measure the average server response time. Our test site is pinged every 60 seconds from 19 North American locations – Atlanta, Chicago, Dallas, Denver, Las Vegas, Los Angeles, Matawan, New York, Phoenix, Portland, Salt Lake City, San Francisco, Seattle, St.Louis, Tampa, Washington, Montreal, Toronto and Vancouver. The average response time for each of the visits is calculated. For the October 1, 2025 to May 31, 2026 window reported above, that works out to 349,920 datapoints per plan across 243 days.
Uptime
Both the Hostinger Premium and Business plan recorded 99.98% uptime between October 1, 2025 and May 31, 2026. Premium recorded 11 outages totalling 38 minutes and Business recorded 6 outages totalling 37 minutes. Both exceed Hostinger’s guaranteed 99.9% Uptime SLA.
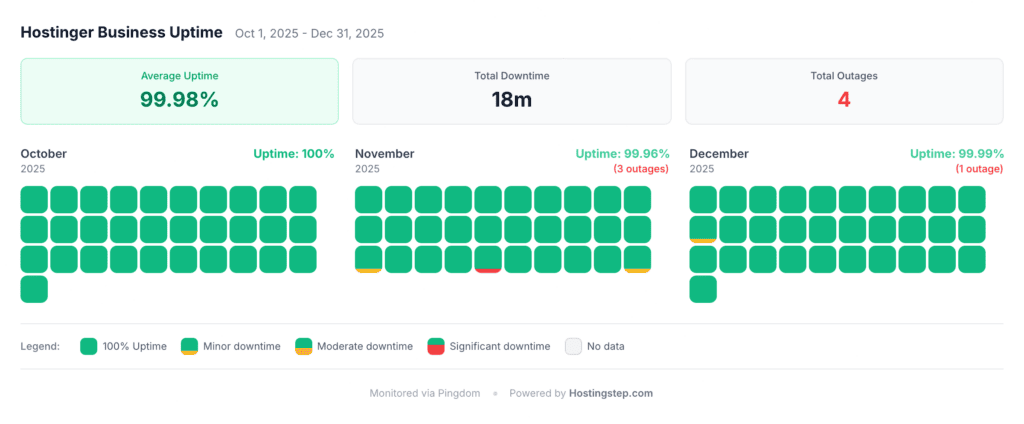
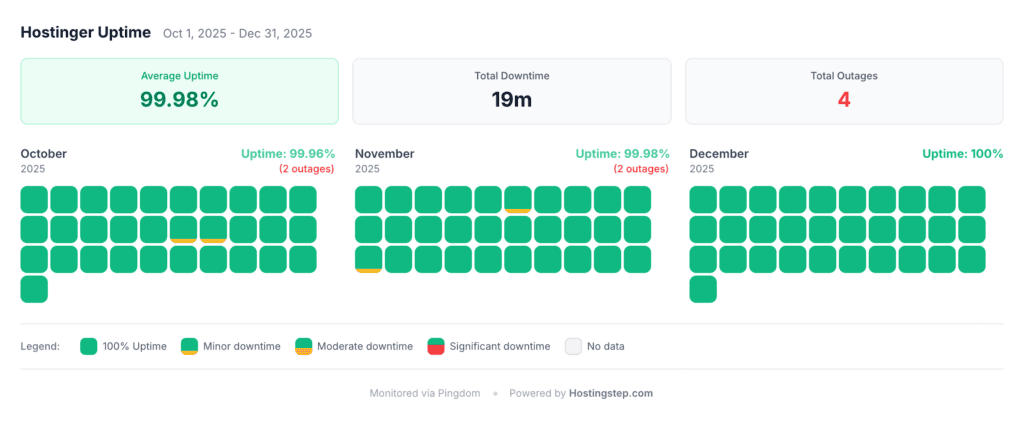
Our Pingdom monitoring setup runs every 60 seconds, 24/7 and 365 days a year. We have collected over five years of uptime performance data with 525,600 uptime checks annually. This is the level of monitoring depth that we show to determine the reliability of a hosting company and not by a random snapshot with unverifiable data on it.
Historical Uptime: Premium plan (2021-2025)
| Year | Uptime % | Total Downtime | Outages | Worst Day |
| 2021 | 99.79% | 1,011 min (~17 hrs) | 19 | 67.78% |
| 2022 | 99.70% | 1,546 min (~26 hrs) | 27 | 56.03% |
| 2023 | 99.77% | 1,228 min (~20 hrs) | 23 | 61.28% |
| 2024 | 99.99% | 75 min | 21 | 98.26% |
| 2025 | 99.99% | 33 min | 11 | 99.51% |
This is one of the best historical data sets you can find on Hostinger’s uptime. From 2021 to 2023, Hostinger Premium experienced significant downtime with multiple outages. Similar to TTFB performance, the uptime was also unreliable in those time periods.
However, Hostinger dramatically improved its service in 2024. The total downtime dropped from 1,228 minutes in 2023 to just 75 minutes in 2024 and 33 minutes in 2025. The number of outages also decreased greatly from 23 to 11. Whatever the infrastructure changes made at Hostinger between 2023 and 2024 have worked pretty well.
Business Plan Uptime History
| Period | Uptime % | Total Downtime | Outages |
| 2025 (135 days) | 99.99% | 18 min | 4 |
We have started monitoring the business plan from August 2025. Out of 135 days in 2025, Hostinger Business recorded an uptime of 99.99% with just 4 outages totaling 18 minutes. Across the full October to May window it recorded 99.98% uptime with 6 outages. Compared to the premium, the business plan comes with better server resources and a limited number of sites per server, so the uptime has been great from the beginning.
Load Handling
Load handling is where the premium and business plan diverge dramatically. We have sent 0 to 100 concurrent users to the test sites over 60 seconds using the Loader.io tool. The results: Business plan responds 8x faster than premium.
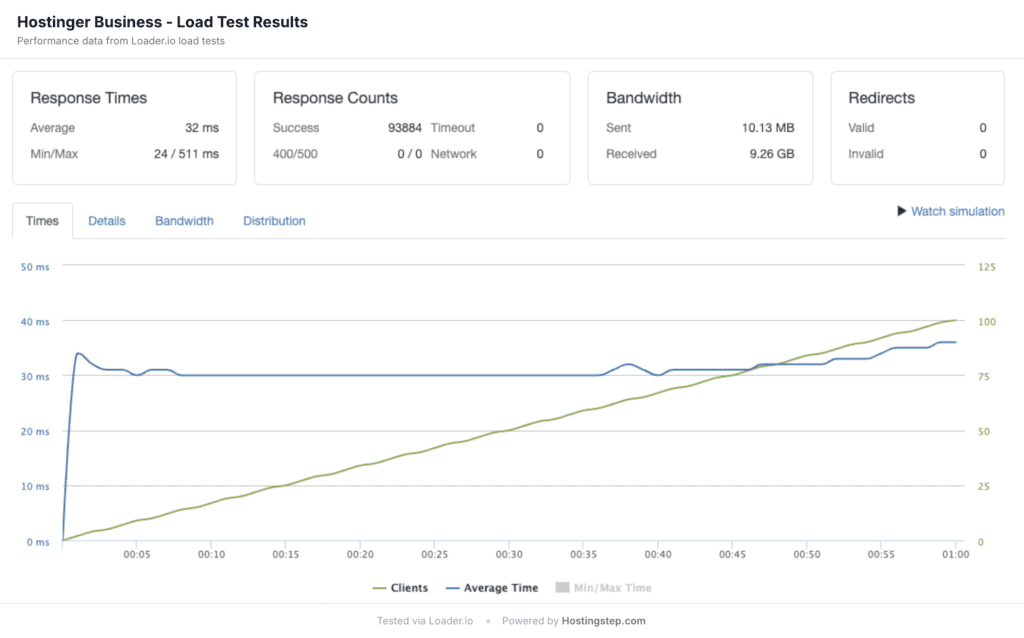
| Metric | Premium | Business |
| Avg Response Time | 245ms | 31ms |
| Error Rate | 0% | 0% |
| Test Config | 0–100 users / 60 sec | 0–100 users / 60 sec |
Hostinger Premium records a response time of 245 ms under load, while Business handles the same traffic spike at just 31 ms. The good thing, both the plans maintain a 0% error rate, means the servers never crash under pressure. So the data is clear for most of the users to understand. If you are having a site with high concurrent users, Business is the best choice. If you are starting a new site which doesn’t get such real time traffic, then Premium is the best to go.
To put this in comparison, only four hosts outperformed Hostinger Business: Pressable (12ms), WordPress.com (16ms), GreenGeeks (26ms) and WP Engine (27ms).
Global TTFB
Hostinger Premium records an overall Global TTFB of 404ms, while Business records 351ms, resulting in 13% faster performance globally. We have pinged the test sites from 40 global locations on April 17, 2026 to measure the cached Global TTFB performance. These results are highly useful for sites that have global visitors.
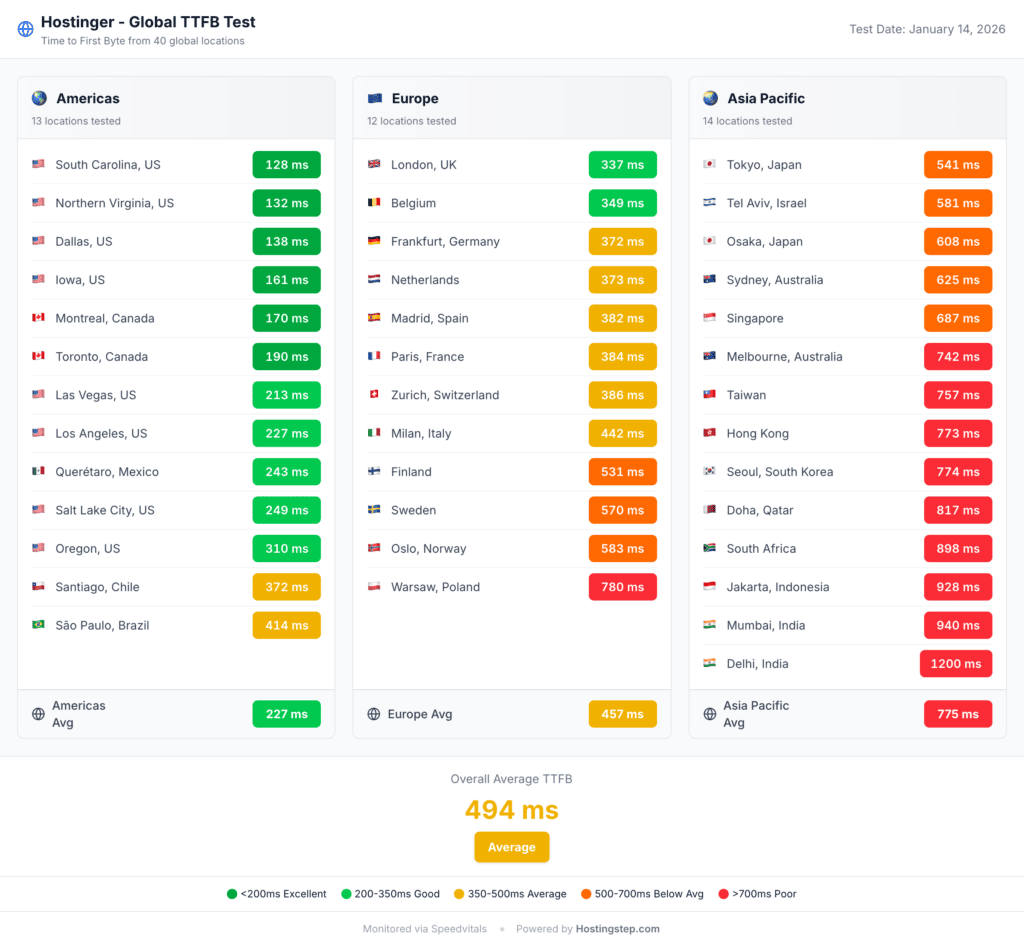
| Region | Premium Avg | Business Avg | Difference |
| Americas (13 locations) | 172ms | 251ms | Premium 31% faster |
| Europe (11 locations) | 365ms | 304ms | Business 17% faster |
| Asia-Pacific (15 locations) | 633ms | 471ms | Business 26% faster |
| Overall Average | 404ms | 351ms | Business 13% faster |
The regional split is where this gets interesting, because the Business plan is actually slower across the Americas. Premium’s Americas results cluster tightly between 76ms in Northern Virginia and 396ms in São Paulo, with nothing above 400ms. Business posts excellent numbers at some edges — 31ms in São Paulo, 93ms in South Carolina — but three locations dragged its average up: Los Angeles at 677ms, Querétaro at 935ms and Santiago at 366ms, against Premium’s 182ms, 159ms and 350ms at the same locations. That pattern points to cold or missing edge nodes rather than a server problem, because the origin sits in North America and Premium reaches it directly. The practical takeaway is simple: if your audience is entirely within the US, the CDN is not the reason to upgrade to Business. Load handling is.
So where does the difference occur? The premium plan does not offer CDN, while the Business plan comes with its own integrated Hostinger CDN. The CDN, through its edge location over the globe, places your site files. When someone visits the site, they will be delivered from the nearest edge location. However, in the case of the Premium plan, if your site is hosted on a US data center and if someone from Singapore is visiting your site, the data will travel from the US to Singapore. So, this is the difference here, and it is why Business pulls ahead in Europe and Asia Pacific.
If you are a small business in the US and hosting your site in a US data center, then this Global TTFB does not matter. However, if you are running a global business with global visitors, then keep an eye on this score.
Server Hardware Test
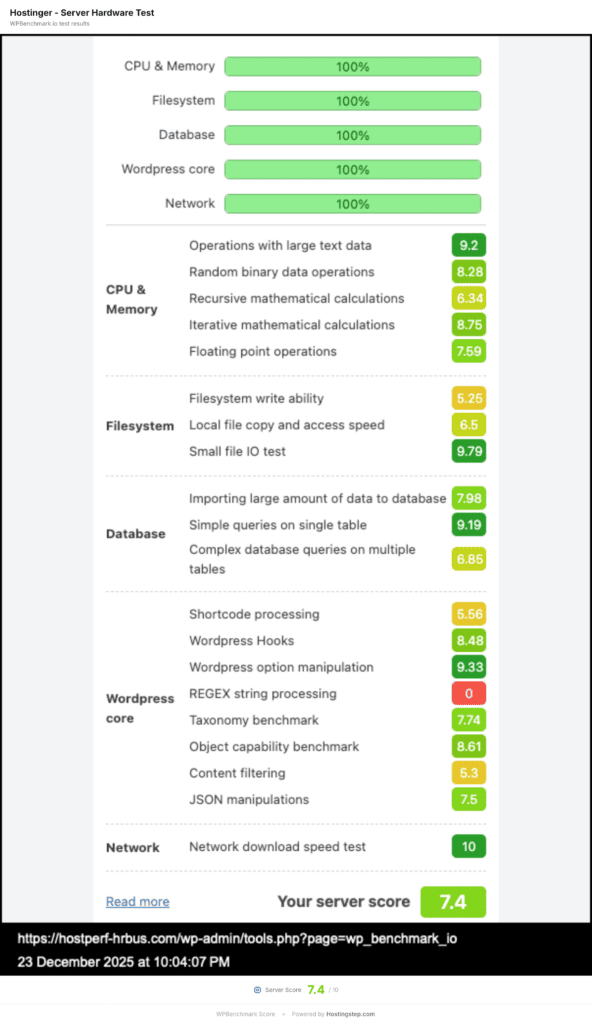
Both Hostinger Premium and Business score 7.4 out of 10 in our WPBenchmark server hardware test. The 7.4 score is above the 6.6 median of the 34 hosts we monitor, indicating the allocated CPU, RAM and disk I/O are strong enough for plugin-heavy WordPress sites and small WooCommerce stores. In simple terms, the performance difference between the Premium and Business plan comes from the software level optimization like CDN rather than the hardware specification.
Hostinger Vs Competitors
| Metric | Hostinger Premium | Hostinger Business | Bluehost | HostGator | SiteGround | Cloudways Std |
| TTFB | 447ms | 438ms | 501ms | 496ms | 745ms | 442ms |
| Uptime | 99.98% | 99.98% | 99.97% | 99.97% | 99.96% | 99.99% |
| Load Test | 245ms/0% | 31ms/0% | 41ms/0% | 213ms/2.0% | 170ms/0% | 282ms/2% |
| Global TTFB | 404ms | 351ms | 224ms | 427ms | 1,200ms | 386ms |
| WPBench | 7.4 | 7.4 | 9.6 | 9.6 | 8.4 | 4.7 |
| CDN | None | Static | Static | Static | Addon | Addon |
| Backups | Weekly | Daily | Weekly | Daily | Daily | Daily |
| Intro Price | $2.99/mo | $3.69/mo | $1.99/mo | $3.75/mo | $3.99/mo | $11.00/mo |
| Renewal | $10.99/mo | $16.99/mo | $8.99/mo | $10.99/mo | $17.99/mo | $11.00/mo |
Hostinger Vs Bluehost:
Hostinger’s business outperformed Bluehost on TTFB (438ms vs 501ms) and uptime (99.98% vs 99.97%), and edges it on load handling (31ms vs 41ms). Bluehost wins on Global TTFB (224ms vs 351ms) and server hardware (9.6 vs 7.4). The Premium plan beats Bluehost on TTFB and uptime but loses on load handling, Global TTFB and hardware. However, when it comes to pricing, we don’t usually speak a lot about intro pricing, but we take renewal pricing as an important factor to discuss. So here, Bluehost renews at $8.99 per month, while Hostinger Premium renews at $10.99 per month. Hostinger Business is even pricier at $16.99 per month. So the thing is clear: Hostinger Business delivers stronger load handling and uptime, and it costs much more than Hostinger Premium and Bluehost. So here is our choosing guide for you. Choose Hostinger Business if you have a well-established site already generating revenue and you need the best web hosting solution where pricing doesn’t matter. Choose Bluehost if you need a cheaper renewal price and also a decent performance across all the test metrics. Choose Hostinger Premium if you don’t have global traffic but need a better performance than Bluehost. Our full Hostinger vs Bluehost comparison breaks down every test result side by side.
Hostinger Vs HostGator:
Hostinger outperforms HostGator on TTFB, uptime, load handling and global TTFB, but HostGator holds a clear lead on server hardware at 9.6 against 7.4. Since the Business plan comes with CDN, it outperforms HostGator in global TTFB performance (351ms vs 427ms). On renewal, HostGator is the cheaper option at $10.99 per month against $16.99 for Hostinger Business. In load testing, HostGator recorded 213ms with a 2.0% error rate, while both the Hostinger plans handled the load completely with a 0% error rate. So, Hostinger wins on performance while HostGator is cheaper at renewal.
Hostinger Vs SiteGround:
Hostinger Business outperforms SiteGround on TTFB (438ms vs 745ms), load handling (31ms vs 170ms) and Global TTFB (351ms vs 1,200ms), though SiteGround scores higher on server hardware at 8.4 against 7.4. Hostinger Business is also cheaper at $3.69 per month when compared to $3.99 per month intro pricing of SiteGround. The renewals are also cheaper at Hostinger, with $16.99 versus $17.99 on SiteGround. Remember, the renewal price is for SiteGround’s startup plan, while the renewal price of Hostinger is its Business plan. SiteGround also includes daily backups and a free CDN on all plans. However, the free CDN is limited with a limited number of bandwidth and they have upselling on CDN where you will get the utmost performance. But the CDN itself costs $14.99 per month with a limited bandwidth per site. So overall, if you need to use it, you need to pay for each and every site. However, with Hostinger, you get its free CDN across all the total number of sites you are hosting with your hosting plan. So on performance and price, there is little reason to choose SiteGround over Hostinger.
Hostinger vs Cloudways:
Here we are comparing the Hostinger and Cloudways standard plan, which costs $11 per month. Hostinger Business is marginally faster at TTFB, 438ms versus 442ms, though Cloudways records better uptime at 99.99%. However, Hostinger Business wins on load handling, 31ms versus 282ms and also CDN comes as an add-on with Cloudways. So we didn’t test them with CDN and the Global TTFB is 386ms with them. However, Hostinger Business recorded a Global TTFB of 351ms. So if you are having a site with global traffic, Hostinger wins. If you consider the renewal pricing, Hostinger Premium and Cloudways Standard cost very similarly, around $11 per month. My recommendation is that if you need to host a lot of sites, smaller sites, then Cloudways can be a better option. However, if you are a small business and need a beginner-friendly control panel with all the features offered with no upselling, then Hostinger is the best.
Pricing
Hostinger offers 3 different WordPress hosting plans. The introductory pricing starts at $2.99 per month for Premium and $3.69 per month for Business. Use our exclusive Hostinger Coupon Code to get an 10% extra off on top of existing discounts, applicable for all hosting plans.
| Premium | Business | |
| Intro Price | $2.99/mo | $3.69/mo |
| 48-Month Total | $143.52 | $177.12 |
| Regular Price | $12.99/mo | $18.99/mo |
| Renewal Price | $10.99/mo | $16.99/mo |
| Discount | 77% off | 81% off |
| Storage | 20 GB SSD | 50 GB NVMe |
| Websites | 3 | 50 |
| Backups | Weekly | Daily + on-demand |
| CDN | No | Yes (static) |
| RAM | Shared | Shared |
| 30-Day Refund | Yes | Yes |
We are currently collecting performance data on Hostinger’s Cloud Startup plan and will add it to this comparison once we have a full testing window.
Hostinger follows the industry standard practice of offering steeply discounted introductory pricing with a long-term commitment and the renewal rates will be significantly higher. Hostinger offers the best long-term discount on 48 months billing and the plan renews at the price which is mentioned above. If you are signing up with the 24 or 36-month plan, then the renewal rate will be slightly different. Bluehost renews cheaper at $8.99 per month and HostGator at $10.99 per month, so Hostinger Premium’s $10.99 renewal sits in the same range as its closest shared hosting rivals.
Who Should Use Hostinger
Premium Plan:
Hostinger Premium is recommended for beginners who are just getting started with their blog or portfolio site. Their performance is strong for these kinds of sites, which have low traffic. Their pricing, $2.99 per month, which is $143.52 for four years, is among the cheapest entry points we track.
Hostinger offers 13 data center locations. Since the Premium Plan does not offer CDN, we don’t recommend it for sites with a global audience. However, their TTFB response time is better. So if you have an audience which is primarily in a local or regional, Premium performs well across whichever data center you select. For example, if you are running a small business in London, you can choose the London data center and you can get the fastest response time.
Business plan:
Hostinger Business is recommended for growing sites which are expecting at least 10,000 to 50,000 monthly visitors. The 31ms load test response handling shows it can handle all the traffic without any issues.
Hostinger’s CDN improves global TTFB in Europe and Asia Pacific. So if you have customers in those regions, then you can choose a US data center and enable the CDN. If your audience sits entirely within the Americas, our test data shows the CDN did not help, so upgrade for the load handling instead.
Hostinger offers higher server resources than most of the shared hosting companies. Hence, we recommend them for small WooCommerce stores that require decent load handling and daily backups to handle the cart.
Who Shouldn’t Use Hostinger?
Hostinger offers its CDN, but it mostly caches only the static files. In simple terms, we can say they only host the CSS, JavaScript and image files on their edge locations. However, there are hosts that offer complete edge caching, meaning all your site files, including the HTML, will be hosted in the edge location. For example, Hostinger Business records a TTFB of 438ms, while Pressable records 320ms and WP Engine records 355ms. However, both the Pressable and WP Engine price starts around $25 per month. So if you are expecting high speed, you should be ready to pay for these plans.
If you are looking for near-perfect uptime on your sites, then Hostinger is not for you. Hostinger records an average uptime of 99.98%. However, Pressable and WP Engine both recorded 100% uptime with zero outages over the same window. So if you have a critical business where uptime matters, then Hostinger is not for you.
Our Verdict
Hostinger Business is the stronger of the two plans on our test data. It earns that on load handling (31ms with a 0% error rate), a global TTFB of 351ms and a reliable 99.98% uptime with only 6 outages across 243 days.
The premium plan is a different product. It has a solid TTFB and uptime, but lacks a CDN and offers average load handling at 245ms.
Our recommendations: If you are starting a new blog or a local business site where your target audience is located around a particular region, then the premium plan best suits you at $2.99/month. If you are building a site that is expected to grow internationally or need to handle traffic spikes, then the Business plan at $3.69 per month is worth the upgrade. The $0.70 per month difference buys 8x better load handling.
If Hostinger is not the right fit for any of your needs, then check out Bluehost. It records the strongest server hardware score in this comparison at 9.6, a global TTFB of 224ms and handles 100 concurrent users at 41ms with no errors. It also renews cheaper at $8.99 per month, though its TTFB (501ms) and uptime (99.97%) both trail Hostinger.