GreenGeeks scored 7.96 out of 10 in our performance testing. The host recorded an uptime of 99.96% across our eight-month window from October 1, 2025 to May 31, 2026. We have been monitoring GreenGeeks for over five years since 2020, conducting more than 3.3 million tests on our GreenGeeks purchased account.
GreenGeeks recorded an exceptional load handling of 26 ms with zero errors, against a 58 ms median across every host that completed our load test. The host’s weaknesses include having no integrated CDN despite advertising it, a low WPBench score of 5.0 out of 10, and 25 separate outages across the window.
The host describes itself as an eco friendly web hosting company with 300% renewable energy match. We tested GreenGeeks Lite plan, available at a promotional price of $2.95 per month and a renewal price of $13.95 per month.
Note: This review is based on our testing of GreenGeeks’ Lite plan. The performance figures are measured data; the recommendations reflect our editorial assessment of those results. Unless stated otherwise, everything here applies to the Lite plan while other GreenGeeks plans may produce different benchmark results.
Performance Overview
| Metric | Result | Score |
| TTFB (US) | 411ms (spike ratio 1.79) | 8.00 |
| Uptime | 99.9572% (25 outages) | 7.49 |
| Load Test | 26ms / 0% errors | 10.00 |
| Global TTFB | 384ms | 7.00 |
| Server Hardware (WPBench) | 5.0/10 | 5.00 |
| Overall Performance | 7.96 |
GreenGeeks scored 7.96 out of 10 in overall performance. The host scored its strongest metric in the Load Test with a perfect 10 out of 10, while its weakest metric was Server Hardware with 5.0 out of 10.
The WPBench score reflects limited server resources on the backend while the front end performance is well optimized with a TTFB of 411 ms backed by caching.
TTFB Response Time
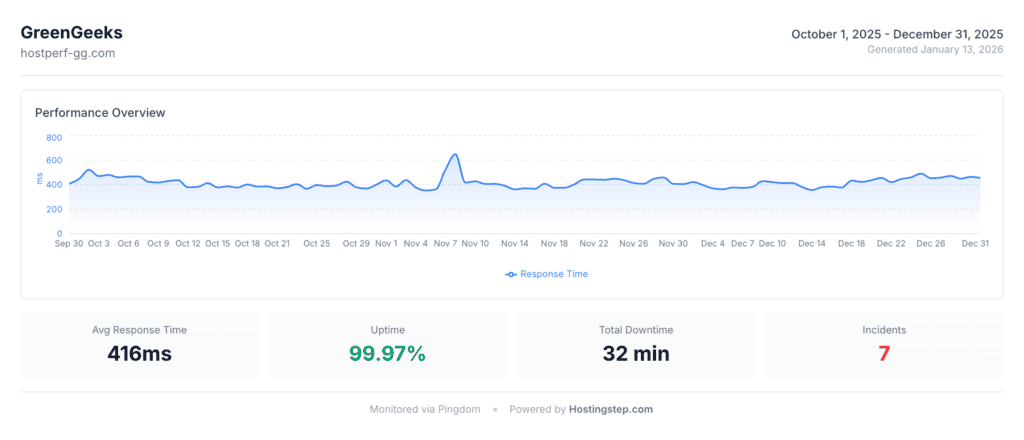
GreenGeeks scored 8 out of 10 with an average TTFB of 411 ms across the eight-month window, against a 465 ms median for every host we monitor. Its closest premium comparison is Pressable, which recorded 320 ms over the same window, putting GreenGeeks 91 ms behind it. Readings ranged from 316 ms to 735 ms — a spike ratio of 1.79, meaning its worst moments run less than twice its typical speed. GreenGeeks’ historical range of 298 ms in 2020 to 422 ms in 2025 reflects excellent stability and is a normal variance for shared hosting.
| Year | Avg TTFB | Min TTFB | Max TTFB | Uptime % | Outages | Downtime |
| 2020 | 298ms | 238ms | 396ms | 99.99% | 9 | 13 min |
| 2021 | 308ms | 258ms | 475ms | 99.99% | 15 | 76 min |
| 2022 | 317ms | 261ms | 661ms | 99.96% | 25 | 212 min |
| 2023 | 333ms | 257ms | 710ms | 99.97% | 14 | 163 min |
| 2024 | 394ms | 308ms | 745ms | 99.96% | 33 | 217 min |
| 2025 | 422ms | 340ms | 648ms | 99.97% | 21 | 138 min |
The performance has been consistent with no extreme spikes in the historical data, backed by multiple factors like server load, network changes, and PHP versions. We found the host exceptionally good for US based audiences with the Chicago data center selected. Furthermore, the host uses LiteSpeed web server with built in caching. We conduct 1,440 checks per day through Pingdom, monitoring it every 60 seconds, 24/7 — 349,920 checks across this window alone.
Uptime
GreenGeeks recorded an uptime of 99.9572% across the eight-month window and secured a score of 7.49 out of 10. That works out to 2 hours 30 minutes of total downtime, spread across 25 separate outages — a high count against the median of 9 across every host we monitor, and the main reason the uptime score sits at 7.49. By comparison, WordPress.com, Pressable, WP Engine, and Templ hosting each recorded zero outages over the same window. As per the historical data, GreenGeeks uptime range is 99.96% to 99.99% from the year 2020 to 2025. 2020 has been the best year for GreenGeeks with an uptime of 99.99% with a total downtime of 13 minutes.
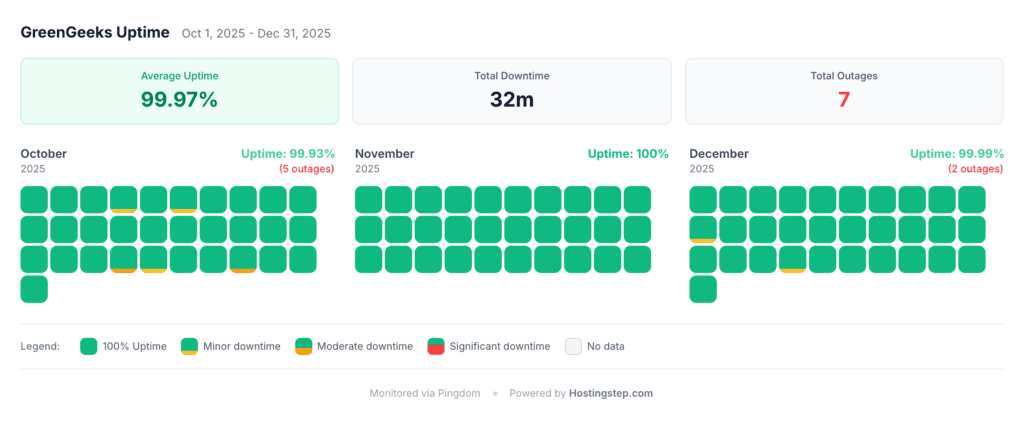
The host had the most number of outages in 2024 with 33 incidents with a total of 217 minutes downtime. GreenGeeks had 21 outages with a total of 138 minutes of downtime in 2025. As you can see in the historical data, GreenGeeks has been consistently able to exceed its advertised SLA of 99.9%.
As we compare GreenGeeks with its competitors, Hostinger Business recorded 99.99% across 6 outages, SiteGround recorded 99.97% across 29 outages, and Bluehost recorded 99.99% across 10 outages. Bluehost and Hostinger Business both stayed available longer than GreenGeeks and dropped far less often. SiteGround posted a marginally higher availability figure but with more outages than any of the three.
Load Handling
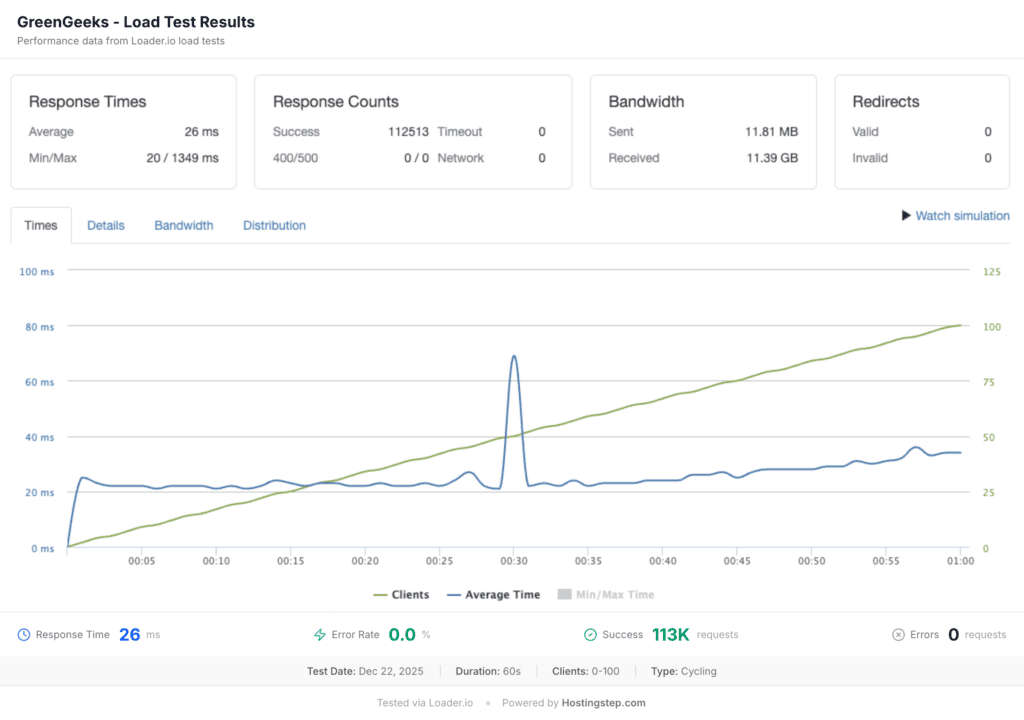
GreenGeeks scored 10 out of 10 in Load Test, recording an average response time of 26 ms with zero errors under a load of 100 concurrent users. That is well ahead of the 58 ms median across every host that completed our load test. Pressable recorded 12 ms over the same window, but its plan starts at $20.83 per month against GreenGeeks’ $2.95.
As we look into the competitors’ load handling, Hostinger Business recorded 31 ms with zero errors, Bluehost recorded 41 ms with zero errors, and SiteGround recorded 170 ms with zero errors. GreenGeeks is the fastest of the four under load, and SiteGround is 6.5x slower than GreenGeeks in terms of load handling. A good load handling is needed in traffic spikes, viral content, sales events and WooCommerce stores to help sites stay up and running.
We conducted our load test using Loader.io, sending 0 to 100 concurrent users in 60 seconds. GreenGeeks’ load handling gives it an extra edge over other hosts. GreenGeeks’ load handling performance matches that of managed hosts that cost over $20 per month, while GreenGeeks costs only $2.95 per month.
Server Hardware
GreenGeeks scored a WPBench score of 5 out of 10, which is below average. WPBench measures non-cached server resources including CPU, RAM and disk I/O. The WPBench score is independent of web server software and there is no correlation between the two. For example, LiteSpeed, Apache or Nginx will have no impact on the score since WPBench tests raw compute.
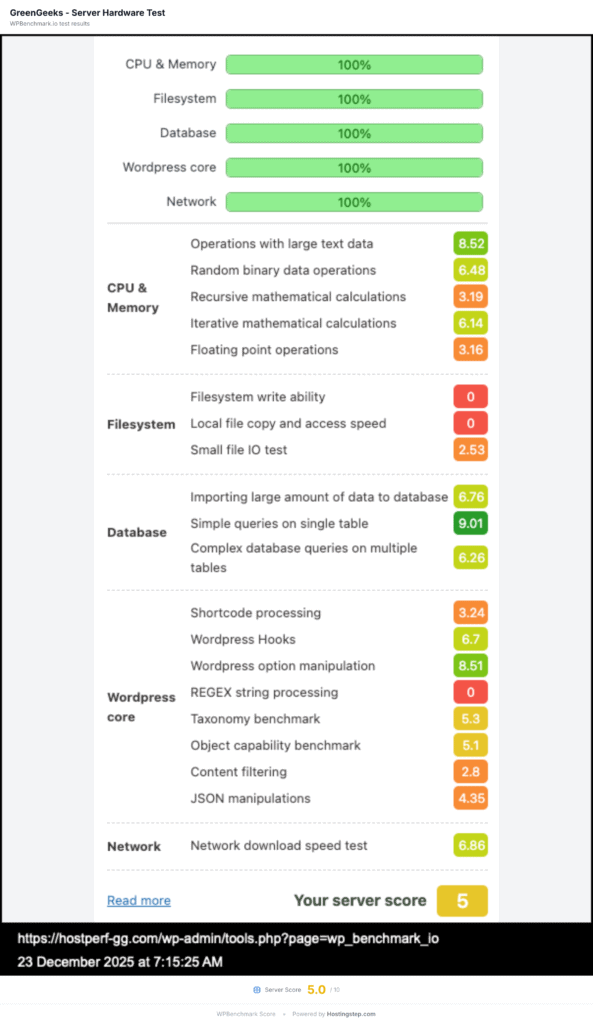
A low score means the host has limited allocated resources for the plan. We tested the Lite plan with specs as 2 CPU cores, 1 GB RAM, and 10 MB/sec disk I/O. GreenGeeks’ 5.0 sits below the 6.6 median across every host we benchmark. Among its direct competitors, Hostinger Business scored 7.4, SiteGround scored 8.4, and Bluehost scored 9.6.
GreenGeeks’s WPBench of 5 means sites with heavy plugins, complex DB queries, or WooCommerce stores may hit resource limits and get sluggish. Such heavy sites can switch to the Pro plan which comes with 2 GB RAM and 3 cores or the Premium plan, which comes with 3 GB RAM, 4 Cores and Redis.
Global TTFB
GreenGeeks recorded a global average TTFB of 384 ms with a score of 7 out of 10, tested from 40 locations on April 17, 2026. Across the Americas the host averaged 156 ms, with 50 ms for Toronto and 58 ms for Northern Virginia, which is excellent. Europe averaged 328 ms, with 280 ms for London and 333 ms for Frankfurt, which is good. Asia Pacific remains the weak region at 626 ms, where GreenGeeks recorded its worst reading of 1,100 ms for Dubai, followed by Delhi at 828 ms and Mumbai at 799 ms.
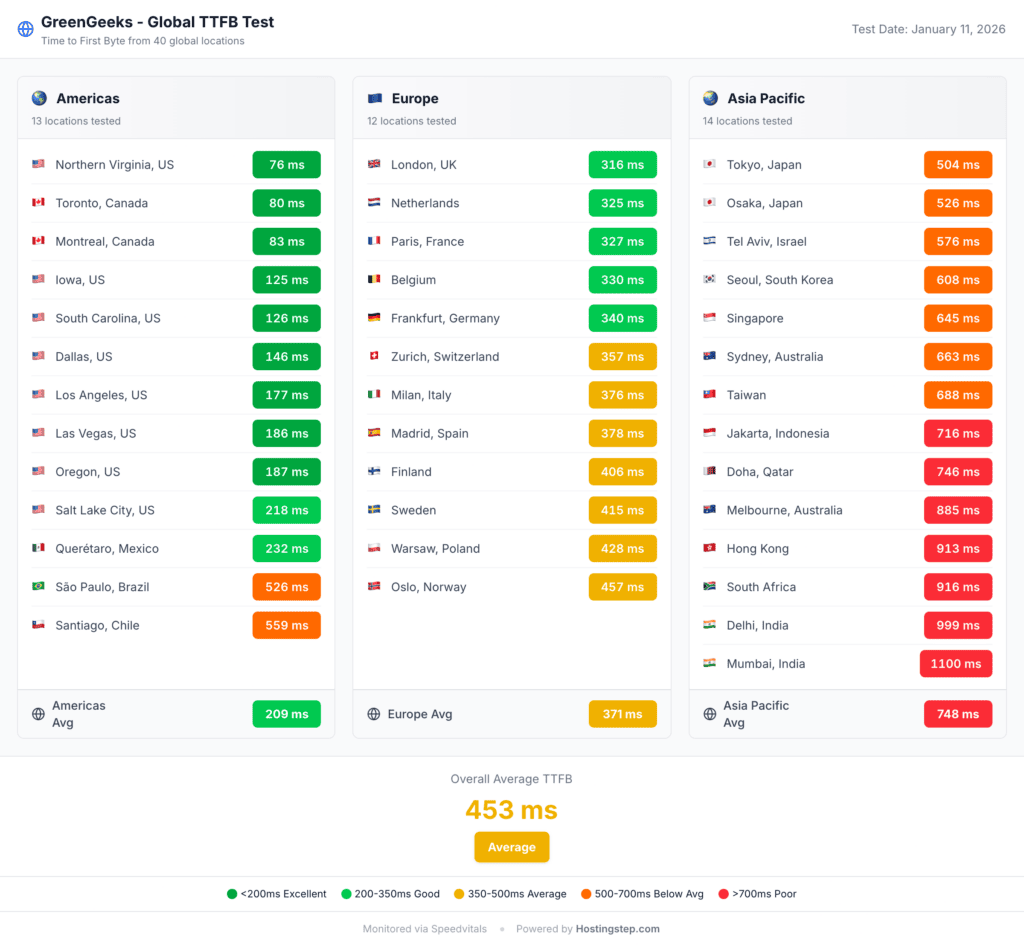
| Region | Avg TTFB | Best City | Worst City |
| Americas | 156ms | Toronto: 50ms | São Paulo: 430ms |
| Europe | 328ms | London: 280ms | Warsaw: 389ms |
| Asia-Pacific | 626ms | Tokyo: 423ms | Dubai: 1,100ms |
The lack of integrated CDN even though the host advertises “Free CDN” is the main reason behind the weaker global performance. Users have to manually sign up for free Cloudflare and configure everything. Hence, the GreenGeeks “Free CDN” claim is misleading. As we compare GreenGeeks’ global TTFB with that of its competitors, Hostinger Business recorded 351 ms with its static CDN and Bluehost recorded 224 ms with Cloudflare CDN. SiteGround recorded 1,200 ms despite offering a CDN addon.
GreenGeeks offers excellent TTFB across US and Canada, which is why it should work fine without a CDN for sites with US and Canada audiences. GreenGeeks’ 328 ms for Europe should work fine for sites with European audiences as long as those sites use Cloudflare CDN. For sites with audiences in Asia Pacific, there is no other way than using a third party CDN in order to use GreenGeeks. Unlike other review sites, we test in 40 cities across America, Europe and Asia-Pacific.
GreenGeeks vs Competitors
| Metric | GreenGeeks | Hostinger Business | SiteGround | Bluehost |
| TTFB | 411ms | 438ms | 745ms | 498ms |
| Uptime | 99.96% (25 outages) | 99.99% (6) | 99.97% (29) | 99.99% (10) |
| Load Test | 26ms / 0% | 31ms / 0% | 170ms / 0% | 41ms / 0% |
| Global TTFB | 384ms | 351ms | 1,200ms | 224ms |
| WPBench | 5.0 | 7.4 | 8.4 | 9.6 |
| CDN Type | None | Static | Addon | Cloudflare |
| Included | Addon | Included | Addon | |
| Backups | Daily | Daily | Daily | Weekly |
| Intro Price | $2.95/mo | $3.69/mo | $3.99/mo | $1.99/mo |
| Renewal Price | $13.95/mo | $16.99/mo | $17.99/mo | $8.99/mo |
| Performance Score | 7.96 | 8.35 | 5.59 | 8.45 |
GreenGeeks vs Hostinger Business: GreenGeeks wins on TTFB & Load Handling
GreenGeeks wins on TTFB for US and Canada with 411 ms vs 438 ms and also wins on load test with 26 ms vs 31 ms. However, Hostinger Business wins on uptime with 99.99% across 6 outages vs 99.96% across 25, and on WPBench with 7.4 vs 5.0. Its global TTFB edge is now narrow at 351 ms vs 384 ms, but Hostinger Business gets there with a static CDN while GreenGeeks doesn’t really offer any CDN.
GreenGeeks renews cheaper at $13.95 vs $16.99. GreenGeeks is an ideal host for US focused sites that need powerful load handling and free email hosting. Hostinger stands out as a good option for sites that need steadier uptime and stronger server hardware.
GreenGeeks vs SiteGround: GreenGeeks wins on speed, load handling and global reach
GreenGeeks beats SiteGround on TTFB, load handling and global TTFB, and renews cheaper. SiteGround holds a marginal uptime edge at 99.97% vs 99.96%, though across more outages (29 vs 25), and scores higher on WPBench. GreenGeeks wins on TTFB with 411 ms vs 745 ms, which makes it 45% faster than SiteGround. GreenGeeks also beats SiteGround in terms of load handling with 26 ms vs 170 ms, which is like 6.5x faster than SiteGround.
GreenGeeks is 68% faster than SiteGround in global TTFB with 384 ms vs 1,200 ms. SiteGround scored better in WPBench with 8.4 vs 5.0, meaning it has higher allocated resources than GreenGeeks. GreenGeeks’ renewal is lower than SiteGround with $13.95 vs $17.99.
GreenGeeks vs Bluehost: GreenGeeks beats Bluehost on TTFB and Load Handling
GreenGeeks offers better TTFB than Bluehost with 411 ms vs 498 ms. The host also has better load handling with 26 ms vs 41 ms, both at zero errors. Bluehost wins everywhere else: 99.99% uptime across 10 outages vs 99.96% across 25, a 224 ms global TTFB against GreenGeeks’ 384 ms via Cloudflare CDN, and a 9.6 WPBench score vs 5.0.
GreenGeeks includes email hosting at no extra charge, where Bluehost charges for it after the first month. Bluehost is also cheaper on both ends at $1.99 intro and $8.99 renewal against GreenGeeks’ $2.95 and $13.95. GreenGeeks is ideal for US focused sites that need the fastest load handling and free email hosting. Bluehost is ideal for resource heavy sites that have global audiences and need steadier uptime.
Who Should Use GreenGeeks
Sites with US or Canada based target audience can go with GreenGeeks since the host offers a TTFB of 156 ms across the Americas. Besides, sites with a US based audience that expect traffic spikes can choose GreenGeeks as the host offers an excellent load handling of 26 ms with 0 errors with a perfect 10 out of 10 score. Budget conscious users can choose GreenGeeks as it comes with email hosting included for no extra charge.
First time users may also choose GreenGeeks as it gives you the convenience of managing your hosting account through a simplified cPanel dashboard. Besides, it comes with a preconfigured LiteSpeed Cache. Sites with European audiences can also choose GreenGeeks as the host recorded an average global TTFB of 328 ms across Europe — and that figure was measured against our test site on the Chicago data center, so it reflects cross-Atlantic latency rather than a European server. You can choose GreenGeeks if you are environmentally conscious, as the host has matched its energy use with 300% renewable energy credits since 2009.
Who Should NOT Use GreenGeeks
Sites with target audiences in Asia Pacific should avoid GreenGeeks since the host has poor global TTFB across the regions with a TTFB of 828 ms in Delhi and 1,100 ms in Dubai. Besides, the host doesn’t come with an integrated CDN to fix this issue. GreenGeeks’ “Free CDN” claim is misleading. Resource heavy sites should stay away from GreenGeeks as it recorded a WPBench score of 5 out of 10 which is below average. Hence, heavy sites will experience resource limitation and may get sluggish.
Sites under a tight budget need to think twice before choosing GreenGeeks as the renewal is as high as $13.95 per month, which is 373% higher than the promotional price. Sites that cannot tolerate frequent interruptions should also look elsewhere, as GreenGeeks recorded 25 separate outages across our eight-month window against a median of 9.Sites looking for good global reach can go with Bluehost or Hostinger Business with global TTFB as 224 ms and 351 ms respectively. Sites that need better server hardware and resources can choose Bluehost or SiteGround with WPBench score as 9.6 and 8.4 respectively.
Our Verdict
GreenGeeks secured an overall performance score of 7.96 out of 10. We strongly recommend GreenGeeks for sites that have their target audience in the US or Canada and need reliable load handling. The host is also ideal for budget conscious users who want affordable hosting with email included for no extra charge.
However, we won’t recommend choosing GreenGeeks for sites that have a global audience since GreenGeeks doesn’t offer any CDN. Besides, the host is not even ideal for resource intensive sites and apps since it scored 5 in WPBench. Such sites can choose Hostinger Business, which scored 8.35 in performance, though it renews higher at $16.99 vs $13.95.
GreenGeeks starts as low as $2.95 per month and renews at $13.95 per month, which is like a 373% increase. While GreenGeeks’ biggest strength lies in its load handling at a $2.95 price point, the host has no integrated CDN, weak global performance outside the Americas, and 25 outages across our window. Our verdict is based on 349,920 tests conducted between October 1, 2025 and May 31, 2026 using Pingdom, Loader.io, WPBenchmark and SpeedVitals.
Methodology
We purchased all hosting accounts with our own funds and they are not promotional or free press accounts. During the testing, we used Pingdom for testing the TTFB and uptime, Loader.io for Load Testing, WPBenchmark for testing the server hardware, and SpeedVitals for testing global TTFB. We conduct 1,440 tests per provider per day with constant monitoring every 60 seconds, 24/7 — 525,600 tests per year. We conduct our test in 40 cities across America, Europe and Asia-Pacific.
Our data period is October 1, 2025 to May 31, 2026 — 243 days of continuous monitoring and 349,920 tests. Our GreenGeeks historical data is available from 2020 onwards. We use the same standardized test environment across every provider: WordPress 7.0, the Twenty Twenty-Five theme, PHP 8.4, and identical plugins (Akismet, Rank Math SEO and Contact Form 7). For writing this review, we tested GreenGeeks’ Lite plan using the Chicago data center.