Kinsta scored 8.30 out of 10 for performance in our 2026 WordPress Hosting rankings. We have been testing the host since 2020, with over 1,960 days of constant monitoring and over 2.82 million individual performance tests conducted. Our monitoring hostname is hostperf-ks.com and our Pingdom check ID is 6622691. The host recorded a TTFB of 525 ms and an Uptime of 99.98% across our 8-month monitoring window (October 1, 2025 – May 31, 2026).
However, Kinsta at $30 per month is one of the most expensive hosts in our testing and it’s important to find out if the premium is justified. Our data indicates the premium price outpaces the performance, with hosts like WP Engine at $23 per month and Pressable at $20.83 per month costing less while delivering faster speeds. Hostinger Business is actually 87 ms faster on TTFB at 438 ms for $3.69 per month, which is roughly one-eighth the price of Kinsta.
Kinsta’s strengths lie in its excellent load handling of 40 ms, WPBench hardware score of 8.8 and its edge CDN. Besides, the host comes with flat pricing with no shocking renewals. The host’s weaknesses include no email hosting, poor Asia Pacific global performance with an average of 700 ms, below-median US TTFB for such a high price point and 2025 uptime dip with 149 minutes downtime.
Note: This review is based on our testing of Kinsta’s Starter plan. The performance figures are measured data; the recommendations reflect our editorial assessment of those results. Unless stated otherwise, everything here applies to the Starter plan while other Kinsta plans may produce different benchmark results.
Performance Overview
| Metric | Result | Score (/10) | Rating |
| TTFB (US) | 525ms | 6 | Average |
| Uptime | 99.98% | 9 | Good |
| Load Test | 40ms / 0.00% error | 9 | Excellent |
| Global TTFB | 477ms | 7 | Good |
| Server Hardware (WPBench) | 8.8 | 8.8 | Excellent |
| Performance Total | 8.30/10 | — | — |
Kinsta achieved a performance score of 8.30 out of 10. It is a strong result driven by load handling and server hardware, though front-end delivery speed holds it back, as the sections below show.
Kinsta recorded an excellent WPBench score of 8.8, which means it allocates strong CPU, RAM, and I/O on Oracle Cloud. Only Bluehost and HostGator scored higher with the same score of 9.6. Kinsta also delivers an excellent load handling with 40 ms and 0% error, scoring 9 out of 10. Only 4 hosts scored 10 out of 10 in the load test.
However, a TTFB of 525 ms with a score of 6 out of 10 is a disappointment considering the $30 per month cost. Even budget hosts like Hostinger Business that cost $3.69 per month recorded a faster TTFB of 438 ms — 87 ms quicker than Kinsta. There is clearly a gap between hardware capability with a WPBench of 8.8 and front end TTFB of 525 ms, and this suggests that the host needs to optimize its delivery stack.
With this performance profile, your site will perform reliably in most conditions but you are not getting the fastest delivery speeds for the price you are paying.
TTFB Response Time
| Year | Avg TTFB | Uptime | Days Mon. | Tests | Outages | Downtime (min) |
| 2020 | 361ms | 99.94% | 116 | 167,040 | 8 | 106 |
| 2021 | 399ms | 99.99% | 365 | 525,600 | 11 | 38 |
| 2022 | 500ms | 99.99% | 365 | 525,600 | 8 | 35 |
| 2023 | 379ms | 99.995% | 365 | 525,600 | 1 | 25 |
| 2024 | 466ms | 99.999% | 366 | 527,040 | 1 | 3 |
| 2025 | 459ms | 99.97% | 365 | 525,600 | 5 | 149 |
Kinsta recorded an average TTFB of 525 ms across our 8-month window, scoring 6 out of 10 as it sits in the range of 500 ms to 550 ms on our scale. TTFB stands for Time to First Byte and it means the time a server takes to begin responding right after receiving a request. TTFB is a foundational speed metric since it affects everything on your web page. TTFB directly impacts LCP (Largest Contentful Paint), which is a Google ranking factor.
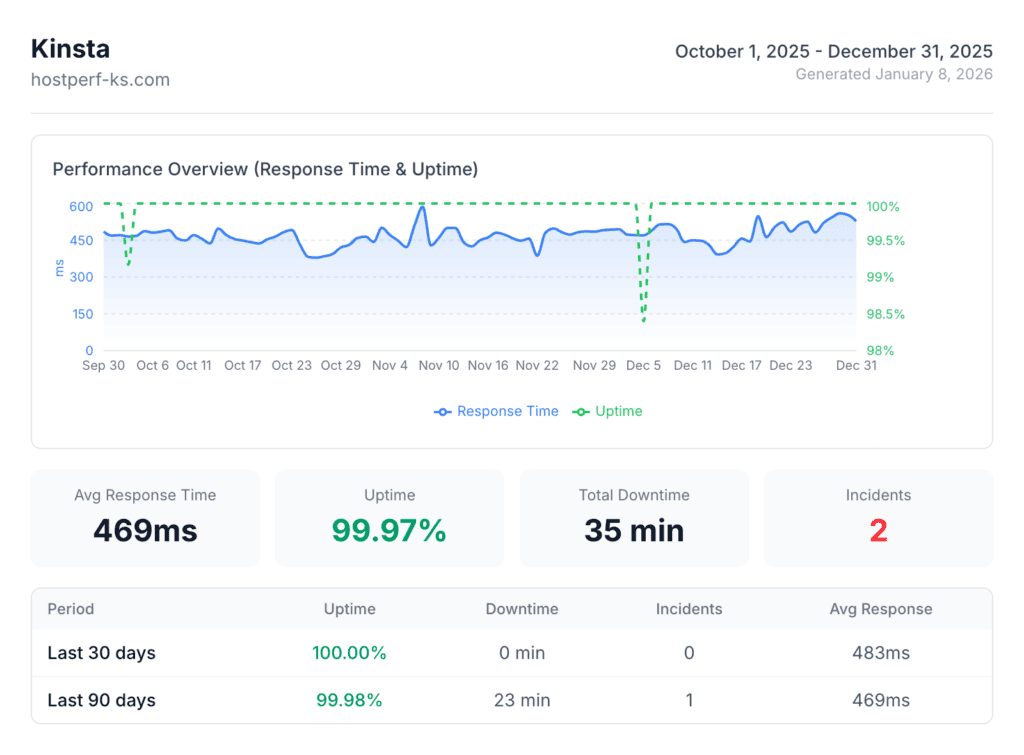
Our TTFB Scoring Scale works like this: Hosts with TTFB below 350 score 10 , hosts with TTFB from 350 to 400 score 9, hosts with TTFB from 400 to 450 score 8, hosts with TTFB from 450 to 500 score 7, hosts with TTFB from 500 to 550 score 6 (Kinsta), hosts with TTFB from 550 to 600 score 5, hosts with TTFB from 600 to 700 score 4, and hosts with TTFB below 700 score 3.
Kinsta is 26 ms away from scoring 7 out of 10, which would need it to have an average TTFB below 500 ms. So, Kinsta narrowly missed the next band. Kinsta’s historical trend has remained pretty inconsistent. We started monitoring Kinsta’s historical TTFB trend in 2020 (partial) and the host recorded 361 ms over a monitoring of 116 days that year. 2021 has been a solid first full year for Kinsta with an average TTFB of 399 ms. However, the host has the worst TTFB in 2022 with an average of 500 ms, showing an year on year decline of 101 ms.
The host has a strong recovery in 2023 with 379 ms, which was 121 ms improvement from the TTFB it recorded in 2022. In 2024, the TTFB performance regressed again by 87 ms, recording an average TTFB of 466 ms. Kinsta recorded an average TTFB of 525 ms across our latest 8-month window. What we have learned from the historical data is that Kinsta’s TTFB fluctuates and while it’s capable of delivering sub 400 ms speeds, it hasn’t been able to maintain the consistency.
The best hosts in this field include Pressable with 320 ms, WordPress.com with 319 ms, and WP Engine with 355 ms. The field median is 465 ms, and Kinsta at 525 ms now sits 60 ms above (slower than) the median. SiteGround is the weakest performer in this field with an average TTFB of 745 ms, just behind GoDaddy at 734 ms. If we look at Kinsta’s position among its competitors, Pressable recorded 320 ms, Rocket.net recorded 346 ms, WP Engine recorded 355 ms, Cloudways Vultr HF recorded 428 ms, Hostinger Business recorded 438 ms, Bluehost recorded 501 ms, Kinsta recorded 525 ms, and SiteGround recorded 745 ms. Hence, Kinsta now sits near the bottom of its competitor set — only SiteGround is slower, and even the budget Hostinger Business plan is 87 ms quicker.
To understand the impact of Kinsta’s TTFB, at a TTFB of 525 ms, the server takes over half a second to begin responding. The server should take 2 to 3 seconds for the total page load in case of any WordPress blog with images and 3 to 4 seconds for a WooCommerce store with dynamic product pages. Google recommends TTFB under 800 ms, which Kinsta passes. However, a sub 200 ms TTFB is considered good by web.dev standards, and this is where Kinsta falls short. While an average TTFB of 525 ms is workable for most sites, this TTFB for $30 per month is not justified. Hosts with a cheaper price deliver comparatively better TTFB than Kinsta, like Pressable with 320 ms for $20.83 per month, or WP Engine with 355 ms for $23 per month.
Uptime
Kinsta recorded an uptime of 99.98% across our 8-month window, scoring 9 out of 10 on our reliability scale, which is good. Uptime measures the percentage of time your website is up and accessible by visitors. Even small differences matter a lot in uptime and Kinsta’s uptime of 99.98% means roughly 9 minutes of downtime per month while 100% uptime means zero downtime. For any ecommerce site doing $10k per month, 9 minutes of downtime during peak hours can cause a measurable impact on revenue.
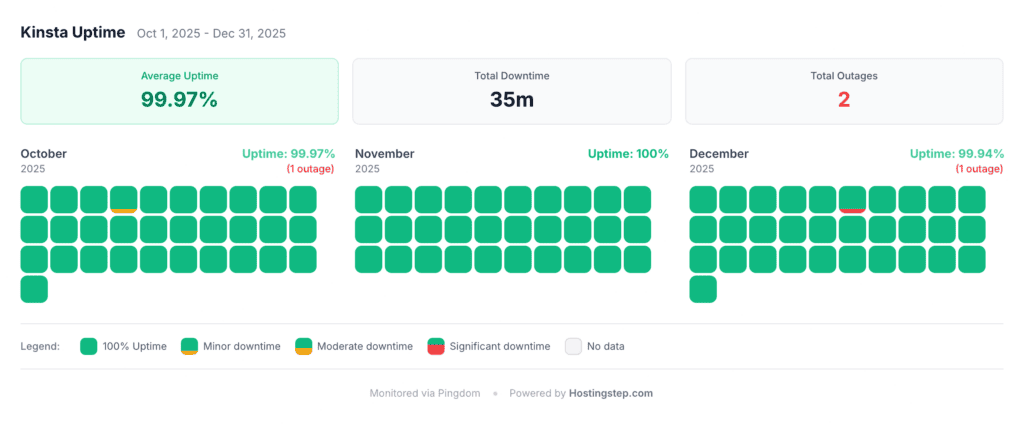
As we monitored the full year 2025 uptime of Kinsta, the host recorded an uptime of 99.97% uptime with 5 outages across 5 days with a total downtime of 149 minutes, which is like 50x increase in downtime compared to the uptime in 2024. In 2024, the host recorded an uptime of 99.999% with 1 outage amounting to just 3 minutes, which was near perfect, which was an improvement from the uptime in 2023 with 99.995% and 1 outage of 25 minutes.
The worst single day uptime in 2025 was 92.55%, roughly 107 minutes offline in one day. However, the 2025 downtime was partly caused by Cloudflare global outages since Cloudflare is an integral part of Kinsta’s stack. Cloudflare outages not just affected Kinsta but many other providers.
Even though there was nothing wrong with Kinsta’s servers, the problem was caused by a third party infrastructure. Kinsta has maintained a consistent uptime from 2020 until 2025. The host recorded 99.94% in 2020 with 8 outages and 106 minutes of total downtime even though we monitored the host’s uptime for the partial year.
The uptime improved in 2021 with 99.99%, 11 outages and 38 minutes of total downtime. 2023 proved to be the best year for Kinsta in terms of uptime as the host recorded 99.995% with 1 outage of 25 minutes. In 2024, Kinsta’s uptime was near perfect with 99.999%, and 1 outage of 3 minutes.
While the overall uptime trend from 2021 to 2024 was excellent with year on year improvements, the decline in uptime in 2025 was an anomaly linked to Cloudflare. Our 8-month window through May 2026 shows a recovery, with uptime back to 99.98% and no repeat of the 2025 Cloudflare-driven dip.
4 hosts achieved 100% uptime across our 8-month window, which comprises WordPress.com, Pressable, WP Engine, and Templ.io. Among competitors, WP Engine recorded 100% uptime, Pressable recorded 100%, Cloudways recorded 99.99%, Hostinger Business recorded 99.98%, SiteGround recorded 99.96%, and Rocket.net recorded 99.97%.
Load Handling
Kinsta recorded an average response time of 40 ms under a load of 100 concurrent users with 0.00% error rate and PASSED the load test with distinction. The host scored 9 out of 10, since it sits in the 30 ms to 50 ms bracket on our scale. In the load test, we simulate a load of 100 concurrent users on the server to understand how well it handles the load. The load test is conducted to check if the host is ideal for sites like a viral social media post, a flash sale or a Google News site that may experience traffic spikes. We also monitor the error rate while the host handles the traffic.
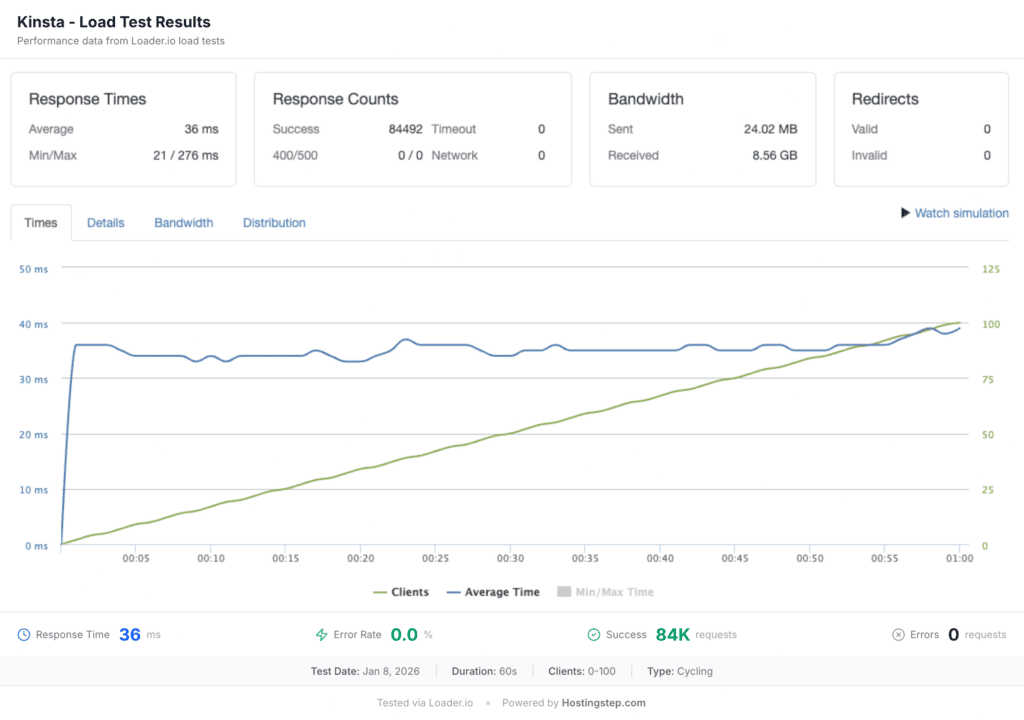
A load handling of 40 ms without any errors means your site will remain responsive even during a traffic spike with pages loading normally in 2 seconds and no noticeable difference for the users. Most importantly, visitors will not see any error pages since the host handled the load without any error. Kinsta’s excellent load handling is possible because of its Oracle Cloud infrastructure and isolated container architecture with no resources shared with other tenants.
The best hosts in this field with a 10 out of 10 score are Pressable with 12 ms, WordPress.com with 16 ms, GreenGeeks with 26 ms, and WP Engine with 27 ms. Hosts that failed the load test are Rocket.net with 100% errors and GoDaddy with 68.8% errors. NameHero hit a connection ceiling at around 80 concurrent users, with a 56% error rate on requests beyond that point.
Among the competitors, Pressable recorded 12 ms, WP Engine recorded 27 ms, Hostinger Business recorded 31 ms, Cloudways recorded 96 ms, SiteGround recorded 170 ms but Rocket.net FAILED with 100% errors. Kinsta sits just below the top tier with the 4th fastest load time in the competitor set. When compared to Bluehost, Kinsta with a response time of 40 ms and 0% errors is faster under load than Bluehost’s 131 ms (0.017% errors) from its 2026 retest.
Kinsta’s 40 ms/0% error load handling will prevent your site from crashing even when there is a Reddit front page link or X viral moment. Even a WooCommerce flash sale with over 100 simultaneous shoppers will have no cart page and check out errors with Kinsta’s strong load handling. For agencies, client sites will stay up and running during their marketing campaigns with Kinsta’s strong load handling.
Server Hardware
Kinsta secured a WPBench score of 8.8 out of 10, one of the highest in our testing. WPBenchmark measures the CPU, RAM allocation and disk I/O speed on the lowest tier plan. A higher score indicates your WordPress site has more computational resources for its database queries, plugin operations and page generation. Bluehost and HostGator lead this metric with a score of 9.6, and Kinsta is close behind, tied with ScalaHosting with 8.8.
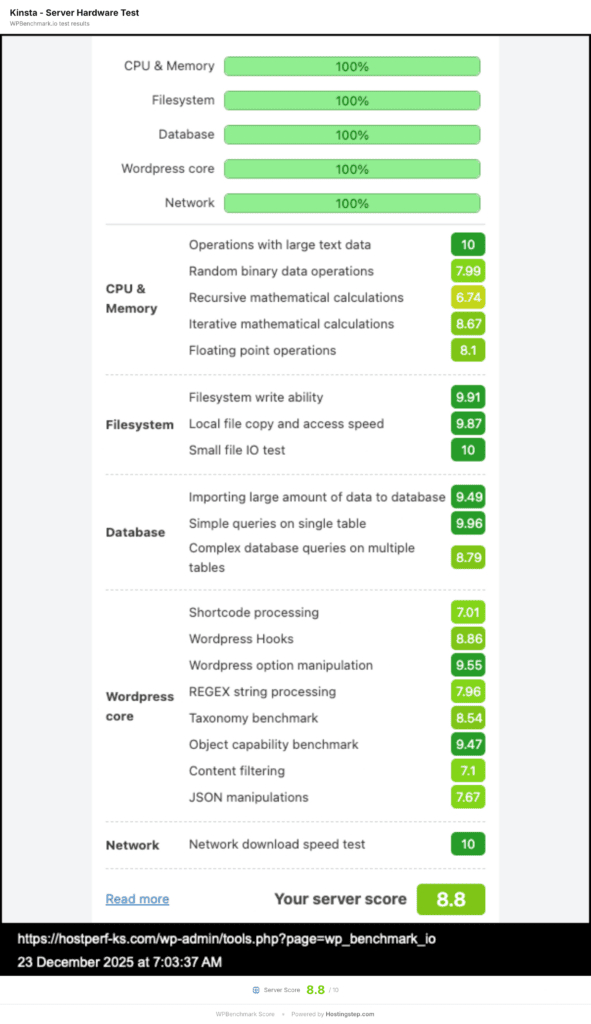
NameHero and ChemiCloud are the worst performers with 3.7 and 6.1 respectively. As we compare Kinsta with its competitors, SiteGround scored 8.4, Cloudways scored 7.6, Rocket.net scored 7.5, Hostinger scored 7.4, Pressable scored 6.7, and WP Engine scored 6.5. Kinsta has the best hardware allocations compared to its competitors and it beats WP Engine by a wide margin with 8.8 vs 6.5.
Kinsta with a WPBench of 8.8 is ideally positioned to produce a sub 400 ms TTFB but the host delivers a TTFB of 525 ms, showing a clear gap. Even SiteGround has the same issue with a TTFB as high as 745 ms despite a hardware score of 8.4. Even though Kinsta has a much more efficient delivery stack, it’s not able to fully translate the hardware strength to delivery speed. The hardware impact is however visible in Kinsta’s load handling, which is excellent with 40 ms.
WordPress sites running over 30 plugins with complex database queries will work smoothly as they benefit from Kinsta’s strong underlying computational power. Besides, large product catalogues, dynamic pricing and complex checkout flows will benefit from Kinsta’s high CPU and RAM allocation. Developers will also benefit significantly as custom PHP applications, complex WordPress builds, and resource-intensive cron jobs will run efficiently.
Global TTFB
Kinsta recorded an average global TTFB of 477 ms, scoring 7 out of 10. We tested the host in over 40 cities across Americas, Europe, and Asia Pacific. The host comes with Cloudflare Edge CDN with over 300 POPs and HTTP/3 to give you a picture that no other review site provides.
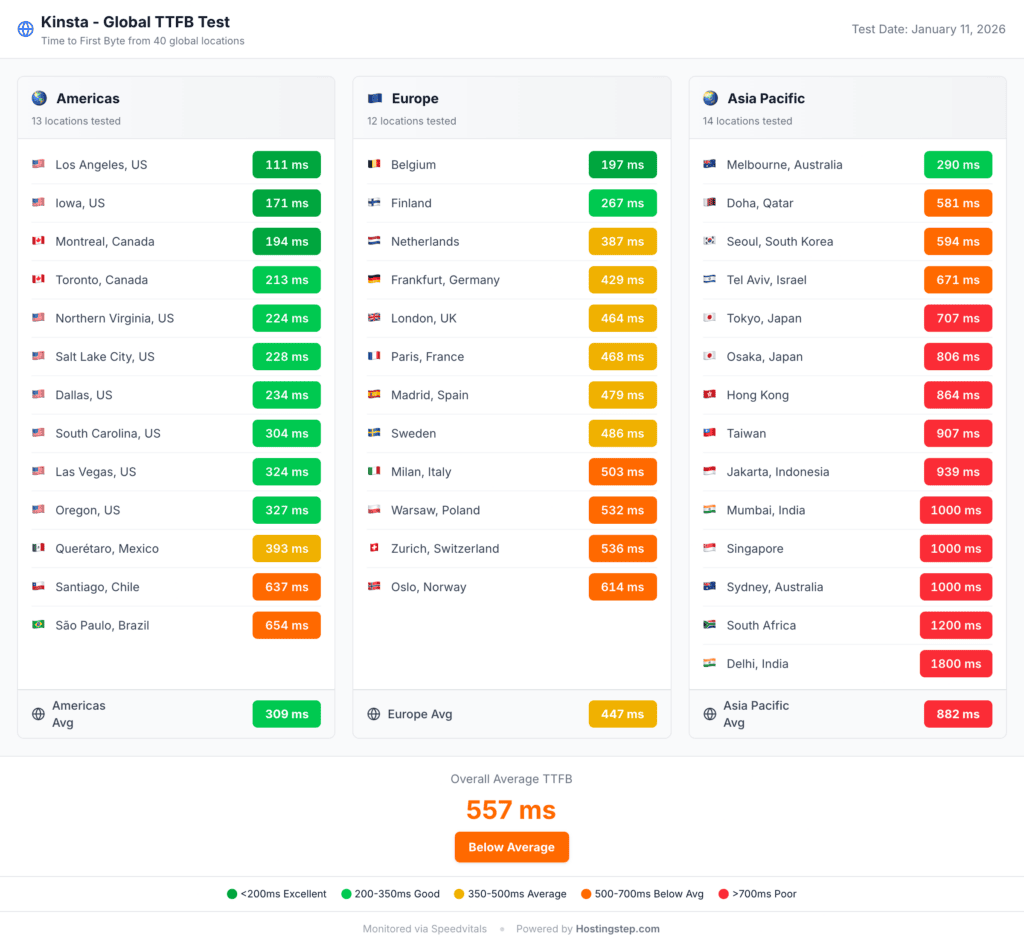
The Global TTFB test measures the delivery speed of sites around the world and not just in the US and is important for sites that rely largely on international traffic. Kinsta uses Cloudflare edge CDN to cache your content from over 300 locations worldwide and deliver the content to your global traffic from the nearest locations. Ideally, the host should deliver sub 300 ms response times globally with edge CDN but the results are mixed.
Kinsta recorded an average global TTFB of 268 ms in America, which is a strong performance. Cities with the best TTFB performance are Northern Virginia with 118 ms, Dallas with 127 ms, and Toronto with 156 ms. Cities with mid range performance are Iowa with 168 ms, Montreal with 175 ms, and Los Angeles with 194 ms. Cities that recorded weaker performance are Las Vegas with 217 ms, Oregon with 245 ms, and Salt Lake City with 275 ms. Cities with poor performance are South Carolina with 400 ms, São Paulo with 481 ms, and Santiago with 754 ms. While US and Canadian traffic is well served, Latin America suffers, likely due to fewer Cloudflare edge nodes or origin routing.
The average global TTFB in Europe is 420 ms and fairly tightly clustered. Paris with 382 ms, London with 390 ms, and Madrid with 391 ms are the best cities. Cities with mid range performance are Frankfurt with 396 ms, Netherlands with 415 ms, Sweden with 416 ms, and Belgium with 416 ms. Kinsta recorded weaker TTFB in Finland with 434 ms, Milan with 435 ms, Zurich with 456 ms, and Warsaw with 487 ms. Most European cities land in the 380 ms to 490 ms range, which is acceptable but not as strong as WP Engine’s Europe performance.
Our global TTFB test revealed Kinsta’s weakness in Asia Pacific with an average of 700 ms, the host’s biggest regional weakness despite edge CDN. The only bright spot was Seoul with 286 ms, which likely benefits from a well connected edge node. Cities with mid range performance are Osaka with 491 ms, Tokyo with 520 ms, and Tel Aviv with 552 ms. Cities with poor TTFB are Doha with 620 ms, Sydney with 626 ms, Taiwan with 641 ms, Hong Kong with 650 ms, and Melbourne with 665 ms. The worst TTFBs were seen in Jakarta with 716 ms, Singapore with 717 ms, South Africa with 839 ms, Delhi with 859 ms, Mumbai with 1.0 s, and Dubai with 1.3 s. At a TTFB approaching or exceeding 1.0 s, pages take 3 to 5 seconds to fully load, which can directly impact bounce rate and conversion. Google’s threshold for a good server response is under 800 ms, and several Asia Pacific cities exceed this.
Any host with edge CDN should ideally deliver sub 300 ms global TTFB. However, Kinsta’s 477 ms global average trails its edge-CDN peers badly: WP Engine averages 65 ms, Pressable 74 ms, and Rocket.net 66 ms across the same locations. This indicates that Kinsta’s Cloudflare integration or Oracle Cloud’s origin routing is not as effective as the competitors’ CDN implementation. Simply put, Kinsta’s CDN works for America at 268 ms and holds up in Europe at 420 ms but falls short in Asia Pacific at 700 ms.
If your site’s 30% of traffic comes from Asia Pacific, Kinsta isn’t the right host for you considering its poor global TTFB performance in Asia Pacific. You can instead go with WP Engine at 65 ms or Pressable at 74 ms global, which is over 6x faster delivery speed worldwide at comparatively lower prices.
Kinsta vs Competitors
| Metric | Kinsta | WP Engine | Pressable | Hostinger Business | SiteGround | Cloudways | Rocket.net |
| TTFB | 525ms | 355ms | 320ms | 438ms | 745ms | 428ms | 346ms |
| TTFB Score | 6/10 | 9/10 | 10/10 | 8/10 | 3/10 | 8/10 | 10/10 |
| Uptime | 99.98% | 100% | 100% | 99.98% | 99.96% | 99.99% | 99.97% |
| Load Test | 40ms/0% | 27ms/0% | 12ms/0% | 31ms/0% | 170ms/0% | 96ms/0% | FAILED |
| Load Score | 9/10 | 10/10 | 10/10 | 9/10 | 6/10 | 7/10 | 0/10 |
| Global TTFB | 477ms | 65ms | 74ms | 351ms | 1200ms | 386ms | 66ms |
| Global Score | 7/10 | 10/10 | 10/10 | 8/10 | 4/10 | 8/10 | 10/10 |
| WPBench | 8.8 | 6.5 | 6.7 | 7.4 | 8.4 | 7.6 | 7.5 |
| CDN | Edge | Edge | Edge | Static | Addon | Addon | Edge |
| None | None | Addon | Addon | Included | Addon | None | |
| Backups | Daily | Daily | Daily | Daily | Daily | Daily | Daily |
| Intro Price | $30/mo | $23/mo | $20.83/mo | $3.69/mo | $2.99/mo | $16/mo | $25/mo |
| Renewal | $30/mo | $30/mo | $20.83/mo | $7.99/mo | $17.99/mo | $16/mo | $25/mo |
Kinsta vs WP Engine
WP Engine wins on TTFB with 355 ms vs 525 ms, Uptime with 100% vs 99.98%, Load handling with 27 ms vs 40 ms, and global TTFB with 65 ms vs 477 ms, which makes it roughly 7x faster globally. Kinsta, on the other hand, wins on WPBench hardware with 8.8 vs 6.5 and this also is the host’s strongest advantage against its competitors.
Besides, both hosts use edge CDN, don’t include email and both are premium managed WordPress hosts targeting agencies. WP Engine also wins on price with $23 per month vs $30 per month, and its renewal matches Kinsta’s flat rate at $30 per month. WP Engine is a clear winner on performance and pricing while Kinsta has a leading edge in terms of server hardware allocation. (Check Kinsta Vs WP Engine)
Kinsta vs Pressable
Pressable wins on TTFB and is 205 ms faster than Kinsta with 320 vs 525 ms. Besides, Pressable wins on Uptime with 100% vs 99.98%, Load handling with 12 ms vs 40 ms, and global TTFB with 74 ms vs 477 ms. Kinsta wins on WPBench score with 8.8 vs 6.7, which reflects strong hardware allocation and also comes with edge CDN.
Pressable is 31% cheaper than Kinsta with $20.83 per month flat vs $30 per month flat. You can save about $330 over 3 years choosing Pressable over Kinsta. While Pressable is a WordPress.com product, with a different ecosystem, Kinsta comes with a MyKinsta dashboard with developer-friendly features like SSH, WP-CLI, Git, and APM. Pressable offers the strongest value as a premium managed segment. (Check Pressable Review)
Kinsta vs Hostinger Business
Hostinger Business wins on global TTFB with 351 ms vs 477 ms and, notably, on TTFB itself — Hostinger recorded 438 ms against Kinsta’s 525 ms, making it 87 ms faster. Hostinger also wins on load handling with 31 ms vs 40 ms. Kinsta only wins on WPBench with 8.8 vs 7.4, which suggests it has better hardware allocation even though Hostinger’s score of 7.4 is also acceptable. However,
Hostinger Business costs a lot lower than Kinsta with $3.69 per month vs $30 per month. Even the renewals are a lot cheaper than Kinsta with $7.99 per month vs a flat $30 per month. Kinsta would cost about $316 more over 1 year and roughly $844 more over 3 years. Hostinger is a budget shared host while Kinsta is a premium managed WordPress host. However, this is the most damning comparison, which hints at an important question if Kinsta’s premium is really justified. (Check Hostinger Review)
Kinsta vs SiteGround
Kinsta wins on every speed metric comprising TTFB with 525 ms vs 745 ms, Load handling with 40 ms vs 170 ms, global TTFB with 477 ms vs 1200 ms. SiteGround wins on email as it comes with included email while Kinsta doesn’t. Kinsta has slightly better hardware allocation than SiteGround with WPBench of 8.8 even though SiteGround also comes with strong hardware allocation with 8.4. Kinsta’s edge CDN works far better than SiteGround’s addon CDN, given the global TTFB gap of 477 ms vs 1200 ms.
SiteGround wins on price with $2.99 per month intro vs $30 per month intro. SiteGround is 10x cheaper and you have to pay about $324 more for Kinsta over 1 year in terms of intro. SiteGround also has cheaper renewals than Kinsta with $17.99 per month while Kinsta’s renewal price remains flat with $30 per month. SiteGround is 10x cheaper than Kinsta but it delivers below average performance while Kinsta offers measurably faster speed for a premium pricing. (Check SiteGround Review)
Kinsta vs Cloudways Vultr HF
Cloudways wins on TTFB with 428 ms vs 525 ms, Uptime with 99.99% vs 99.98%, and global TTFB with 386 ms vs 477 ms. Kinsta wins on load handling with 40 ms vs 96 ms, WPBench 8.8 vs 7.6, and CDN with edge vs addon. Cloudways wins on intro price with $16 per month vs Kinsta’s $30 per month flat. As you can see Kinsta costs about 1.9x more, and over 3 years you pay $504 more with Kinsta.
Cloudways is a self managed cloud with no cPanel, which makes it more technical while Kinsta is fully managed with MyKinsta. However, each platform is built with different users in mind. Cloudways suits developers while Kinsta suits users wanting the managed hosting convenience. Kinsta and Cloudways are close in terms of performance but Kinsta has the advantage of coming with an edge CDN. (Check Cloudways Review)
Kinsta vs Rocket.net
Rocket.net wins on TTFB with 346 ms vs 525 ms, and global TTFB with 66 ms vs 477 ms, which have to do a lot with the host’s Cloud Enterprise integration which delivers exceptional global speeds. Kinsta, on the other hand, wins on load handling with 40 ms/0% errors vs FAILED. Rocket.net FAILED the load test with 100% error rate, scoring 0/10, which is a dealbreaker for any site expecting traffic spikes. WPBench with 8.8 vs 7.5, and overall reliability.
Rocket.net wins on pricing with $25 per month flat vs $30 per month flat, which makes it 17% cheaper than Kinsta. Choosing Rocket.net over Kinsta, you can save $180 over 3 years. Even though Rocket.net delivers impressive delivery speed, the 100% load test failure makes it a big no for any production sites. Kinsta is a safer choice for such sites. (Check Rocket.net Review)
Who Should Use Kinsta
Business sites with visitors between 10k to 50k and traffic based in the US or Canada can use Kinsta since the host delivers a TTFB of 268 ms in America, which is strong. Besides, the host also comes with an excellent load handling of 40 ms, which can efficiently handle traffic spikes. The MyKinsta dashboard offers easy server management and the host also offers strong hardware allocation with a WPBench of 8.8.
WordPress developers and agencies can use Kinsta since the host offers a wide range of developer tools comprising SSH, WP-CLI, Git, Staging, APM, and a developer API. The high WPBench of 8.8 suggests that the host is capable of handling complex builds.
Sites that need strong load handling should choose Kinsta since the host recorded 40 ms/0% error in the load test, indicating excellent load handling strength to handle traffic spikes during Ecommerce flash sales, media sites viral moments, or event driven traffic. Besides, Kinsta comes with isolated container architecture meaning other tenants can’t impact the performance. The host recorded 40 ms with 0% errors in the load test, scoring 9 out of 10.
Kinsta is an ideal host for users who prefer predictable pricing since the host comes with flat pricing unlike shocking renewals as in many other hosts. Kinsta’s lowest tier plan starts at $30 per month and renews at the same price with no surprising jumps. For any business budgeting annually, the no renewal shock model will be more simpler than budget hosts offering $2.99 per month intro price and renewal as high as $17.99 per month as in SiteGround, which is 6x renewal multiplier.
WooCommerce stores with high computational needs can benefit a lot from choosing Kinsta since the host secured a WPBench score of 8.8, which indicates that the host offers strong CPU and RAM allocation on its plan, which will eventually help such stores with faster product catalog rendering, smoother complex checkout flows and efficiently manage database heavy plugins. The strong hardware allocation combined with Kinsta’s excellent load handling of 40 ms will make such stores responsive even during traffic spikes. Kinsta posts one of the highest WPBench scores at 8.8.
Who Should NOT Use Kinsta
Budget conscious site owners should not use Kinsta since the host costs $30 per month, which is about 8x the price of Hostinger Business at $3.69 per month. Hostinger Business recorded a TTFB of 438 ms, which is 87 ms faster than Kinsta’s 525 ms. Over 3 years, you can save roughly $844 if you choose Hostinger over Kinsta. Kinsta’s premium is not justified for personal blogs, hobby sites, or businesses where cost matters more than managed convenience.
Kinsta is not ideal for sites that rely largely on Asia Pacific traffic since the host recorded an average of 700 ms, signaling sluggish page loading for visitors with page loading taking from 3 to 5 seconds. At some places, the TTFB is even more than a second. TTFB in Mumbai is 1.0 s, and Delhi is 859 ms. Besides, Kinsta recorded 717 ms in Singapore, 716 ms in Jakarta, and 1.3 s in Dubai. Such sites can choose WP Engine at 65 ms or Pressable at 74 ms global.
Users who need included email should not choose Kinsta since the host doesn’t come with email hosting on any of its plans. If you stick to Kinsta and opt for Google Workspace at $6 per month for one user, it will add $72 per year per user. SiteGround comes with free email for $2.99 per month intro and GreenGeeks also includes free email for $2.95 per month intro.
If you are already comfortable in the $23 to $30 range, WP Engine at $23 per month and Pressable at $20.83 per month both outperform Kinsta on delivery speed while costing less. Hence, it would not be wrong to say that Kinsta at $30 per month doesn’t deliver the fastest speed.
Kinsta is not the ideal host for sites targeting Latin America audiences since the host recorded poor TTFB in Latin America. Kinsta recorded 754 ms in Santiago and 481 ms in São Paulo despite edge CDN. Hostinger Business delivers a 351 ms global average and also has stronger Latin America coverage. It’s also worth mentioning that Kinsta’s CDN is not mitigating distance effectively for Brazil, Chile and Mexico.
Our Verdict
Kinsta scored 8.30 out of 10 for performance in our 2026 rankings. The host had an uptime dip in 2025, which was partly due to a Cloudflare outage. We found Kinsta to be one of the most expensive hosts with a premium of $30 per month, and its performance doesn’t fully justify the premium. The performance needs to be better at this price point since even budget hosts like Hostinger Business match or beat it on delivery speed.
Kinsta’s strengths lie in its strong hardware allocation with a WPBench of 8.8 and an excellent load handling of 40 ms with zero errors. We recommend Kinsta if you need a fully managed WordPress host with strong load handling, excellent server hardware, and predictable flat rate pricing. However, you must choose Kinsta if your audience is primarily in the US or Canada. We do not recommend Kinsta if you are under a tight budget since the host is too pricey with $30 per month intro.
We also do not recommend Kinsta if your site depends on Asia Pacific traffic since Kinsta recorded its worst global average in Asia Pacific with 700 ms. You can instead choose a host with better global average in Asia Pacific like WP Engine or Pressable. These hosts also offer cheaper intro prices than Kinsta.
If there is a single best alternative to Kinsta, it’s none other than Pressable, with a 320 ms TTFB, 74 ms global TTFB, and 100% uptime, for $20.83/mo flat.
Methodology
We purchase all our hosting accounts with our own funds and they are not promotional or press accounts. We use various tools for testing and monitoring, which include Pingdom for TTFB and Uptime, Loader.io for load testing, SpeedVitals for global TTFB and WPBenchmark for testing server hardware allocation. We conduct over 525,600 tests per provider per year every minute, 24/7/365.
Our methodology scoring system details how we test each host. Our data period is our 8-month window, from October 1, 2025 to May 31, 2026 for current rankings. The historical depth we used while writing this review starts from 2020 with over 1960 days of data. We tested a total of 34 providers.