HostArmada is a pretty young hosting company founded in 2019. We’ve been looking at new hosting companies to include in our list of tested hosts and we found HostArmada to be interesting as they resemble much of FastComet hosting. Their initial impressions are good, so we went ahead and bought their Start Dock plan at $1.99/month. We followed our standardized WordPress setup and put the HostArmada test site into 24/7, 365 days of monitoring.
Note: This review is based on our testing of HostArmada’s Start Dock plan. The performance figures are measured data; the recommendations reflect our editorial assessment of those results. Unless stated otherwise, everything here applies to the Start Dock plan while other HostArmada plans may produce different benchmark results.
Our Verdict
HostArmada has recorded an excellent load handling of 32 ms with zero errors. It has a strong TTFB response time and uptime. However, the Server Hardware Test score is below average. Overall, HostArmada now works for websites serving the Americas and Europe, though the absence of an integrated CDN still shows in Asia Pacific. However, the host is a strong choice for any website that has a targeted audience in a single region. To clear things up, HostArmada provides its services from 11 data centers locations across the globe and if you choose their Dallas data center to host your site, then you can expect faster performance across the USA and slightly slower in Europe and Asia. Likewise, you can choose a London or Singapore data center and expect faster performance around these regions, but don’t expect a faster experience for your global visitors.
TTFB Response Time
HostArmada records an average TTFB response time of 435 ms across our 8-month monitoring window. Based on our methodology, we rank them as a strong contender for TTFB performance. In one of the best months, they have recorded an average response time of 333 ms, while their worst month is 1132 ms. The difference between these two months is 799 ms, which is wider than we want to see and points to at least one period of instability rather than a flat response curve.
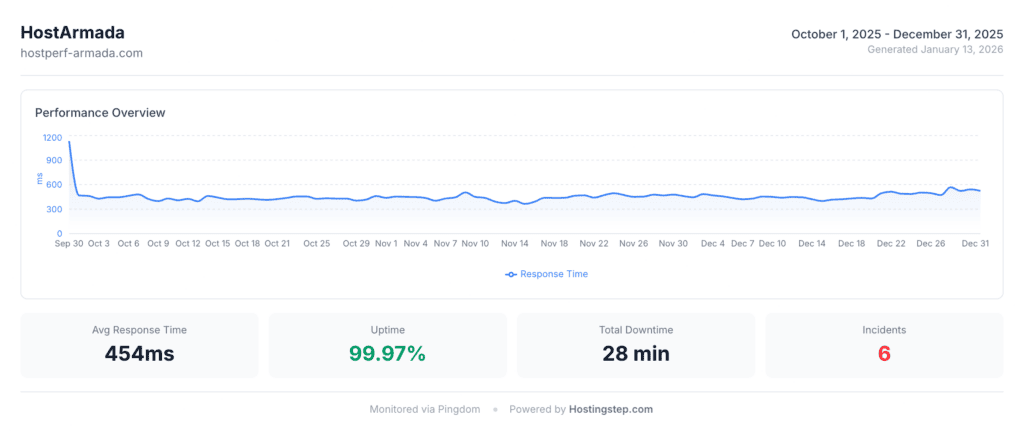
HostArmada is only behind GreenGeeks, which has recorded 411 ms in the same time period; however, they are performing better than many other WordPress hosting services. The two closest hosting services are Cloudways Vultr and Hostinger Business, which have recorded 419 and 438 ms, respectively.
Methodology: TTFB or Time to First Byte measures how quickly the host responds to the user request. Lower the response time, it indicates fast servers. We use the Pingdom Synthetic Monitoring Tool to monitor the HostArmada test site from 19 North American regions. We monitored continuously from October 1, 2025 to May 31, 2026, a 243-day window generating 69,984 TTFB measurements at five-minute intervals.
Uptime
Uptime is one of the non-negotiable factors in web hosting. No one tracks the uptime as we do at Hostingstep.com, where we monitor the HostArmada test site every 60 seconds from 19 North American locations. We also set a threshold for 30 seconds. If the site is not responsive, then it will be marked as down.
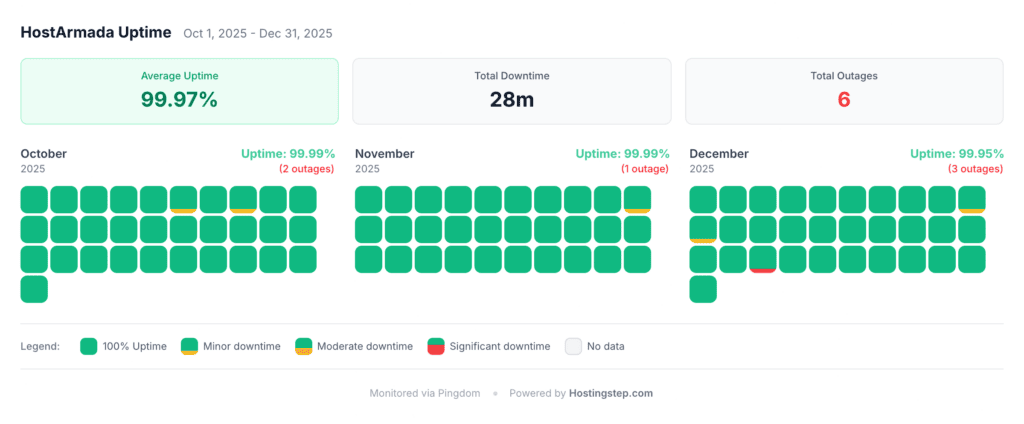
HostArmada recorded an average uptime of 99.95% between October 1, 2025 and May 31, 2026. There were 15 outages totalling 2 hours and 52 minutes of downtime across 243 days. HostArmada offers an uptime SLA of 99.9%, and the recorded uptime is well within their SLA. Most of that downtime landed between January and May 2026 rather than spreading evenly across the window, which is the trend we will keep watching.
| Metric | Value |
| Uptime | 99.95% |
| Total Outages | 15 |
| Total Downtime | 2h 52m (Over 243 Days) |
| Industry Standard | 99.9% |
| HostArmada’s SLA | 99.9% |
| Rating | Strong |
Load Test
HostArmada records an average response time of 32 ms in our load handling test. Load tests are crucial for websites that get regular traffic spikes. We use the Loader.io tool to send 0 to 100 concurrent users for 60 seconds and measure the average response time. A lower response time indicates the host is faster in handling the web pages
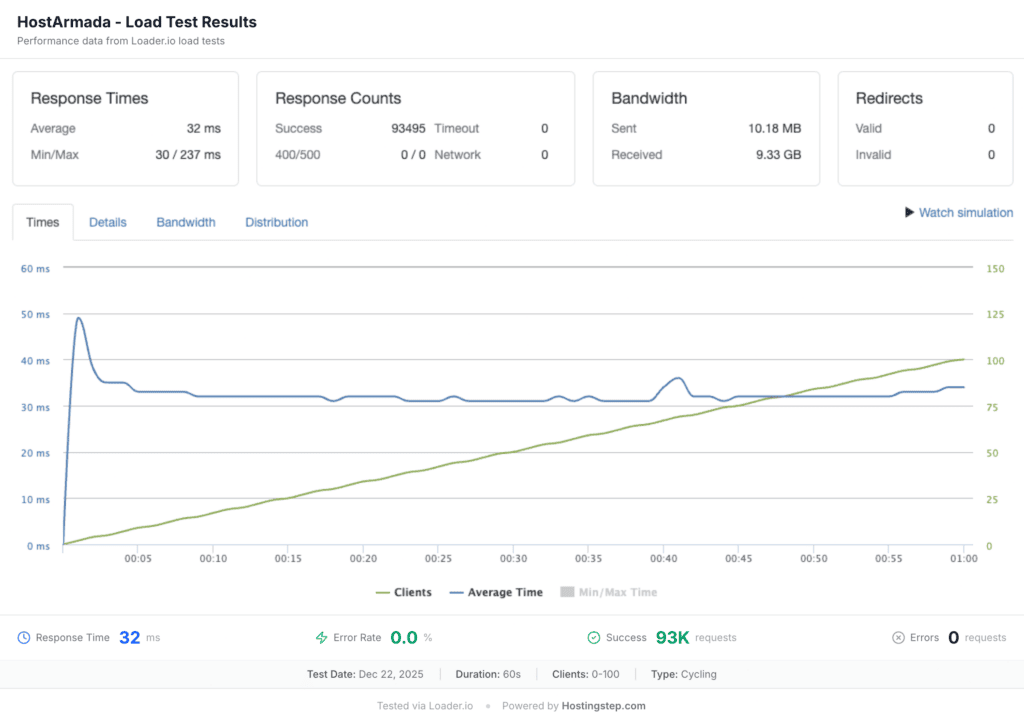
| Metric | Value |
| Average Response Time | 32 ms |
| Error Rate | 0% |
| Concurrent Users | 100 |
| Rating | Elite |
HostArmada is one of the few shared hosts which has got an Elite load handling performance at a low cost price of $1.99 per month, the HostArmada performance equals the performance of managed WordPress services like Kinsta, WP Engine and Pressable which are priced around $25 per month.
The interesting part is that there are 0% error rates, indicating the host handles all the requests without any issues. Our HostArmada test site is hosted on their starter plan, which is powered by Nginx web server, and the top Speed Reaper plan comes with LiteSpeed web servers along with a few other speed features, though we have not tested that plan.
Global TTFB
HostArmada records an average global TTFB of 402 ms and we rank them in the average category based on our methodology. Our test site is hosted on the Dallas data centre, and hence we have a strong TTFB of 156 ms across 13 American locations; the Europe average is recorded at 381 ms across 11 locations, while Asia Pacific is slower at 629 ms across 15 locations. Within Asia Pacific the spread is wide, from 425 ms in Tokyo to 793 ms in Mumbai and 1100 ms in Dubai.
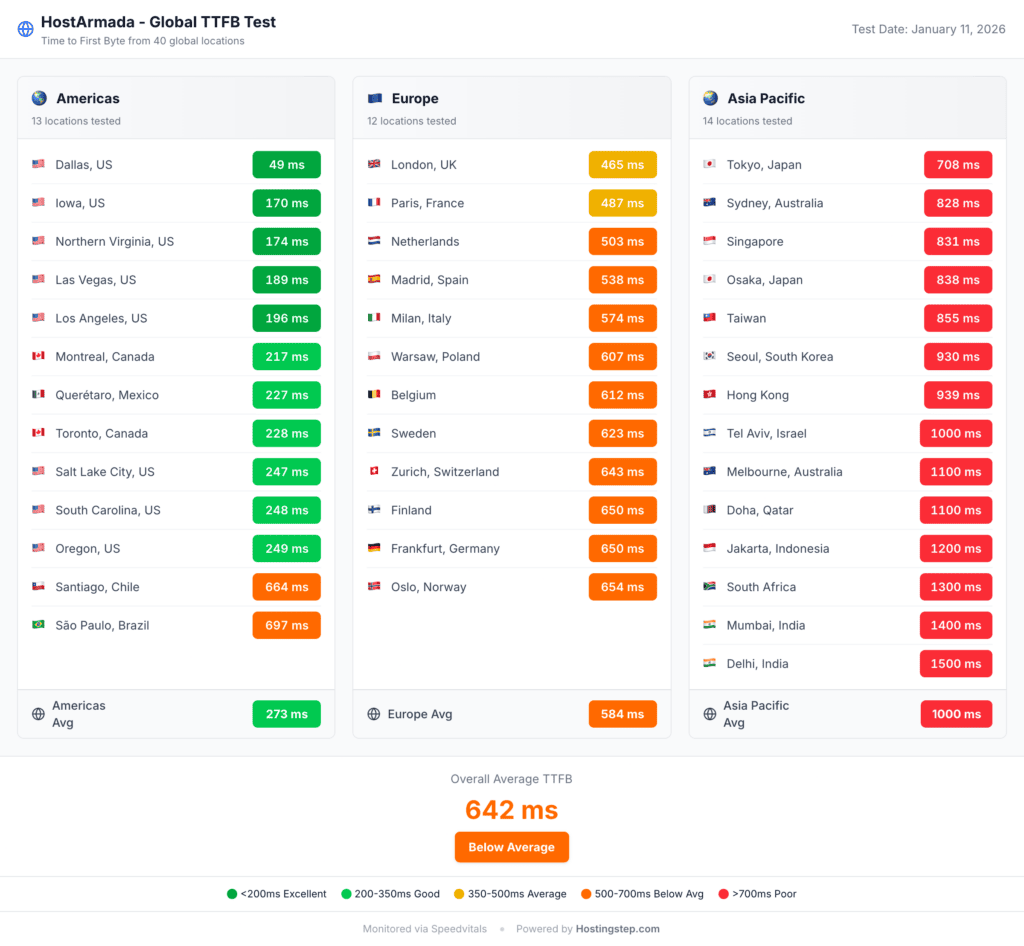
We ping the HostArmada test site from 40 global locations to measure the global TTFB performance. While our first TTFB response time test is measured from 19 North America regions repeatedly to measure the cached response time, this Global TTFB score is highly useful for sites that have global visitors.
HostArmada’s global TTFB of 402 ms now sits mid-pack among the hosts we track. For example, GreenGeeks delivered a global TTFB of 386 ms without a CDN, similar to the tech stack of HostArmada. There is also Cloudways which has recorded 386 ms without CDN. There are also hosts like Bluehost that offer CDN and deliver a global TTFB of 224 ms.
| Host | Global TTFB | CDN Included? |
| Bluehost | 224ms | Yes |
| Hostinger Business | 351ms | Yes |
| GreenGeeks | 386ms | No |
| HostArmada | 402ms | No |
| HostGator | 427ms | Yes (static) |
| SiteGround | 1200ms | Yes (addon) |
HostArmada does not include an integrated CDN solution. Though they have mentioned free Cloudflare CDN on their marketing pages, they don’t offer any pre-configured integration. Users will need to sign up for a Cloudflare free account and configure it with the site manually. This is not a service offered at HostArmada, and they have no part in this.
We think HostArmada should offer integrated CDN solutions, which are offered by companies like Hostinger, Bluehost, and SiteGround, which work out of the box and can be configured with a single click.
In the end, HostArmada holds up for visitors in the Americas and Europe, but Asia Pacific traffic still faces a long trip back to the Dallas origin. However, if you like that other performance, like uptime and load handling, then you can use a Cloudflare APO, which costs $5/month, to speed up your site for global visitors.
Server Hardware Test
HostArmada records an overall score of 5.1/10 in our Server Hardware Test. The score is in the Average category. We use the WPBenchmark plugin to do 21 different tests across five categories. While our previous test can be optimised with CDN or caching plugins, this Server Hardware Test is purely based on testing the uncached requests and the Server performance. It mainly tests the CPU, memory, file system, database and WordPress operations.
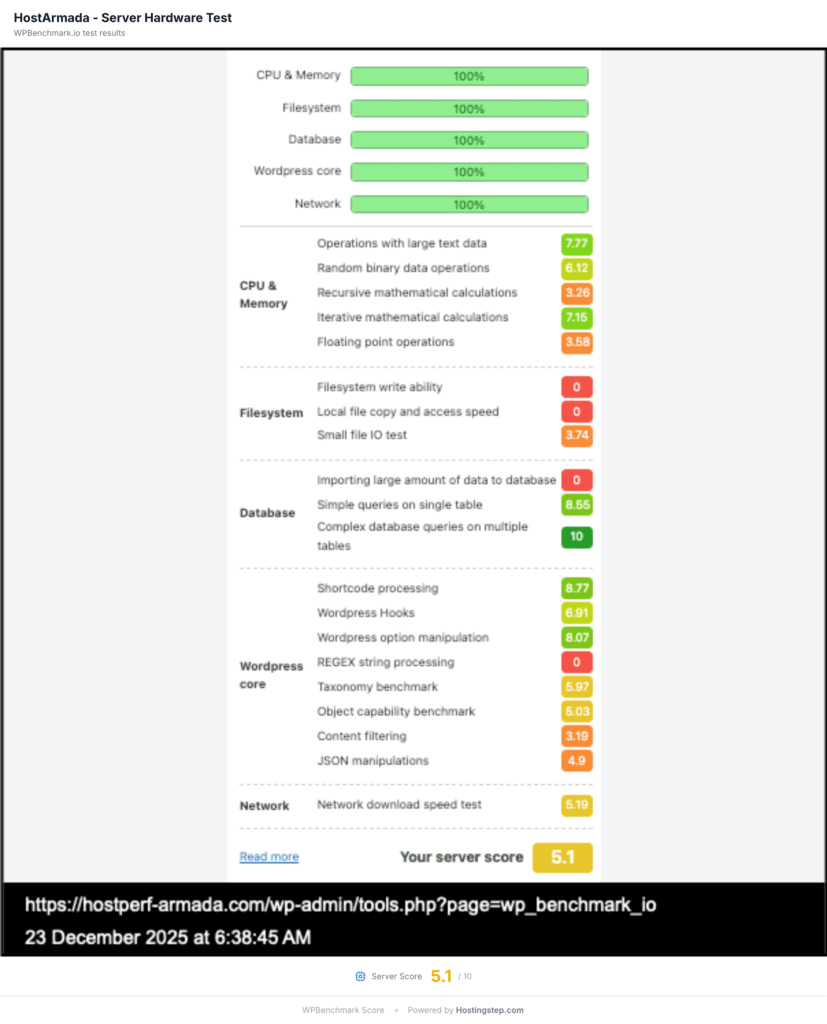
HostArmada records an average score across all the internal tests, indicating server hardware limitations of a shared hosting service. For most common sites, the scores won’t be an issue, but if you have a site where multiple authors work at the same time, publishing a bulk of posts like news articles or sites with high real-time traffic all the time, then HostArmada is not for you.
HostArmada Vs Competitors
| Metric | HostArmada | Hostinger Business | Bluehost | HostGator | SiteGround |
| Price (intro) | $1.99 | $3.69 | $1.99 | $3.75 | $3.99 |
| Renewal | $9.95 | $16.99 | $8.99 | $10.99 | $17.99 |
| TTFB | 435ms (Strong) | 438ms (Strong) | 501ms (Average) | 496ms (Average) | 745ms (Slow) |
| Uptime | 99.95% | 99.98% | 99.97% | 99.97% | 99.96% |
| Load Test | 32ms / 0% | 31ms / 0% | 131ms / 0% | 213ms / 2.0% | 170ms / 0% |
| Global TTFB | 402ms (Average) | 351ms (Strong) | 224ms (Elite) | 427ms (Average) | 1200ms (Slow) |
| WPBench | 5.1 | 7.4 | 9.6 | 9.6 | 8.4 |
HostArmada vs Hostinger Business ($3.69/mo):
Hostinger Business still leads on global TTFB, though the gap has narrowed sharply. Besides, Hostinger Business has been the closest competitor to HostArmada with identical load handling (31 ms vs 32 ms) and near-identical TTFB (438 ms vs 435 ms). However, Hostinger Business has been the winner in terms of global TTFB and uptime. While there is a slight difference between the uptime with 99.98% vs 99.95%, the global TTFB gap has closed to 51 ms with 351ms vs 402ms.
Hostinger also has an edge over HostArmada in terms of hardware score, with 7.4 vs 5.1, while HostArmada’s score isn’t bad either. HostArmada is an ideal host for single region sites and now handles multi-continent traffic acceptably outside Asia Pacific. Hostinger Business is the more consistent performer, though HostArmada costs far less on renewal at $9.95 vs $16.99.
HostArmada vs Bluehost ($1.99/mo):
HostArmada wins in terms of load handling and TTFB, while both hosts now start at the same $1.99. HostArmada has better TTFB than Bluehost, with 435 ms vs 501 ms. Besides, HostArmada has way better load handling than Bluehost. HostArmada recorded 32 ms in the load testing, while Bluehost could achieve 131 ms. However, Bluehost has done better in terms of Global TTFB with 224 ms vs 402 ms backed by integrated CDN, and it is the cheaper of the two on renewal at $8.99 vs $9.95.
HostArmada vs HostGator ($3.75/mo):
HostArmada wins this comparison with better TTFB, Load handling, and pricing. First, HostArmada has comparatively better TTFB than HostGator, with 435 ms vs 496 ms. Besides, HostArmada beats HostGator in terms of load handling by a big difference with 32 ms/ 0% vs 213 ms / 2.0% errors.
HostArmada’s Global TTFB is better than that of HostGator, with 402 ms vs 427 ms. However, HostGator’s uptime was slightly better than that of HostArmada, with 99.97% vs 99.95%.
Most importantly, there is a big difference in price and HostArmada is undoubtedly way more affordable than HostGator with $1.99 vs $3.75. Hence, HostArmada can be an ideal host for many websites that are looking for reliable performance under a tight budget.
HostArmada vs SiteGround ($3.99/mo):
HostArmada beats SiteGround in terms of TTFB, load handling, and pricing. SiteGround holds a marginal uptime lead with 99.96% vs 99.95%. HostArmada now leads decisively on global TTFB with 402 ms vs 1200 ms.
However, HostArmada costs a lot less than SiteGround, with $1.99 vs $3.99. SiteGround does have a good custom Site Tools dashboard and managed CDN addon, but if you only care to host your site with a reliable host under a tight budget, HostArmada is the one to go with.
Who Should Use HostArmada?
HostArmada offers you 11 data centers in the US, UK, Europe, India, and Australia, and you pick one at signup, since your site lives on that server alone with no replication across the other locations. This makes it ideal for sites with a regional audience. Users can choose the closest server to their audience for strong TTFB plus excellent load handling.
Sites with viral content, flash sales, or marketing content that expect traffic spikes can benefit a lot from HostArmada’s strong load handling. The host has a response time of 32 ms with 0% errors, which helps to handle sudden traffic surges efficiently, regardless of the data center you choose.
HostArmada is ideal for site owners who are under a tight budget yet need a host with excellent TTFB, strong uptime, and powerful load handling. There is no other host in the market that offers such a value at this low price.
First-time site owners can benefit a lot from HostArmada as the host comes with cPanel, Live Human Chat Support, and a 45-day money-back guarantee on annual plans.
However, HostArmada is a weaker fit for sites with a large share of visitors in Asia Pacific, South Asia, or the Middle East. We measured 793 ms in Mumbai, 829 ms in Delhi, and 1100 ms in Dubai from the Dallas origin. Hostinger Business can be a good alternative for such sites. Hostinger Business comes with a global TTFB of 351 ms, handling multi-continent traffic better than HostArmada.
HostArmada Start Dock comes with limited storage of 15 GB. Now, this may not be just enough for media-heavy or large sites such as large WooCommerce stores or Photography portfolios. Such sites need to consider the Web Warp plan, which offers 30 GB for $3.29 per month, or consider another host.
Despite the “free Cloudflare CDN” advertisement on HostArmada’s marketing pages, there’s actually no integrated CDN. One will need to do it the hard way, signing up with a Cloudflare free account and manually configuring the DNS. For users looking for an integrated CDN, HostArmada may not be the right option.
HostArmada’s Start Dock isn’t ideal for users looking for a plan to host multiple sites since the plan allows you to host just one site. For hosting multiple sites, one may consider choosing the Web Warp plan for $3.29 per month. It’s also worth mentioning that this price is pretty close to Hostinger Business, which is $3.69, which not only offers 100 website hosting but also has the best overall performance.
Final Verdict
HostArmada has strong features and does pretty well in some specific scenarios. However, there are scenarios where it falls short.
- HostArmada’s global TTFB improved to 402 ms, making it workable for sites serving the Americas and Europe
- The host is still an excellent option for sites with a single regional traffic
- HostArmada recorded strong TTFB & excellent Load handling
- The host’s uptime of 99.95% clears its 99.9% SLA, though it softened across the 8-month window with 15 outages
- The host scored an average of (5.1/10) in terms of server hardware
We hosted our test site on the Dallas data center and the results you are seeing are based on the single US-based origin server, Dallas. Users choosing a different data center, such as London, Mumbai, or Singapore, should see different regional performance. The performance is faster for local regions and slower for regions that are far away.
You can choose HostArmada if you have a site that aims to serve audiences in a single region and expect a strong performance at the most affordable price. HostArmada offers 11 data center locations and powerful load handling to keep your site up and running even during traffic spikes.
However, if a large share of your traffic comes from Asia Pacific, South Asia, or the Middle East, you need a host with better reach in those regions, such as Hostinger Business, which comes with a global TTFB of 351 ms for $3.69 per month. Another good alternative is GreenGeeks, with a global TTFB of 386 ms for $2.95 per month.
Testing Methodology
| Parameter | Detail |
| Test Site | Standardized WordPress installation |
| Theme | Twenty Twenty-Four |
| PHP Version | 8.4 |
| Caching | WP Fastest Cache |
| Plugins | Rank Math, Contact Form 7, and Akismet. |
| Data Center | Dallas, Texas, USA |
| Web Server | Nginx |
| TTFB Monitoring | Pingdom from 19 US locations, every 5 minutes |
| Uptime Tracking | 24/7 via Pingdom |
| Load Testing | Loader.io, 0–100 concurrent users, 60 seconds |
| Global TTFB | SpeedVitals from 40 global locations, cached, April 17, 2026 |
| Hardware Bench | WPBenchmark (CPU, Memory, I/O, Database, WordPress core operations) |
| Data Period | October 1, 2025 – May 31, 2026 (243 days) |
| Total TTFB Tests | 69,984 |
| Uptime Checks | 349,920 |