We have been testing and monitoring Bluehost since 2021 with 349,920 tests conducted between October 1, 2025 and May 31, 2026. The host recorded an average TTFB of 501 ms and an uptime of 99.97%. Bluehost is one of 34 providers tracked in our 2026 WordPress hosting rankings.
The host recorded 41 ms with a 0% error rate in the Load Test, and an average of 224 ms in the Global TTFB. Bluehost scored 9.6 out of 10 in the WPBench and ships a static CDN.
Bluehost’s Starter plan starts at an intro price of $1.99 per month and renews at $8.99 per month. Bear in mind that the host doesn’t offer free email hosting, and doesn’t even offer daily backups. The plan only comes with weekly backup.
Note: This review is based on our testing of Bluehost’s Starter plan. The performance figures are measured data; the recommendations reflect our editorial assessment of those results. Unless stated otherwise, everything here applies to the Starter plan while other Bluehost plans may produce different benchmark results.
| Metric | Bluehost Result |
| TTFB (US) | 501ms |
| Uptime | 99.97% |
| Load Test | 41ms @ 0% error rate |
| Global TTFB (avg) | 224ms |
| Server Hardware (WPBench) | 9.6/10 |
| CDN Type | Static CDN |
| Email Hosting | Addon (not included) |
| Backups | Weekly only |
| Intro Price | $1.99/mo |
| Renewal Price | $8.99/mo |
TTFB Response Time
In our TTFB test between October 1, 2025 and May 31, 2026, Bluehost recorded an average of 501 ms. That means the server takes half a second to respond before the browser receives its first byte. WordPress.com is the top performer in this metric with an average response time of 319 ms, while SiteGround is the slowest at 745 ms. Bluehost is 182 ms slower than WordPress.com and 244 ms faster than SiteGround.
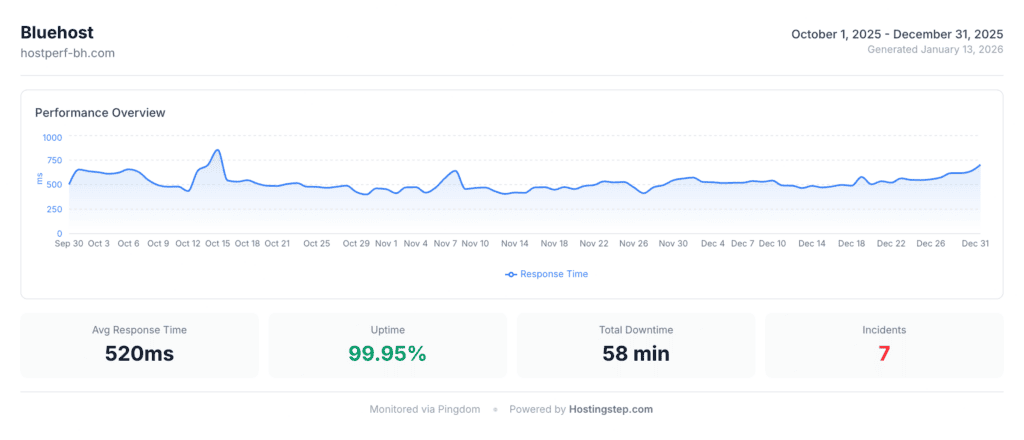
Bluehost recorded a TTFB of 532 ms in 2025 while the host recorded a TTFB of 408 ms in 2023, . This means the TTFB got worse by 124 ms and sites will take more time to load. The average across our current eight-month window sits at 501 ms, so the trend has flattened rather than reversed. You need to closely monitor the TTFB performance before going ahead with buying the plan. After all, you don’t want to lose your visitors because of slow page loading.
| Year | Tests Performed | Avg TTFB | Min TTFB | Max TTFB | Trend |
| 2021 | 473,760 | 440ms | 329ms | 733ms | Baseline |
| 2022 | 525,600 | 463ms | 330ms | 1,083ms | ↑ +23ms |
| 2023 | 525,600 | 408ms | 323ms | 769ms | ↓ -55ms (best year) |
| 2024 | 527,040 | 471ms | 353ms | 663ms | ↑ +63ms |
| 2025 | 524,160 | 532ms | 396ms | 855ms | ↑ +61ms (worst year) |
Uptime
Bluehost recorded an uptime of 99.97% across our eight-month window, with 10 outages and 84 minutes of total downtime. That works out to roughly 10 minutes of downtime per month, or about two hours per year. For most sites, that is a reasonably good uptime. Three providers held a flat 100% across the same window: WordPress.com, Pressable and WP Engine.
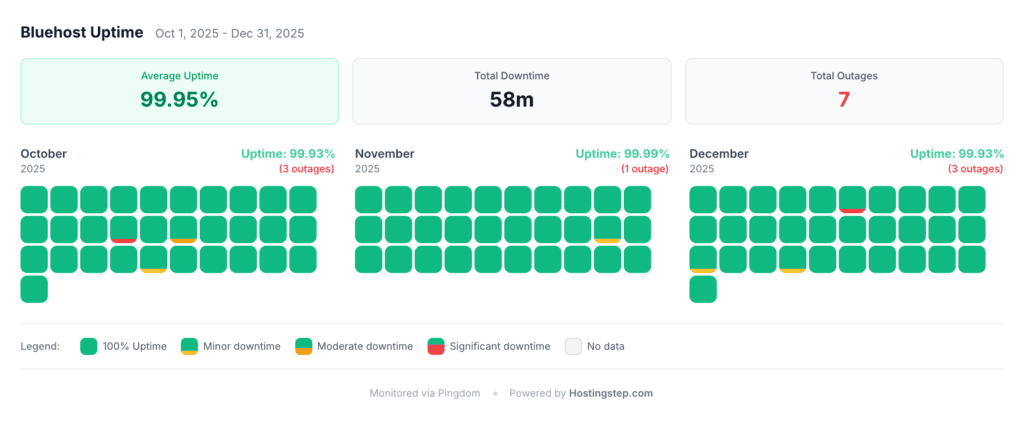
Bluehost had the worst uptime in 2022 with 1,806 minutes of downtime, which is over 30 hours in a single year. Besides, it experienced the worst day with an uptime of 35.01%, which means our site was down for 65% of that day. However, we have seen improvements since 2023. Bluehost has brought its outages down to 10 and total downtime to 84 minutes across our current window, holding 99.97% uptime.
| Year | Tests | Avg Uptime | Total Downtime | Outages | Worst Day |
| 2021 | 473,760 | 99.98% | 81 min | 20 | 98.19% |
| 2022 | 525,600 | 99.66% | 1,806 min (30+ hrs) | 38 | 35.01% |
| 2023 | 525,600 | 99.95% | 268 min | 30 | 95.83% |
| 2024 | 527,040 | 99.97% | 141 min | 12 | 97.01% |
| 2025 | 524,160 | 99.97% | 134 min | 14 | 97.36% |
Load Handling
Bluehost recorded an average response time of 41 ms with a 0% error rate under a ramp from 0 to 100 concurrent visitors over 60 seconds. Every request the test issued was served successfully. No visitor received an error during the traffic spike.
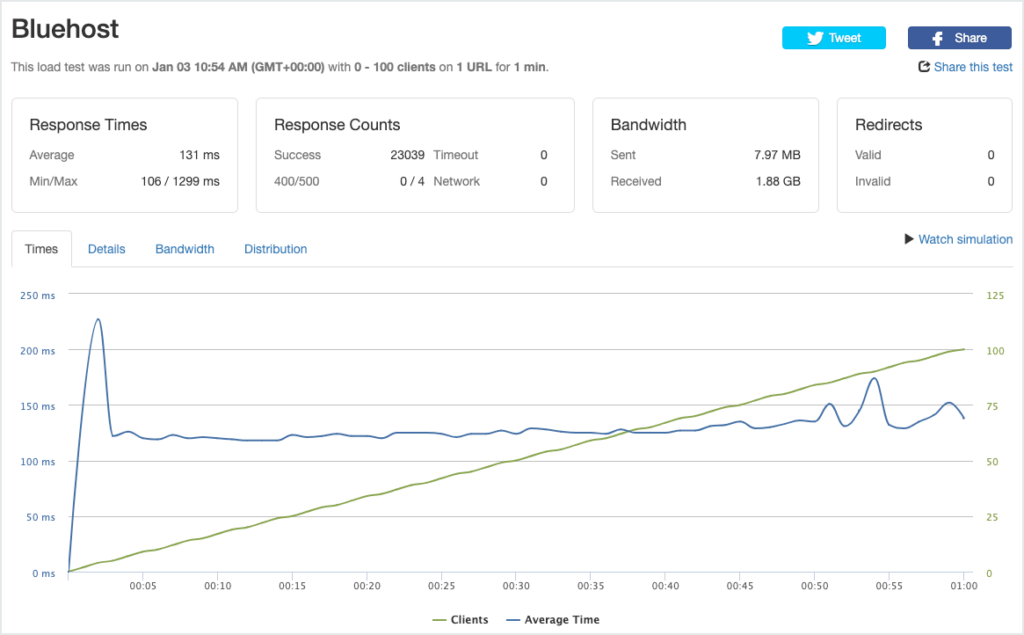
A clean 0% error rate at 41 ms puts Bluehost among the strongest load-handling results we recorded. Sites that expect traffic spikes can rely on the Starter plan to absorb them without dropping requests.
Other hosts that achieved a 0% error rate are Pressable (12ms), WordPress.com (16ms), WP Engine (27ms), GreenGeeks (26ms), and HostArmada (32ms). At 41 ms, Bluehost lands directly alongside that group despite costing a fraction of the managed hosts on it.
Server Hardware Test
Bluehost recorded a WPBench score of 9.6 out of 10, and this is one of Bluehost’s strongest metrics. HostGator matches it at 9.6. Other providers that scored well in the WPBench test are ScalaHosting with 8.8, Kinsta with 8.8, SiteGround with 8.4, and Hostinger with 7.4.
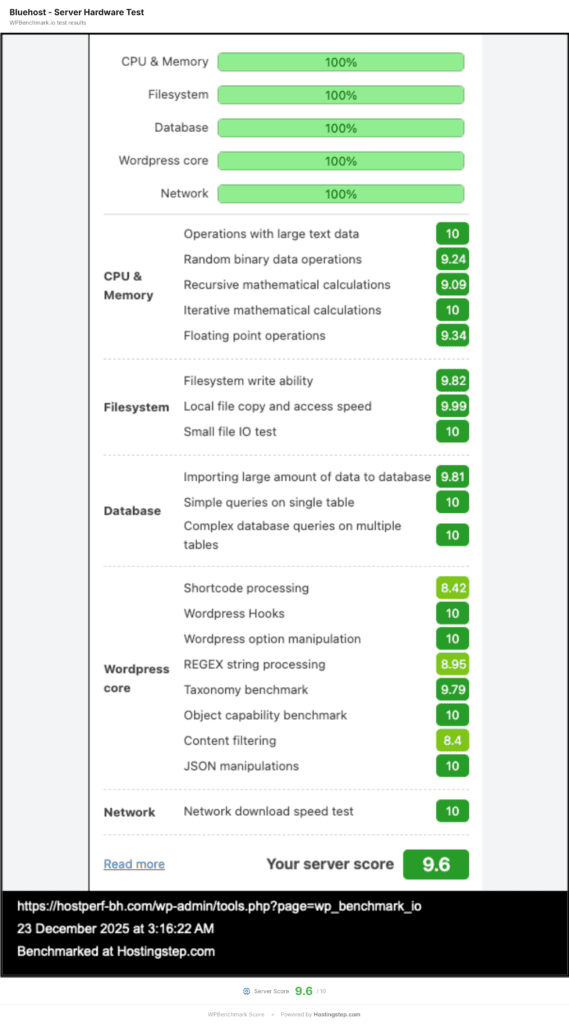
The WPBench test tests the host’s non-cached server resources such as CPU, RAM, and disk I/O with 21 individual sub tests across 5 categories, independent of web server software such as LiteSpeed or Apache or Nginx. A score of 9.6 out of 10 means Bluehost has excellent server hardware, which is advantageous for plugin heavy sites or WooCommerce stores or sites with complex database queries. The fact that Bluehost still records a 501 ms origin TTFB comes down to the absence of aggressive full-page caching on the Starter plan, not a hardware limitation.
Global TTFB
In our cached Global TTFB test across 40 locations, Bluehost recorded an average of 224 ms. The Americas averaged 169 ms, Europe 176 ms, and Asia Pacific 306 ms. This is another of Bluehost’s strong performance metrics.
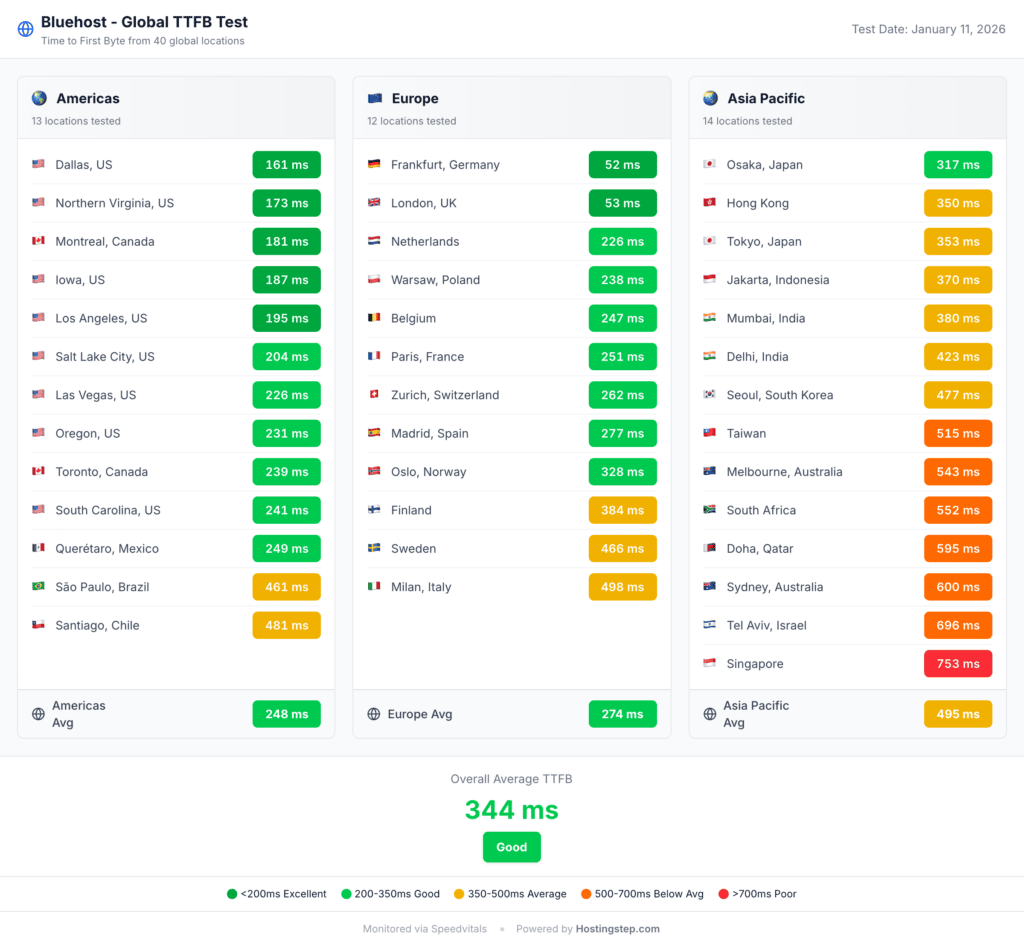
This is beneficial for sites that have audiences spread across the globe. Cached delivery is consistent between the Americas at 169 ms and Europe at 176 ms, with the Netherlands at 38 ms and Zurich at 48 ms as the fastest individual locations. Asia Pacific trails at 306 ms, though Singapore at 331 ms and Sydney at 307 ms both stay inside a usable range. That spread comes from the static CDN, not from server placement, since your site files live on whichever single data center you select at signup.
However, Bluehost uses a Static CDN and not edge caching. A static CDN delivers static assets instead of caching full page HTML at the edge. Even though a static CDN helps sites achieve strong global TTFB, it’s not as effective as an edge CDN, which delivers dynamic content. Hosts running edge CDNs post better global TTFB than Bluehost, such as WP Engine at 65 ms or GoDaddy Managed WordPress at 75 ms.
Bluehost vs Competitors
| Metric | Bluehost | Hostinger (Premium) | SiteGround | HostGator |
| TTFB | 501ms | 447ms | 745ms | 496ms |
| Uptime | 99.97% | 99.98% | 99.96% | 99.97% |
| Load Test (ms) | 41ms | 245ms | 170ms | 213ms |
| Load Test Error Rate | 0.00% | 0.00% | 0.00% | 2.00% |
| Global TTFB avg | 224ms | 404ms | 1,200ms | 427ms |
| WPBench | 9.6/10 | 7.4/10 | 8.4/10 | 9.6/10 |
| CDN Type | Static | None | Addon | Static |
| Email Hosting | Addon | Addon | Included | Addon |
| Backups | Weekly | Weekly | Daily | Daily |
| Intro Price | $1.99/mo | $2.69/mo | $2.99/mo | $3.75/mo |
| Renewal Price | $8.99/mo | $10.99/mo | $17.99/mo | $9.99/mo |
Bluehost vs Hostinger: Bluehost Wins on Global TTFB
Bluehost undercuts Hostinger Premium at $1.99 versus $2.69 intro, and again at renewal with $8.99 versus $10.99. Bluehost beats Hostinger on global TTFB with 224 ms versus 404 ms, and on load handling with 41 ms versus 245 ms, both at a 0% error rate. Hostinger holds a narrow edge on origin TTFB with 447 ms against 501 ms. Users looking for strong global performance and stronger server hardware should go with Bluehost, which also posts 9.6 on WPBench against Hostinger’s 7.4.
Visit Hostinger or grab an extra 10% off with our Hostinger coupon before signing up.
Bluehost vs SiteGround: Bluehost Wins in Almost All Metrics
Bluehost starts cheaper at $1.99 against $2.99, and the renewal gap is much wider at $8.99 versus $17.99. Bluehost beats SiteGround on origin TTFB with 501 ms versus 745 ms, and the global TTFB gap is severe at 224 ms versus 1,200 ms. Bluehost also handles load faster at 41 ms against 170 ms. SiteGround wins on daily backups and included email hosting.
Bluehost vs HostGator: Bluehost Wins on Global TTFB
Both Bluehost and HostGator record identical WPBench scores of 9.6 out of 10, and near-identical origin TTFB with 501 ms against 496 ms. The real difference shows in global TTFB, where Bluehost recorded 224 ms against HostGator’s 427 ms, and in load handling, where Bluehost returned 41 ms at a 0% error rate against 213 ms at 2.0%. Bluehost is also cheaper at both ends, $1.99 versus $3.75 intro and $8.99 versus $9.99 renewal, which leaves little reason to pick HostGator over it.
Pricing & Plans
Bluehost’s Starter plan starts at a promotional price of $1.99 per month. However, the host requires users to commit to 36 months with upfront payment to claim the offer. That will cost $71.64 ($1.99 x 36). The same plan renews at $8.99 per month, a 352% increase over the intro price. Renewing costs $107.88 per year ($8.99 x 12).
Bluehost’s Starter comes with 10 GB NVMe Storage, allowing you to host up to 10 websites and suitable for 40k visits per month. The host offers Free CDN, Free Site Migration Tool, and Free SSL-Let’s Encrypt. However, bear in mind that the free domain it offers will remain free only till the first year.
Bluehost also comes with good security comprising Free Malware Scanning, and DDoS Protection. Even though Bluehost offers free backups, it’s only limited to weekly backup and doesn’t offer daily backups.
Who Should Use Bluehost?
US based blogs with less than 50,000 monthly visitors can choose Bluehost, as the origin TTFB of 501 ms is sufficient for low traffic sites. The promotional price of $1.99 per month is also affordable for anyone just starting out. Sites with audiences spread across the Americas and Europe benefit from the static CDN, which delivered 169 ms and 176 ms cached TTFB respectively, with London at 190 ms and Frankfurt at 203 ms.
Sites that expect traffic spikes are also well served. Bluehost returned 41 ms at a 0% error rate when we ramped from 0 to 100 concurrent visitors, which places it alongside managed hosts costing ten times more.
Bluehost scored 9.6 out of 10 on WPBench, which reflects its strong raw server hardware capability. This makes the host ideal for sites that rely on complex plugin environments and database heavy operations. In fact, Bluehost will handle such sites better than its competitors at a similar price point.
First time users can benefit a lot from Bluehost since the host comes with built-in WordPress onboarding tools even on the Starter plan. Bluehost also offers excellent server hardware at such a low price point. Besides, the intro price is affordable at $1.99 per month. However, bear in mind the renewal price is $8.99 per month and if you are okay with this, only then go ahead with Bluehost.
Who Should NOT Use Bluehost?
Budget conscious users need to weigh the renewal carefully. Bluehost’s Starter plan jumps from $1.99 to $8.99 per month, a 352% increase, and the intro rate only applies if you prepay 36 months upfront. If you plan to stay past the first term, the effective cost is $107.88 per year, and hosts with flatter renewal curves will work out cheaper over three or four years.
Sites that depend on fast uncached responses should look elsewhere. Bluehost’s 501 ms origin TTFB sits above the 468 ms average across the providers we monitor, and the Starter plan does not run aggressive full-page caching. Logged-in traffic, dynamic pages, and cart or checkout requests bypass the CDN entirely, so they run at origin speed rather than the 224 ms cached figure.
Bluehost doesn’t offer daily backups and instead offers weekly backups alone. If you badly need daily backups for your site, you can look for hosts that offer daily backups. Even though there are many free WordPress plugins that can help you with it. However, if you are completely new to hosting, choosing the best web hosting provider like GreenGeeks or Hostinger Business that come with daily backups would be much more convenient for you.
Anyone who needs email on the same plan should also budget extra. Bluehost sells email hosting as a paid addon rather than including it, unlike SiteGround, which bundles it.
Our Verdict
Bluehost recorded 501 ms origin TTFB, 99.97% uptime, 224 ms cached global TTFB, and 41 ms load response at a 0% error rate across our eight-month window. We recommend it for sites serving the US and Europe, where cached delivery held at 169 ms and 176 ms. Bluehost is also a sound pick for anyone starting a small blog under a tight budget, with the Starter plan at $1.99 per month.
Asia Pacific audiences see slower delivery at 306 ms on average, with Doha at 414 ms and South Africa at 364 ms as the weakest locations, though Singapore at 331 ms and Sydney at 307 ms remain workable. Sites running heavy uncached or logged-in traffic should note that the 501 ms origin TTFB, not the cached figure, is what those requests will hit.
Bluehost pairs strong server hardware, clean load handling, and good cached global TTFB with a few real limitations: a 501 ms origin TTFB, weekly-only backups, and email sold as a paid addon. It suits budget-conscious bloggers and small business sites well. While the intro price looks attractive at $1.99 per month, bear in mind the renewal is 352% higher at $8.99 per month.
Methodology
All hosting accounts we use to conduct our tests are bought with our own funds (with invoices available for verification) and are not promotional or free press accounts. The tools we use for our methodolody testing comprise Pingdom for TTFB and Uptime, Loader.io for Load Testing, WPBenchmark for server hardware, and SpeedVitals for global TTFB. Every year, we conduct 525,600 tests for each provider. Besides, we consistently monitor each provider every 60 seconds 24/7.
We test our hosting providers in 40 cities across America, Europe and Asia Pacific. Our data period runs from October 1, 2025 to May 31, 2026, covering 243 days and 349,920 individual tests per provider. Our Bluehost data is available from 2021 onward. We test and keep a constant monitoring of 34 hosting providers. We test them using the standard test environment comprising a WordPress site with the Twenty Twenty four theme and identical plugins.