Pressable Review 2026
Pressable ranks #2 out of 34 hosting providers in our 2026 WordPress hosting rankings. It has secured a score of 8.38 out of 10. Pressable recorded an average TTFB of 341 ms, the fastest among any of the hosts and 100% uptime with 0 outages. It also scored 12 ms response time in the load test with 0 errors, again one of the fastest scores in the load test category.
We started monitoring Pressable in October 2025 using our standardised test setup and methodology. We bought our own hosting plan, installed a test site, and then put it into monitoring through several tools like Pingdom, Loader.io, SpeedVitals, and WP Benchmark. Over 31,000 individual tests have been performed to date in 2025.
Pressable is the managed WordPress hosting service provided by Automatic, the parent company behind WordPress.com, WooCommerce, and Jetpack. Pressable runs on the WP cloud infrastructure platform, the first exclusive platform designed for the WordPress ecosystem. It offers the service from 4 data center locations and 28 CDN locations. All the Pressable plan comes with Jetpack security, unlimited site migration, daily backups, 100% uptime SLA.
The performance of Pressable is elite, but they are not cheap. It starts at $25 per month with no big introductory discounts. It also has only four data center locations, and it does not include email hosting for free. This review breaks down exactly what Pressable excels at and where it falls short, and everything you just need to know whether you should get started with them or not.
Pressable Pros and Cons
Pressable Pros
- It offers the fastest TTFB in our entire testing cycle: 341ms average in Q4 2025 across 31,000+ tests.
- Perfect 100% uptime with 0 outages over 108 days of continuous monitoring.
- It handles load better than any other host, with just 12 ms response time with 0% error rate.
- There are no pricing tricks here. It just starts at $25 per month if you are going for monthly billing, or $20 per month if you are going for annual billing.
- It guarantees 100% uptime SLA through its free data center failover feature, the only host out of 34 hosts to offer this.
Pressable Cons
- Performance is top-notch, but pricing starts at $25 per month or $20.83 annually, with no free trial or big introductory discounts.
- Only four data center options are available: Los Angeles, Dallas, Ashburn, Virginia, and Amsterdam.
- No email hosting available. However, it supports Titan email as an add-on.
- No phone support on premium plans or on signature or premium plans. Only chat or ticket support.
- It has secured a benchmark server hardware test score of 6.7 part 10, which is right at the median score out of 34 hosts. However, they are not best suited for resource-hungry applications.
Pressable Performance Overview
| Metric | Result | Score | Rating | Field Context |
| TTFB (US) | 341ms | 10/10 | Excellent | #1 of 34 hosts |
| Uptime | 100.00% | 10/10 | Excellent | Tied #1 (5 hosts at 100%) |
| Load Test | 12ms / 0% errors | 10/10 | Excellent | #1 of 34 hosts (6 failed) |
| Global TTFB | 231ms | 10/10 | Excellent | #5 of 34 hosts |
| WPBench (Hardware) | 6.7/10 | 6.7/10 | Average | Field median: 6.6 |
| Performance Total | 5.83 | Elite | Highest of all 34 hosts |
Pressable scored 10/10 in 4 out of 5 performance tests, which we have done. WB bench is the only metric that the Pressable did not reach at the top and it has a circuit and score of 6.7, right at the median of 6.6 score of all 34 hosts. We will break down all the performance scores in the coming section.
TTFB Response Time
Pressable recorded an average TTFB of 341 ms in Q4 2025 out of 25,920 individual tests we have conducted using Pingdom. Our test site hosted on Pressable is pinged every 60 seconds, 24×7, 365 days a year.
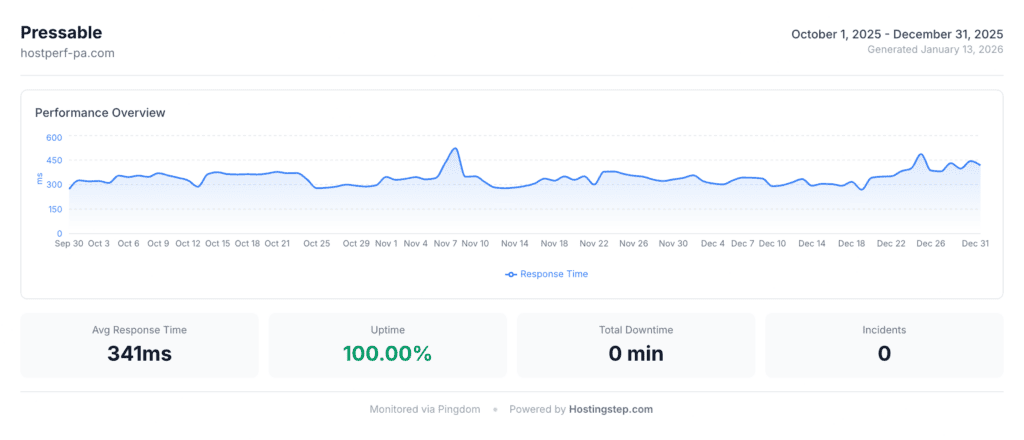
The median score of all 34 hosts is around 465 ms. And Pressable recorded a 341 ms, which is 124 ms faster than the medium score. In simple terms, the Pressable server starts responding to the request before most of the host begins processing the request. Out of 34 hosts, Pressable is the only host that has recorded a sub-350ms response time in Q4 2025.
Among the managed WordPress hosting companies, Pressable recorded at 341ms and the next comes WP Engine at 367ms. Rocket.net secured 380ms and Kinsta at 469ms.
During Q4 2025, Pressable recorded a minimum response time of 269 ms and a maximum of 523 ms across different days. The difference between these two variations is 254 ms. This indicates Pressable’s infrastructure is not just fast but consistent over time.
Pressable runs on WP cloud infrastructure, which they call WordPress first cloud hosting. The infrastructure is designed to host WordPress as a service with enterprise infrastructure that can scale up to billions of page views. Unlike other managed WordPress stores, which rely on 3rd party partners like Google Cloud, Cloudflare, etc, Pressable built its own infrastructure, including both the data center and edge locations, for optimized speed.
Uptime
Pressable recorded 100% uptime in Q4 2025 with 0 outages and 0 downtimes. While reading this post, we have collected 18 days of data in January 2026 and it turns out to be 100% Uptime.
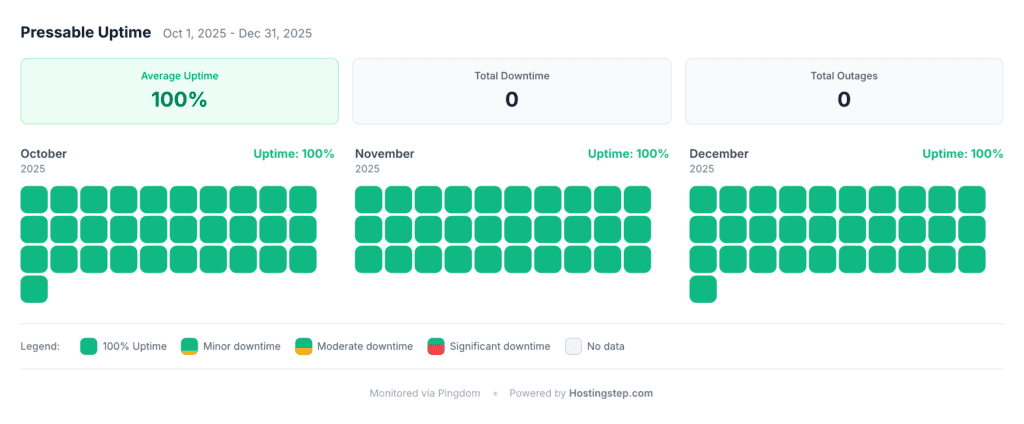
What sets Pressable apart from other managed hosts is its SLA backing. Pressable offers 100% Uptime guarantee with a refund for any downtimes except the scheduled maintenance windows. Many hosts offer 99.9% and 99.95% SLA guarantees and bury the compensation. However, Pressable’s 100% Uptime SLA guarantee is one of the most aggressive in the managed WordPress hosting space and our data also confirms the same.
Pressable is supported by a geo‑resident architecture with real‑time replication from the secondary data center. What it means is that your site files will be replicated across multiple data centers and if your primary data center goes down for any reason like group failure, discrete write failure, or individual node failure, then your site contents will still be live and it will be live from the secondary data center. This is not something you will get with shared hosting or even with managed WordPress hosting and it was available only on the enterprise plans of many hosting providers. However, Pressable bought this feature for just $20 per month.
Load Test
Rezabal’s load handling performance is tested using the Loader.io tool, where we send 0 to 100 concurrent users to the test site for a minute. The response time is calculated and a lower response time indicates faster server performance. Our test data shows Pressable responded to the load test with a 12ms response time and a 0% error rate. This is the best score on a load test we have ever gotten from a hosting company in the last 5 years.
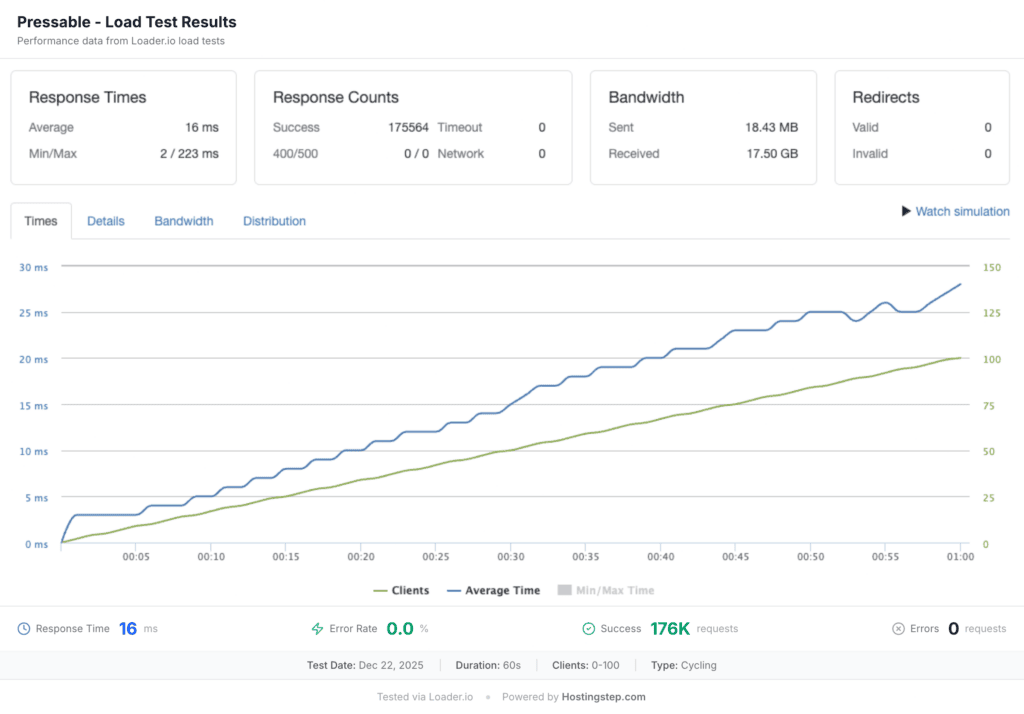
Pressable (12ms) outperformed every other managed WordPress host like WP Engine (27ms), Hostinger Business (31ms) and Kinsta (40ms). Pressable plans also include auto scaling in the future. So unlike shared hosting services or VPS hosting, which come with fixed server resources with hundreds of other sites hosted on the server, Pressable provides vertical scaling on a bare metal server with 100-plus CPU cores available for autoscaling. Pressable also promises they won’t shut off or throttle your site if you have exceeded the visitor limit. So, load handling will never be an issue.
Server Hardware Test
Pressables scored 6.7 out of 10 in our WP Benchmark server hardware test. The WP Benchmark plugin measures the raw server performance like CPU, memory, disk I/O speed and database operations. This test is independent of any caching layer, like CDN or a caching plugin-based optimization. It is just a snapshot of how your physical hardware performs for uncached requests.
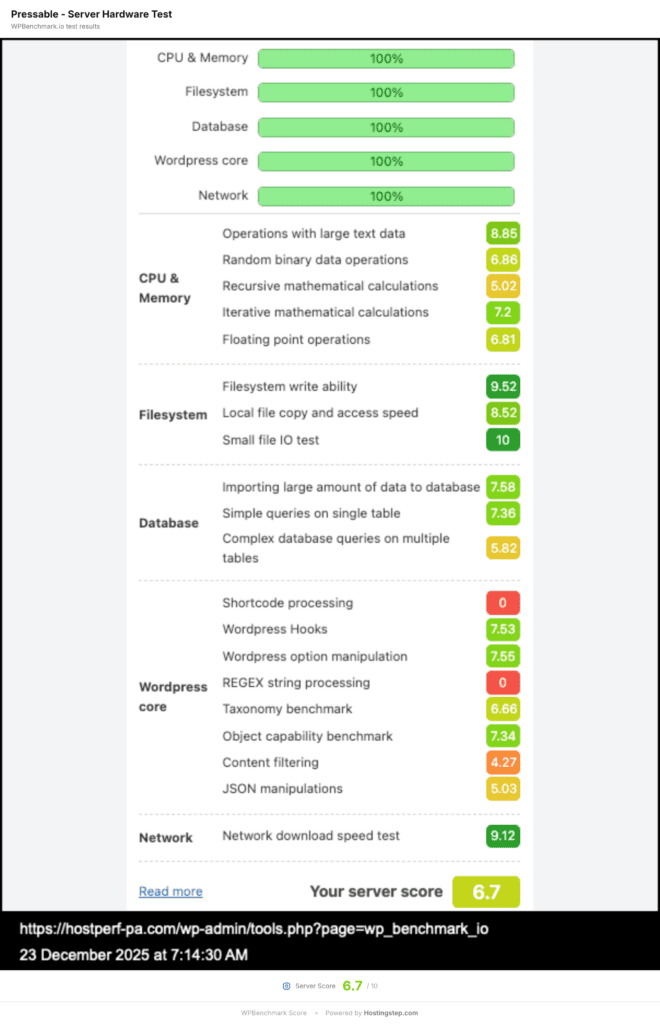
The median score of all 34 hosts is 6.6 and Pressable’s score is 6.7. The score is slightly above WP Engine (6.5) but below Kinsta (8.8) and Hostinger Business (7.4). Though Kinsta does not offer a fast response time, it has consistently performed well in the Server Hardware Test for the last 5 years.
For most of the common WordPress sites like blogs, business sites, portfolios and even standard WooCommerce stores, the 6.7 WP Benchmark scores are completely adequate. The WP benchmark score is critical for sites that have extremely complex database queries or sites with heavy plugins running uncached operations, or high-volume WooCommerce stores that have thousands of inventory items in real time. In those cases, Pressable might disappoint you.
Global TTFB
Pressable recorded 231 ms in our global TTFB performance test, measured from 40 global locations. If you are running a site expecting global visitors, particularly from the USA and Europe, then Pressable is a great choice.
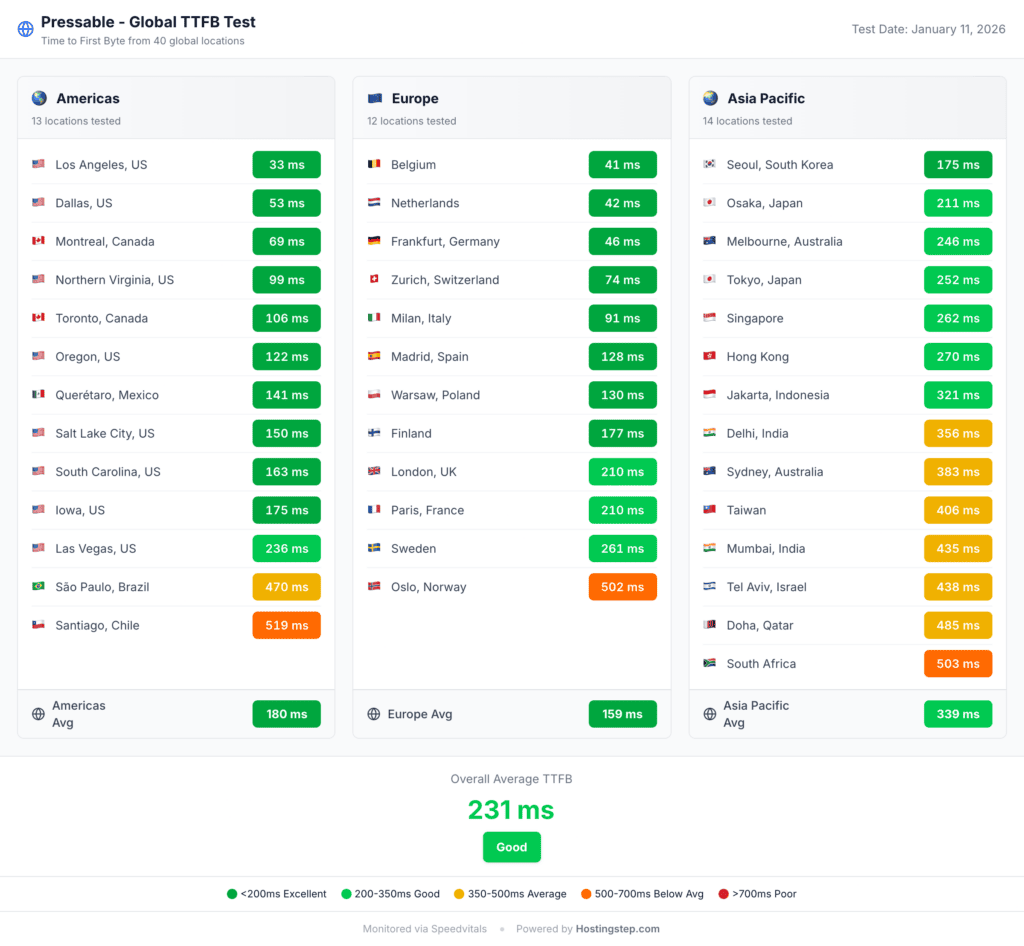
Pressable has four data center locations in Los Angeles, Dallas, Ashburn, Virginia and Amsterdam. The Origin servers are supported by 28 edge data center locations across 6 continents. Instead of just delivering static content, Pressable CDN stores complete page content across all 28 edge locations, which results in fast Global TTFB as the site contents get delivered from nearby edge locations instead of the origin server in the USA.
Pressable Vs Competitors
| Metric | Pressable | WP Engine | Kinsta | Rocket.net | Hostinger Biz |
| Rank | #2/34 | #6/34 | #13/34 | #29/34 | #5/34 |
| Score | 8.38 | 7.98 | 7.02 | 6.10 | 8.02 |
| Tier | Elite | Elite | Strong | Average | Strong |
| TTFB | 341ms | 367ms | 469ms | 380ms | 478ms |
| Uptime | 100.00% | 100.00% | 99.97% | 99.97% | 99.98% |
| Load Test | 12ms/0% | 27ms/0% | 40ms/0% | FAILED | 31ms/0% |
| Global TTFB | 231ms | 169ms | 416ms | 229ms | 223ms |
| WPBench | 6.7 | 6.5 | 8.8 | 7.5 | 7.4 |
| Perf Total | 5.83 | 5.67 | 4.92 | 4.00 | 5.12 |
| Intro Price | $25/mo | $23/mo | $30/mo | $25/mo | $3.69/mo |
| Renewal | $25/mo | $23/mo | $30/mo | $25/mo | $16.99/mo |
| Origins | 4 | 20+ | 27 | 20+ | 10+ |
| CDN | Edge (28+) | Edge | Edge | CF Enterprise | Static |
| Addon | None | None | None | Included |
Pressable Vs WP Engine: WP Engine is Pressable’s closest performing competitor. Both WP Engine and Pressable sit in the elite performance tier and both charge very similar prices. The difference comes down to margins.
Pressable outperforms WP Engine on TTFB (341ms vs 367ms), load testing (12ms vs 27ms) and overall performance score (5.83 vs 5.67). WP Engine outperforms Pressable in global TTFB (169ms vs 231ms) and the WP Bench scores are nearly identical, with Pressable scoring 6.7 and WP Engine scoring 6.5.
In terms of pricing, WP Engine starts at $35 per month while Pressable starts at $25 per month. Both offer steep introductory discounts with annual plans starting at $20.83 per month on Pressable and WP Engine on $27/month. The major difference is in the number of data center locations. While Pressable offers only 4 data center locations concentrated in the US and one in Amsterdam, WP Engine offers nearly 10 locations across America, Europe, Asia, the Pacific and Australia. So if you are outside of America and Europe, Engine is the best choice to get started. However, for businesses in America, Pressable might be a good choice now because of the affordable price to get started, but also marginally better performance than WP Engine.
Pressable Vs Kinsta: Pressable outperforms Kinsta across all performance metrics apart from WP Bench score. Pressable got an average TTFB of 341 ms while Kinsta secured 416 ms. Kinsta also had some downtime issues due to Cloudflare issues and it scored 99.97% in Q4 2025. While in the same time period, Pressable has got 100% uptime.
While Pressable excels at everything, Kinsta outperforms Pressable in the WP Benchmark score. It has got a score of 8.8, which is significantly better than Pressable’s 6.7 score, indicating Kinsta is better for resource-hungry sites. If you are running a resource-hungry site with heavy database operations or managing heavy uncatchable requests, or for big WooCommerce sites where Edge caching CDN won’t be available, then Kinsta should be your choice.
Kinsta allows you to get started for $0 per month for the first month and then it charges $35 per month. The Pressable plan starts at $25 per month on a monthly billing and for an annual plan, it goes down to $20.83 per month.
Pressable Vs Rocket.net: Pressable outperforms Rocket.net across TTFB and Uptime test. We don’t have data for Rocket.net load testing, as their security is blocked and we are unable to test them. The global TTFB score of both hosts is very similar, even though the underlying infrastructure is different, where Pressable uses its own CDN, while Rocket.net uses Cloudflare. Again, Rocket.net performs well in WP Benchmark score with 7.5, while Pressable has a 6.7 score. Since we don’t have load testing data, we are not sure how the load test works at Rocket.net. Hence, we don’t recommend them and if you are looking for a host between these two, Pressable is our choice.
Pressable Vs Hostinger: We have compared the Pressable and Hostinger business plans. While Hostinger’s business plan starts at $3.69 per month and Pressable starts at $25 per month, it won’t look like an apples-to-apples comparison. However, the annual price of Hostinger’s business is around $16.99 per month and many people are searching for this comparison. Hence, we decided to compare them.
Pressable outperforms Hostinger in TTFB (341ms vs 478ms), uptime (100% vs 99.98%), load handling (12ms vs 31ms) and similar scores at global TTFB performance (231ms vs 223ms). Hostinger completely outperforms Pressable in WPBN score with 7.4, while Pressable has 6.7. Hostinger Business Plan also allows you to host up to 25 websites, while you get only one website hosting on the Pressable Starter Plan. Hence, the difference is much clearer. If you are looking for a shared hosting architecture to host multiple websites with CDN support, then Hostinger should be your choice. However, if you are looking to host your single website on the top-tier performance, then Pressable should be your choice. Also, Hostinger offers you up to 13 data center locations against Pressable’s 4 locations.
Pressable Pricing
Pressable uses clear, flat, transparent pricing. There are no steep discounts, no surprise renewal prices, or even a long-term commitment to get started.
| Plan | Monthly | Annual | Sites | Visits/mo | Storage | Included |
| Signature 1 | $25 | $20.83 | 1 | 30K | 20GB | Jetpack Security, CDN, Staging |
| Signature 2 | $45 | $37.50 | 3 | 50K | 30GB | Same + more sites |
| Signature 3 | $60 | $50.00 | 5 | 75K | 35GB | Same + more sites |
| Signature 4 | $90 | $75.00 | 10 | 150K | 50GB | Same + more sites |
| Signature 5 | $155 | $129.17 | 20 | 400K | 80GB | Same + more sites |
| Signature 6 | $350 | $291.67 | 50 | 1M | 200GB | Same + more sites |
| Signature 7 | $545 | $454.17 | 80 | 1.6M | 275GB | Same + more sites |
| Signature 8 | $675 | $562.50 | 100 | 2M | 325GB | Same + more sites |
All the Pressable plan includes Jetpack Security, automatic daily backups, staging environment, sandbox sites and unlimited free migrations. The free CDN is applied to any number of sites that are present in your plan and it is not only for the primary site. It includes a 30‑day money‑back guarantee. You can test them and if you are not satisfied, then you can get a refund with no questions asked.
Who Should Use Pressable
WordPress sites in the US and Europe that want top-tier performance. Pressable’s 341ms TTFB and sub-200ms global TTFB in America and Europe make it one of the fastest options available in this geographical location.
Business websites and WooCommerce stores require 100% uptime. Pressable is one of the top hosts to offer 100% uptime SLA with secondary data center support. Our independent data also claims the 100% uptime across our 180 days of testing, making it a strong choice for revenue generating websites where uptime matters more than money.
Sites expecting traffic spikes. If you are running a news website or frequent campaigns, then Pressable’s 12ms load response time, which is the fastest among any host and the autoscaling feature with 100-plus CPU cores available to scale up your site, is a deal breaker.
Who Shouldn’t use Pressable?
Budget conscious websites: If you are just getting started with a website that has got no traffic and expecting to grow, then Pressable’s $25 per month is an overkill. This is not an entry point. We recommend hosts for your sites that are just getting started. There are multiple options like WordPress.com, Hostinger and GreenGeeks, which are available for less than $5 per month with similar performance.
Sites Targeting Asia-pacific or Australian Audience: Pressable is great with edge caching. However, they don’t provide data center options in Asia-pacific or Australian locations.
So if you are hosting a site here and your target audience is located closer to this region, then Pressable might disappoint you. Though it’s not bad to use Pressable here, you can find better options with WP Engine, as you can get a closer data center here and also global edge caching CDN can be used for faster load times.
Our Verdict
Pressable delivers the most alert performance among any of the 34 hosting providers that we have tested. The performance numbers are not subjective. It has a 344 ms TTFB, which is fastest, a 12 ms load test, which is fastest and 100% uptime and a global TTFB of 231 ms, all backed by 31,000 independent tests conducted in the last 108 days of continuous monitoring.
| Component | Score | Weight |
| Performance Total | 5.83 (Elite) | 60% |
| Features Total | 8.5/10 | 30% |
| Value Score | 1/10 | 10% |
| FINAL SCORE | 8.38/10 | Rank #2 of 34 |
Our scoring methodology weights 1 power 10 for any host that is priced at about $25 per month in order to have a balanced ranking, which includes both shared VPS and premium managed hosts. Hence, the value score of 1/10 is not a flaw of Pressable, but it’s because of our methodology.
Here is my final and simple recommendation for Pressable. If you have outgrown shared hosting and decided to go with managed WordPress hosting and you have a target audience in America and Europe, go with Pressable. You will get the allied level of Performance, support and pricing. If you are reading this post and looking to host your site in the Asia Pacific or Australian region, then go with WP Engine. This is the second best choice.

Mohan Raj is the founder of Hostingstep.com, where he oversees the independent testing of 25+ web hosting providers. He conducts 525,600+ performance tests per year across 60+ global locations to measure TTFB speed, uptime, load test, core web vitals, and hardware benchmarks. Each provider is tested using independently purchased hosting accounts, backed by verifiable data.