WordPress.com Review 2026
WordPress.com is the managed WordPress hosting platform from Automattic, the parent company behind the WordPress CMS. The company reached out to me to test their hosting services. Initially, I was sceptical about testing them because there are certain restrictions on WordPress.com hosting plans when compared to regular hosting services like BlueHost, Hostinger, etc.
But then I looked into their WordPress.com sales page and noticed they went through a major upgrade, with many restrictions removed. The company spokesperson also confirmed to me the changes made and their unique set of features. Now, their hosting plan just works like how you can get a service from third-party hosting providers.
Then, I have decided to test it out based on the HostingStep methodology. Back in July 2025, I bought their hosting plan (personal plan) and developed the site following our standardised setup, which we use across all other 25+ hosting providers, and made the site live. Then I put that site into 24/7, 365 days of monitoring through our testing tools. Now we have got over nearly 6 months of data, and our review will be based on the current data, and by the next quarter, we will update the post with more data.
Performance overview:
WordPress.com achieves an elite score across all the primary performance metrics, which is a rare achievement in our benchmarks when a single hosting company outperforms all other providers across all tests. WordPress.com gives tough competition to many premium managed hosting services, given their performance is very similar to WordPress.com, but here WordPress.com is available at 1/4th of their price.
TTFB Response Time
WordPress.com has achieved an average response time of 357ms in the last quarter, Q4 of 2025. The Average Response Time, which we also call speed or Time To First Byte (TTFB), is something that measures how quickly the server responds to the request of a visitor. The faster the response time indicates faster the hosting. To collect the average response time, we use the Pingdom synthetic monitoring tool through which the WordPress.com test site will be pinged from 15 different locations in the North American region, and the average response time is calculated every 60 seconds. We run over 1440 tests a day, which translates to 43,800 tests a month, 131,400 tests per quarter, and 525,600 tests a year.
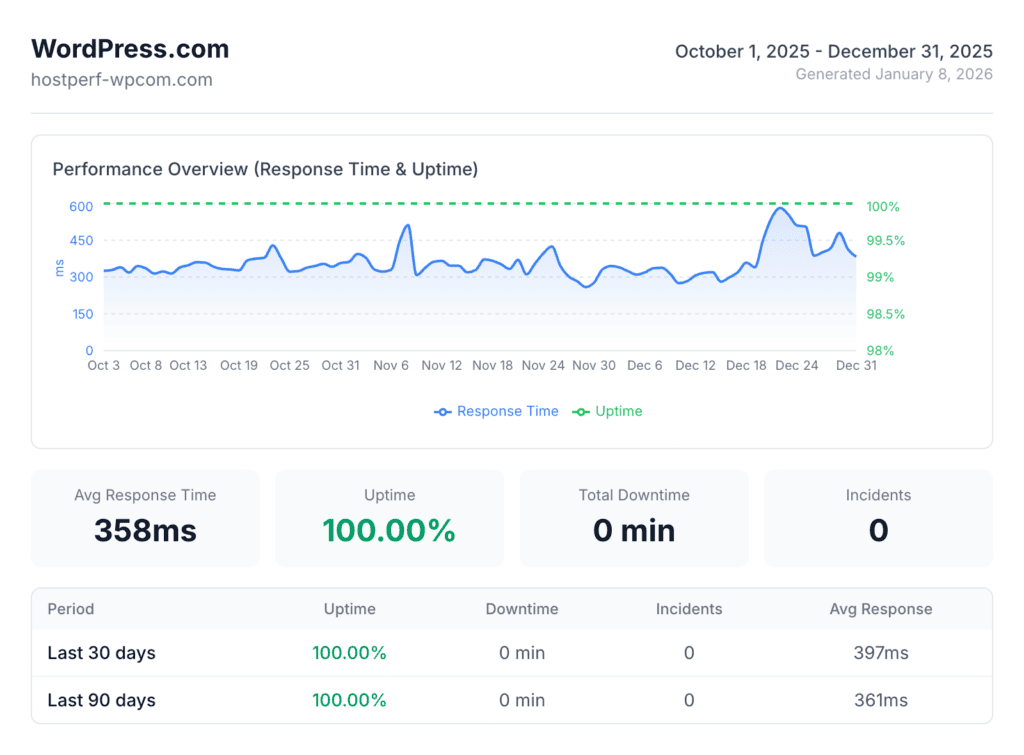
The 357ms average response time places WordPress.com in the “Elite” tier (<400ms) along with premium managed hosts like Pressable (341ms) and WP Engine (367ms); the only difference is that WordPress.com was available at 1/4th of their price.
Uptime Analysis
WordPress.com excels with 100% uptime availability and zero downtimes during our entire testing period. It guanratee 99.999% uptime SLA, which is ~100% uptime. The uptime is tested using the Pingdom tool, where the WordPress.com test site is pinged every 60 seconds from 15 locations. We set the threshold time to 30 seconds and if the site is down post that, a downtime is recorded.
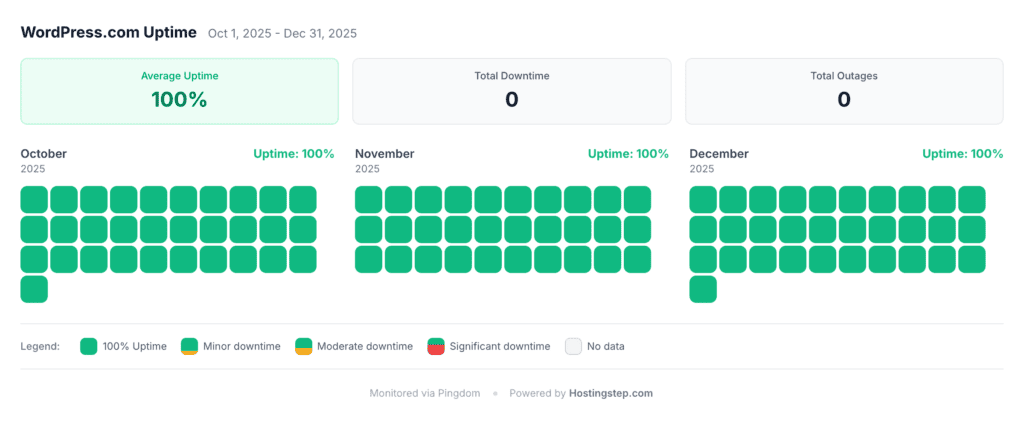
Perfect Reliability: WordPress.com 100% uptime scores place it among the elite group of hosts. Pressable, WP Engine, Templ, and EasyWP are the only other hosts that have secured 100% uptime in Q4 2025.
Load Testing
WordPress.com recorded an average 16ms response time in our load testing. The score again lands them in the “Elite” tier. Load test reveals how the servers handle the traffic pressure. We use Loader.io to send 100 concurrent visitors to the site and WordPress.com conveniently handles the load with no volatility as seen from the graph.
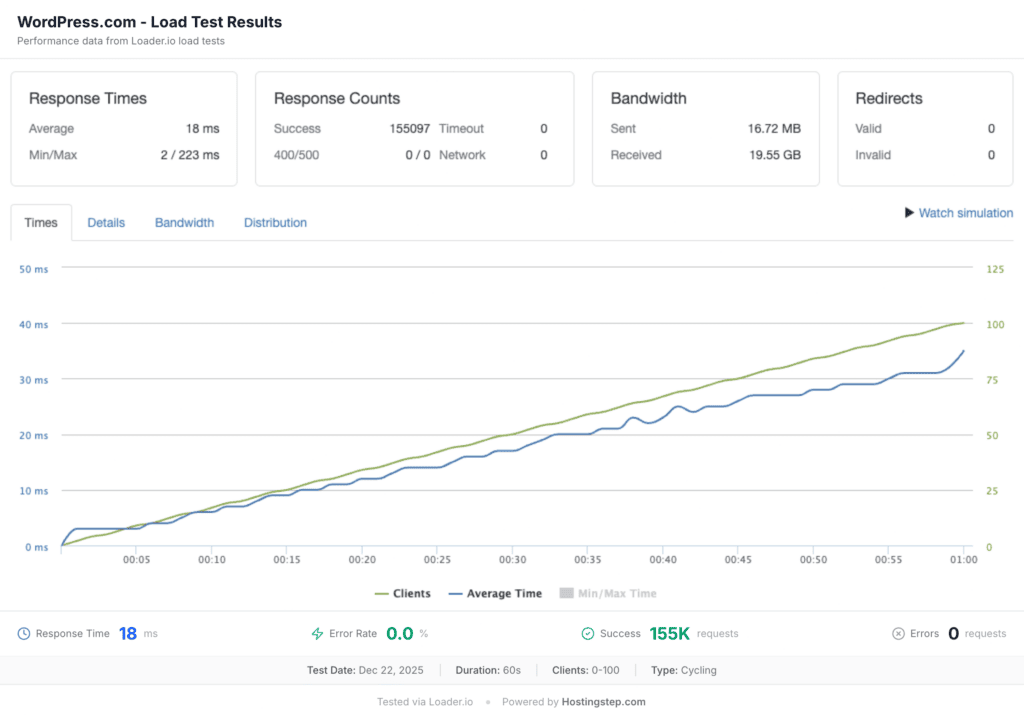
Exceptional Load Handling: WordPress.com’s 16ms response time is the fastest I’ve witnessed among any of the shared hosting companies. Thanks to inhouse developed edge caching CDN, WordPress.com handles the traffic spikes without any issues. Only Pressable (12ms) performed better.
Global TTFB
WordPress.com recorded an average global TTFB of 208ms, tested from 40 global locations. It is the best ever score I’ve recorded among any of the companies. If your site receives global traffic, these results are super helpful to determine how quickly your global visitors see your site. Due to its superior edge caching, both the visitors from America and Europe see similar load speed, despite our test site being hosted in a USA datacenter. The Asia-Pacific speed is also less than 400ms in most locations. Based on the data, I strongly recommend WordPress.com for sites with global visitors.
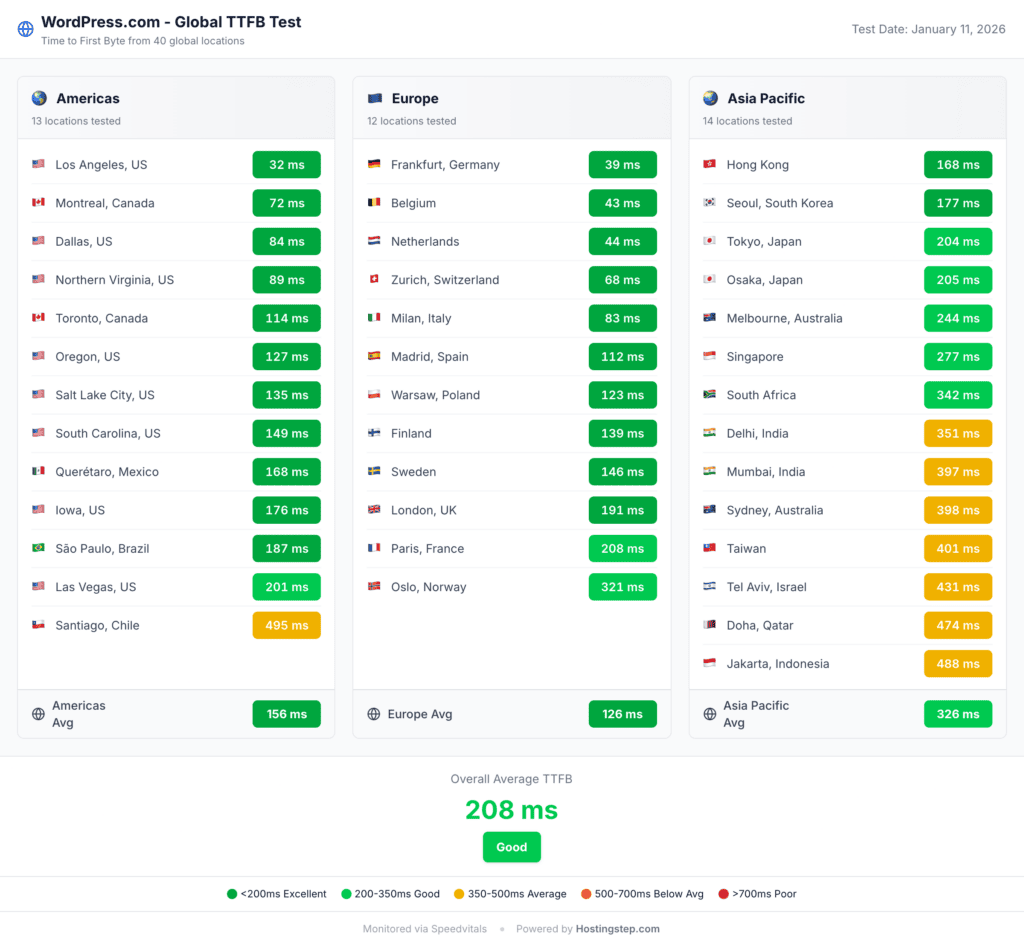
Summary: WordPress.com utilizes WP Cloud, the native cloud infrastructure developed exclusively for WordPress sites. While most other hosts utilize Cloudflare for edge caching, WordPress.com uses its own in-built CDN network, which offers the ultimate faster performance than any 3rd party services like Cloudflare.
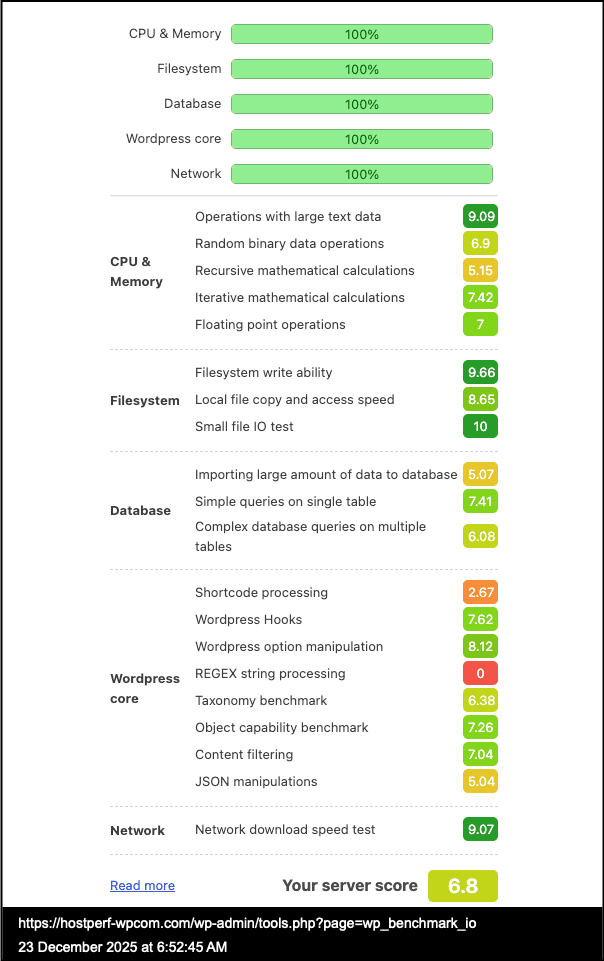
Server Hardware (WPBench)
WordPress.com recorded a server hardware score of 6.8, landing in the “strong” tier. This is the only metric where WordPress.com didn’t land in Elite tier but the strong tier itself a good performance considering most of the shared hosts scores below 5.0 due to shared server resources. Using this plugin, we are performing 21 individual tests across CPU, memory, filesystem, database and WordPress core operations.
WordPress.com Vs Competitors
In this section, let’s compare WordPress.com with its popular alternatives.
| Host | TTFB | Uptime | Load Test | Global TTFB | WPBench | Price |
|---|---|---|---|---|---|---|
| WordPress.com | 357ms | 100% | 16ms | 208ms | 6.8 | $2.75 |
| Bluehost | 520ms | 99.95% | 170ms* | 345ms | 9.6 | $3.99 |
| SiteGround | 632ms | 99.97% | 170ms | 833ms | 8.4 | $2.99 |
| Hostinger | 478ms | 99.98% | 31ms | 223ms | 7.4 | $2.69 |
| WP Engine | 367ms | 100% | 27ms | 169ms | 6.5 | $23.00 |
*Bluehost recorded 9% error rate under load. All other hosts: 0% error rate.
Let’s get started with the TTFB. WordPress.com records a 357ms response time, the fastest among any of the hosts, and the next closest is WP Engine, which scores at 367 ms, but you can notice a huge price difference between these two hosts. Again, in terms of uptime, both WordPress.com and WP Engine are 100% perfect. The rest of the host has less than 100% uptime. If you look closely, WP Engine is a managed WordPress hosting provider, so it provides 100% uptime most of the time. But most of the shared hosts are prone to downtime. WordPress.com, a shared hosting service, provides 100% uptime, which is worth noting. Again, in terms of load test, WordPress.com outperforms every other hosting company, including WP Engine. The main difference here is that WordPress.com uses its own edge caching technology, while WP Engine uses the Cloudflare Enterprise CDN with edge caching.
Again, in terms of global TTFB, WordPress.com loads better than most other hosts, and the WPBench score is one of the areas where WordPress.com lags behind the rest of the hosts. However, given the 25+ hosting companies we have tested, any host with a 5+ score is still the best. Only a handful of hosts have generated this kind of score (i.e., the 6+ score), so I think WordPress looks good here too. Again, WordPress.com is $2.75/month, and the renewal price is the same. However, for the rest of the hosts, note that the price mentioned is for introductory pricing, and renewal pricing will vary based on the plan you choose.
Final Verdict
WordPress.com has completely surprised me with its performance. WP Cloud is one of the new native cloud infrastructures for WordPress-based sites developed by the Automattic team. The team has used the same technology for this WordPress.com version. That’s what makes the difference here and shows that WordPress.com is better than other hosts.
Choose WordPress.com if you want the best performance for the price. It has got the best response time, uptime, load handling, WBBench score, and even a faster global TTFB. Even if you have global visitors, WordPress.com is the best host you can get for $2.75 per month, with the same renewal price. There is also a unique feature: no traffic limit on any plan. WordPress.com won’t stop your website when you hit any traffic limits.
Consider alternatives when you need complete control over your plan. For example, the personal and premium plans don’t provide you with developer features like SFTP/SSH, WP-CLI, Git commands, and GitHub Deployments tools. You can just get a plan, log in to a site and use it. There will be a hosting control panel within your WordPress dashboard. You won’t get cPanel like dashboard to manage advanced features. To gain full control, you need to choose the business plan, which costs $17.50 per month. If you are thinking of WordPress.com as a shared hosting service similar to Bluehost and Siteground, and planning to use it with all these advanced developer features, you will be disappointed.
I believe WordPress.com’s personal and premium plans are best suited for bloggers and small business owners. You will get:
- A free domain
- Unlimited number of pages, posts, and visitors
- Access to all the premium themes and plugins
- Install any kind of premium plugins
The business plan is the ultimate plan where you can get the complete features, including the developer features like SFTP access and more.
If you like the performance of WordPress.com but are put off by the limitations on the personal and premium plans, then the next best option is Hostinger. It costs the same as WordPress.com but includes all the developer features. WP Engine is nearly as fast as WordPress.com, but it’s more of a managed WordPress source, causing similar issues to the WordPress.com business plan. Ideally, I would like to recommend a shared hosting service. Out of the shared hosting services, Hostinger is the best across all the performance metrics, and literally, there is no restriction on its even on its starter plan.

Mohan Raj is the founder of Hostingstep.com, where he oversees the independent testing of 25+ web hosting providers. He conducts 525,600+ performance tests per year across 60+ global locations to measure TTFB speed, uptime, load test, core web vitals, and hardware benchmarks. Each provider is tested using independently purchased hosting accounts, backed by verifiable data.