25+ Core Web Vitals Study and Statistics 2025
This is a complete list of up-to-date Core Web Vitals Statistics. Core Web Vitals have become a new standard for web performance; our stats will give you solid information on how Core Web Vitals are progressing from 2021 to 2025.
Jan 2020 – Nov 2025 · HTTP Archive Report
Core Web Vitals: WordPress & CMS Performance
3 million+ origins analyzed across 30 platforms
| Metric | Desktop | Mobile | Gap | Trend |
|---|---|---|---|---|
| LCP (Loading Speed) | 67% Good | 54% Good | -13% | ↑ +1.52% |
| CLS (Visual Stability) | 71% Good | 84% Good | +13% | — |
| INP (Interactivity) | 98% Good | 88% Good | -10% | ↑ +1.15% |
| FCP (First Paint) | 58% Good | 41% Good | -17% | ↑ +1.75% |
| TTFB (Server Response) | 32% Good | 23% Good | -9% | — |
| Platform | Desktop CWV | Mobile CWV | Good TTFB |
|---|---|---|---|
| Wix | 82% | 74% | 65% |
| Webflow | 79% | 67% | 72% |
| Shopify | 78% | 77% | 95% |
| Squarespace | 70% | 70% | 94% |
| Drupal | 64% | 63% | 58% |
| WordPress | 50% | 46% | 32% |
| Magento | 40% | 41% | 19% |
Summary of Core Web Vitals Study
The CrUX publishes monthly Core Web Vitals stats based on the origins of 1 million+ websites. The stats below are based on those 1 million+ websites.
- As of November 2025, WordPress has achieved 50% good Core Web Vitals scores on desktops, based on an analysis of 3,087,534 origins with mobile clients. For the mobile, the Core Web Vitals score is 46% good. (httparchive)
- The overall CWV passing rate across all WordPress sites has improved from 28.31% to 36.44% (+8.13%) on mobile devices and from 32.55% to 40.80% (+8.25%) on desktop devices. (Source – WordPress.org)
- Overall, only 21.98% of origins have met Core Web Vitals by achieving good scores for Largest Contentful Paint (LCP), First Input Delay (FID), and Cumulative Layout Shift (CLS).
- Out of a million sites, 47.99% of origins had a good Largest Contentful Score.
- First Input Delay is easily passed, as 89.46% of origins had a good First Input Delay (FID) score.
- Only 45.99% of origins had a good Cumulative Layout Shift (CLS) score.
- In the top 1k origins, 70.4% of pages have a good Largest Contentful Paint (LCP) score on Desktop devices, while only 60.1% of the pages have a good LCP score on mobile devices.
- In the United States, only 53.7% of origins have a good LCP score, considering the top 1,000 origins across all form factors, including desktop and mobile.
- Korea (39.3%) had the highest number of origins that passed Core Web Vitals.
- Based on our real-time case study, the Managed WordPress Hosting services provide better Core Web Vitals scores than Shared hosting.
- The use of a CDN significantly improves the overall Core Web Vitals score.
- 24% of top URLs in the USA finance niche would boost rankings, while only less than 5% of URLs will get a ranking boost in the Education niche.
- In retail sites, almost none of the ranking URLs will get a ranking boost, while 13% of top URLs in B2B niches will get a boost.
- In the United Kingdom, 29% of sites do not meet Core Web Vitals.
- LCP of 70% of all UK search results is good in Largest Contentful Paint. In the case of FID, 90% of the pages are already good.
- The LCP scores of UK-based sites improve month by month, with the overall LCP score increasing from 73% to 75%.
- Pages ranking at position 1 were 10% more likely to pass CWV scores than URLs in position 9.
- Jimdo is the fastest CMS, according to Core Web Vitals scores. Wix is the slowest CMS.
- The WordPress 10.1 update includes features that improve Core Web Vitals scores.
Largest Contentful Paint Statistics
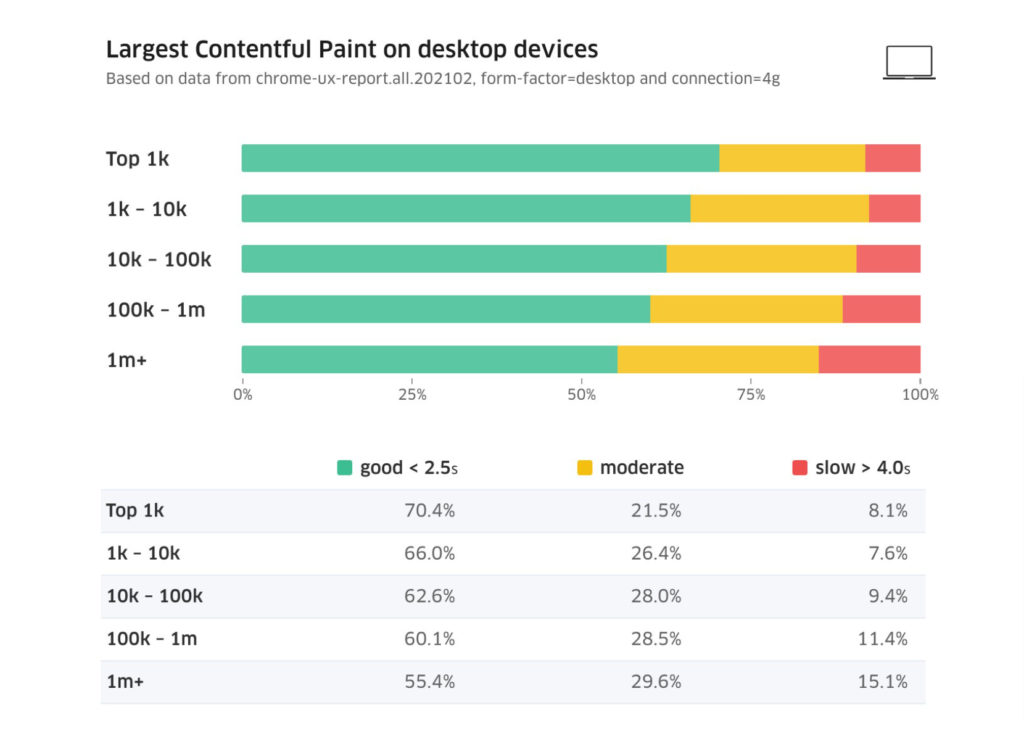
The stats below are based on the domain popularity of over 1 million websites. The stats below are based on desktop devices.
- Among the top 1000 sites, 70.4% of pages received a Good score on LCP (<2.5s). 21.5% of pages got a moderate score, i.e., needs improvement, and 8.1% of pages are slower (poor)
- Between 1k – 20k sites, 66% of pages are good, 26.4% pages need improvement, and 7.6% pages are poor.
- Between 10k – 100k sites, 62.6% of pages are good, where 28.5% pages need improvement and 9.4% pages are poor.
- Between 100k – 1m sites, 60.1% of pages have good LCP, where 28.5% of the pages are moderate, and 11.4% of the sites are slow (LCP greater than 4.0 seconds)
- Considering the 1,000,000+ sites, only 55.4% of URLs are good, 29.6% are moderate, and 15.1% are slow.
The Largest Contentful Paint on Phone devices is
- In the top 1000 sites, 60.1% of pages secured a Good score in LCP (<2.5s). The 27.3% pages got a moderate score, i.e., needs improvement, and 12.7% pages are slower (poor)
- Between 1k – 20k sites, 53.7% of pages are good, 32.7% pages need improvement, and 13.5% pages are poor.
- Between 10k – 100k sites, 51.3% of pages are good, where 34.3% pages need improvement and 14.5% pages are poor.
- Between 100k – 1m sites, 49.0 of % pages have good LCP, where 35.0% of the pages are moderate, and 15.9% of the sites are slow (LCP greater than 4.0 seconds)
- Considering the 1 million+ sites, only 42.7% URLs are good, 36.0% are moderat,e and 21.3% pages are slower.
Largest Contentful Data based on country:
Only 28.4% of the global top 1000 origins got a passing score in Core Web Vitals. In the USA, only 22.7% of the top 1000 origins have a CWV score.
Countries with poor internet connections suffer a lot. In Nigeria, only 9.1% of the origins have passed the CWV.
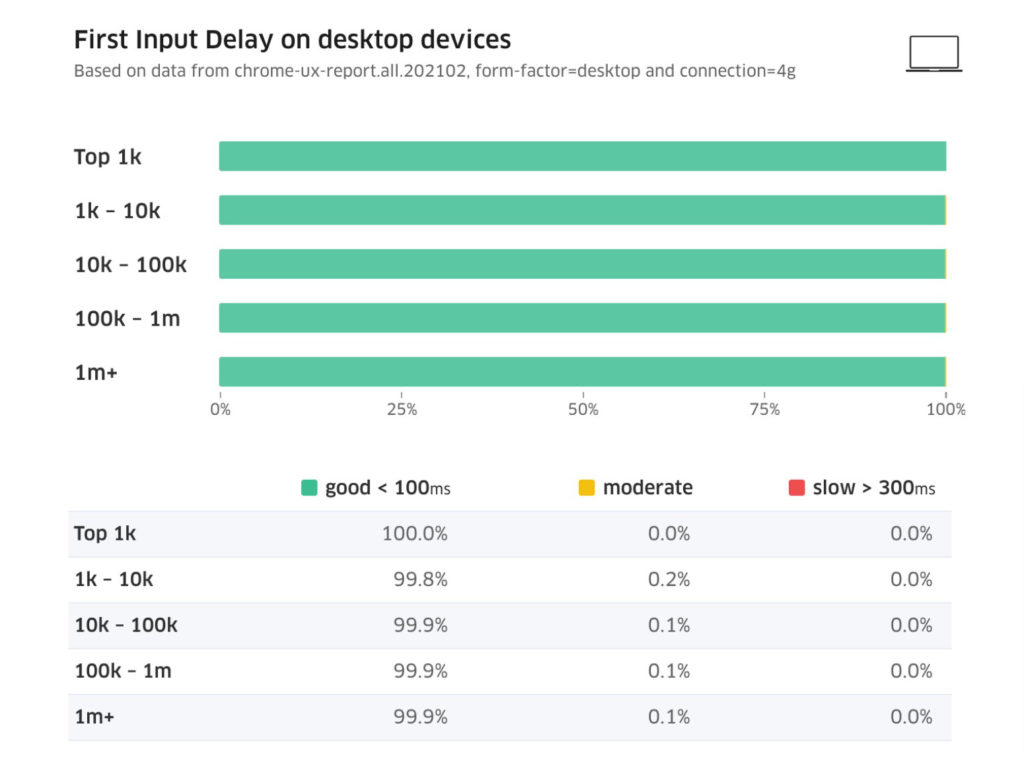
First Input Delay Statistics
First Input Delay is an easily attainable score, and 100% of the top 100 origins have good scores. In the case of 1k-10k origins, 99.8% have a good score. These stats are based on the data with form factor as desktop and connection as 4G.
However, the mobile scores tell us a different story. Only 87.4% of origins have a good FID score of less than 100 ms. If you consider the 100k – 1m, only 79.4% of origins have a good score.
Cumulative Layout Shift Statistics
Most sites struggle to get a passing score in Cumulative Layout Shift. Considering the form factor as Phone and connection as “4G”, only 40.9% of the Top 1k origins have a good CLS score, while 35.9% of pages have a slow CLS score.
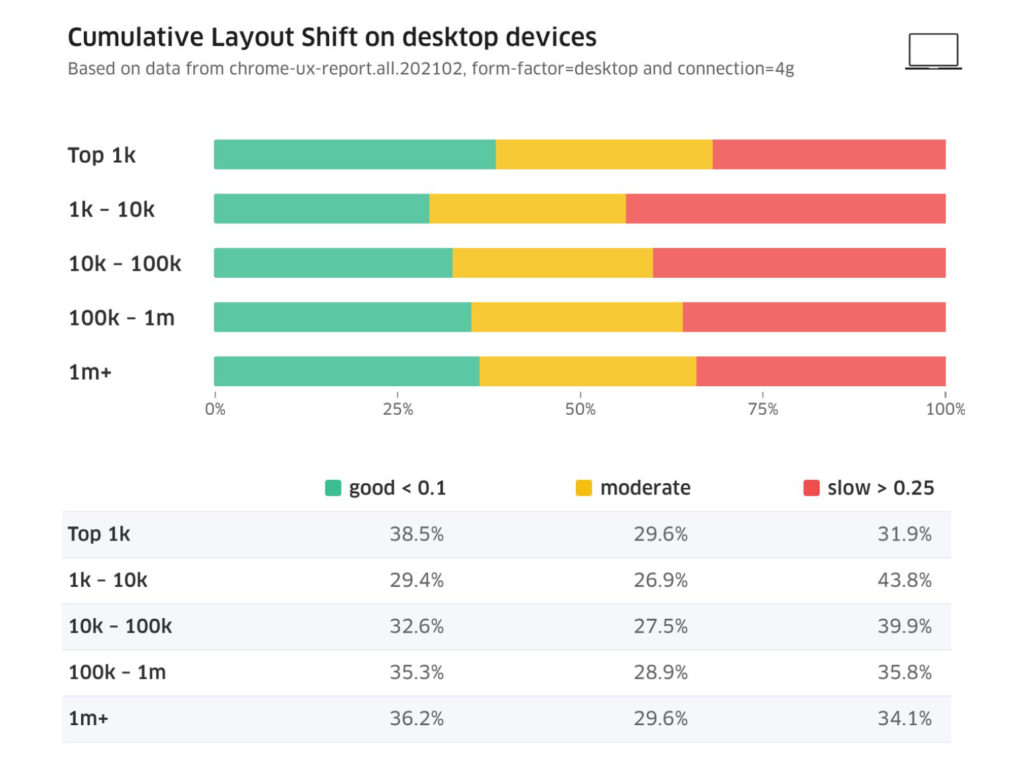
The scores are even worse on a desktop with 4 G connections. Only 38.5% of the top 1k origins have a good CLS score, while 31.9% have poor scores. In the case of 1million+ sites, only 36.2% of the sites have an excellent CLS score.
How to pass Core Web Vitals?
Core Web Vitals is the latest screening process that websites have to achieve a higher ranking in Google search.
It will officially be active by May 2021, and every website will get ranked either “Good,” “Needs Improvement,” or “Poor.” All this is done by analyzing the CRUX reports’ data (Chrome User Experience Reports).
Google launched core web vitals after conducting in-depth research on the industry. It was seen that users are inclined towards sites that offer them a better user experience. Keeping the results in mind, Google came up with three metrics that every website has to go through, and these are:
- Largest Contentful Point (LCP): It is the aggregate of time a page takes to render itself and load all typical elements like images, videos, or large block text. The LCP should load at least 75% within 2.5 seconds. I’ve written a detailed guide on Largest Contentful Paint WordPress, which helps anyone achieve a good score without the need of developers.
- First Input Delay (FID): This metric focuses on the interactivity of your page. It measures your website’s total time to respond after the user has clicked on a link. The ideal FID should be less than 100 milliseconds.
- Cumulative Layout Shift (CLS): This focuses on how much your page layout shifts in the process of loading. It is measured in either 0 (no shifting) or 1 (most shifting). The pages should score less than 0.1 seconds to qualify for the CLS metric.
Core Web Vitals Case Studies
Tokopedia is among the largest e-commerce companies in Indonesia. The page has over 50M+ monthly page views.
According to the latest Google algorithm, the company has revamped its website and has achieved 35% more Click Through Rate (CTR) with an 8% increase in conversions.
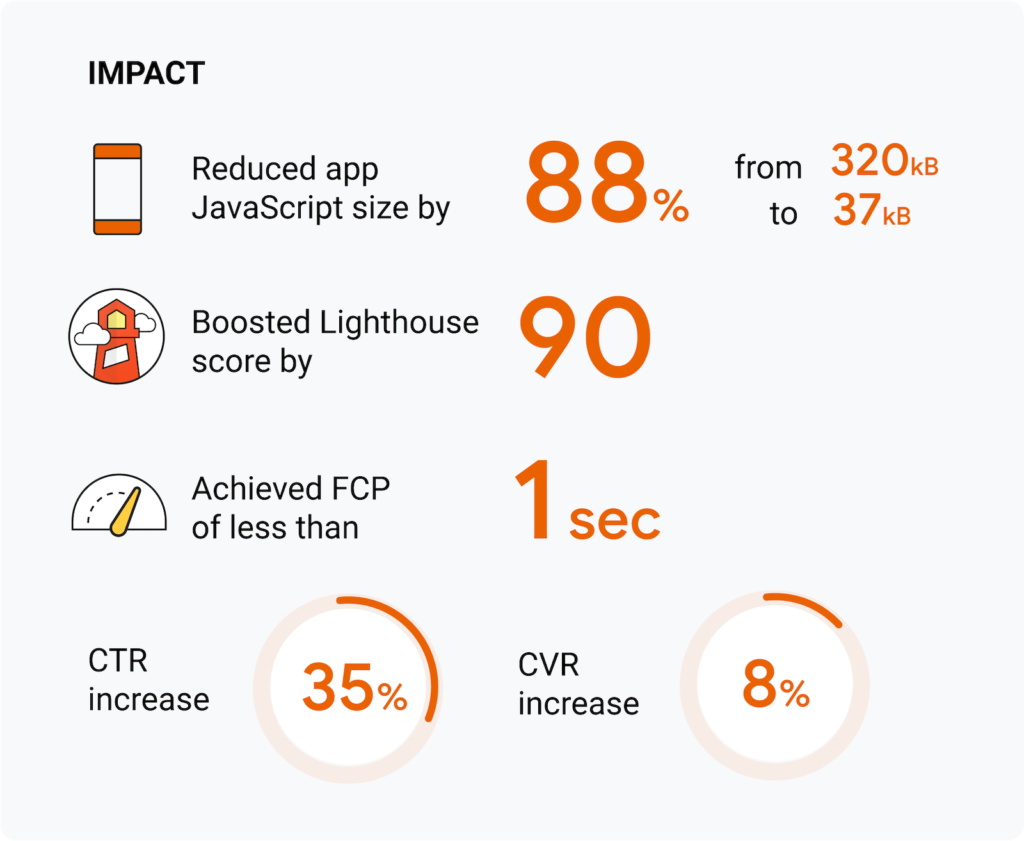
They have used an extensive framework to achieve these results. The updates have immensely improved the performance of its website.
NDTV- It is a very famous Indian news channel that has over 200M users. It was essential for NDTV to upgrade to the standards of CWV metrics.
Following this, the website experienced a 55% boost in its LCP, accompanied by a decrease in the 50% bounce rate. They used tools like the web.dev/measure, WebpageTest and PageSpeed Insights.
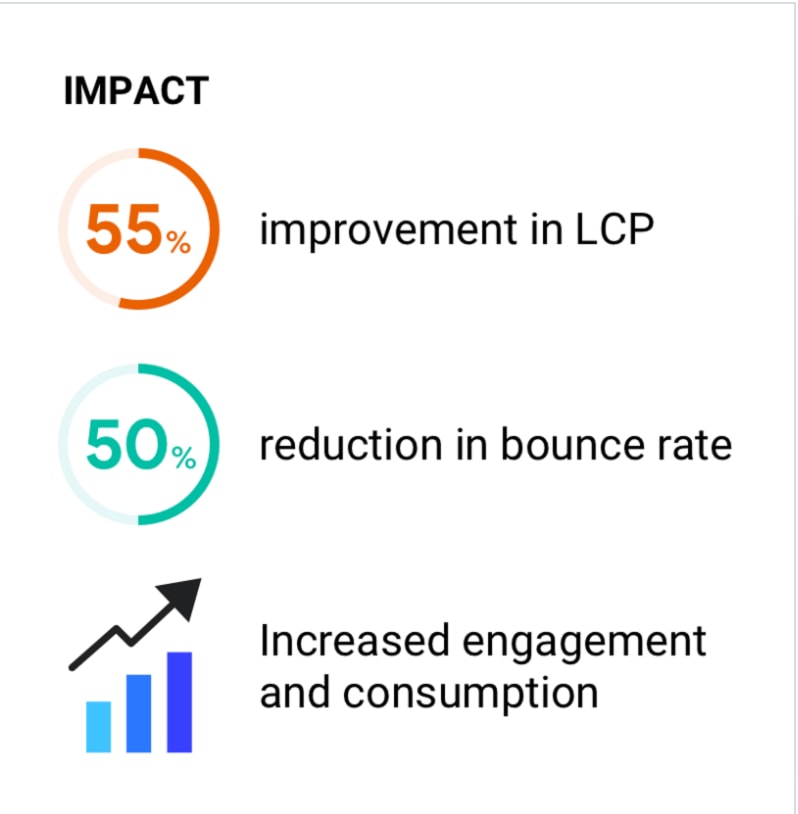
It increased consumption and engagement of content, thereby increasing their revenue. The LCP score went down from 3 seconds to 1.6 seconds after the optimization.
Shopify- This case study analyzes the CWV scores of all Shopify themes by doing multiple tests in a day. The results are fascinating to read.
Conclusion
The launch of Core Web Vitals metrics is essential for helping website owners understand the user experience on their sites. These were some of the latest stats that could help you better understand the necessity of CWV and why you should implement it.
Sources