ChemiCloud secured an overall score of 5.61 out of 10 in our testing. Across the October 2025 to May 2026 window, its strongest metric was global TTFB at 460 ms, while its weakest was load handling at 1,068 ms with a 4.2% error rate. Its US TTFB of 531 ms and uptime of 99.76% both landed below the field median. We have been monitoring the host’s performance since 2021 with over 1.87 million tests conducted till now. As we consider the year on year data, we noticed a gradual degradation in its performance, with 2025 being its worst year on record.
In this review, we will walk you through the various performance metrics of ChemiCloud including TTFB, Uptime, Global TTFB, Load handling, and Hardware. Besides, we will look into the intro and renewal pricing. Most importantly, we will explain who should choose ChemiCloud and who should avoid it.
Note: This review is based on our testing of ChemiCloud’s Starter plan. The performance figures are measured data; the recommendations reflect our editorial assessment of those results. Unless stated otherwise, everything here applies to the Starter plan while other ChemiCloud plans may produce different benchmark results.
Performance Overview
| Metric | Result (Oct 2025–May 2026) | Score | Field Median | Assessment |
| TTFB (US) | 531ms | 6/10 | ~465ms | Below Average |
| Uptime | 99.76% | 5/10 | 99.96% | Below Average |
| Load Test | 1,068ms @ 4.2% errors | 3/10 | Varies | Poor |
| Global TTFB | 460ms | 7/10 | ~550ms | Above Average |
| WPBench (Hardware) | 6.1/10 | 6.1/10 | ~7.0 | Restricted |
| OVERALL | 5.61/10 | — | — | — |
ChemiCloud recorded an US TTFB of 531 ms with a score of 6 out of 10 while the field Median is 465 ms, making it a below average performance. The host’s uptime of 99.76% with a score of 5 out of 10 falls below the field Median of 99.96%. ChemiCloud recorded a poor Load Test result with an average response time of 1068 ms with 4.2% errors under a load of 100 concurrent users in 60 seconds.
The host recorded an average of 460 ms in the global TTFB, scoring 7 out of 10, which sits just under the field median of 550 ms. The result shows ChemiCloud serves North American and European visitors well, though Asia-Pacific latency stays higher. ChemiCloud scored 6.1 out of 10 in the WPBench test, which measures the raw server hardware without any dependence on any web server software like LiteSpeed. The host’s WPBench score reflects restricted resources for sites that plugin heavy and ecommerce stores.
TTFB Response Time
| Year | 2021 | 2022 | 2023 | 2024 | 2025 |
| Avg TTFB | 406ms | 349ms | 424ms | 435ms | 528ms |
ChemiCloud recorded an average of 531 ms in the TTFB test over the October 2025 to May 2026 window. A TTFB is the time taken for a browser to receive the first byte from a server after requesting for a webpage. A low TTFB ensures faster page loading and better user experience. The host recorded the best on record TTFB in 2022 with 349 ms, and has since degraded to 531 ms — a 52% increase.
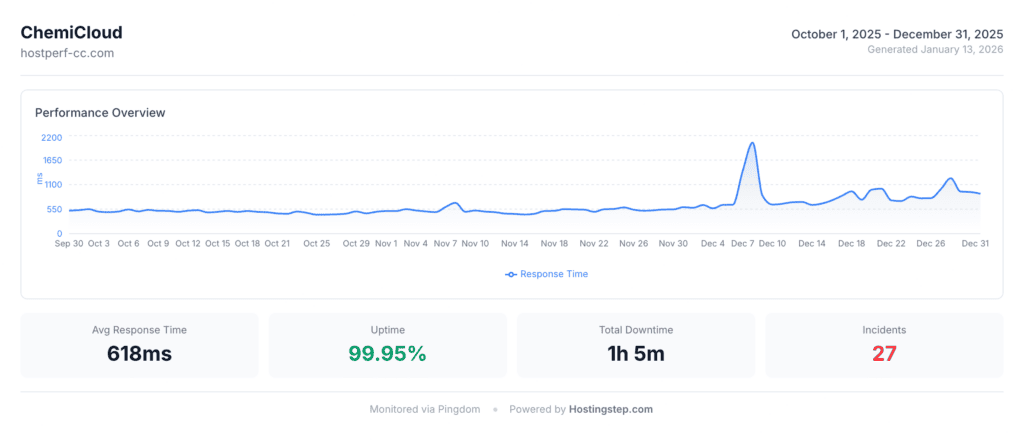
While the year on year changes may partly reflect Pingdom probe variability, our test measurements show a consistent upward trend instead of relating every change to server degradation. The TTFB of 531 ms is below average with the field median at 465 ms.
Uptime
| Year | Avg Uptime | Total Outages | Total Downtime | Worst Day | Trend |
| 2021 | 99.95% | 19 | 269 min | 89.51% | Baseline |
| 2022 | 99.89% | 34 | 557 min | 91.67% | Deteriorating |
| 2023 | 99.85% | 27 | 805 min | 69.70% | Deteriorating |
| 2024 | 99.92% | 35 | 395 min | 93.06% | Recovered |
| 2025 | 99.76% | 67 | 1,282 min | 57.73% | WORST ON RECORD |
ChemiCloud’s uptime only got worse in 2025 with outages doubling from 35 in 2024 to 67 in 2025. The total downtime increased from 395 minutes to 1282 minutes. ChemiCloud had the worst single day with an uptime of only 57.73%, indicating websites down for almost half a day.
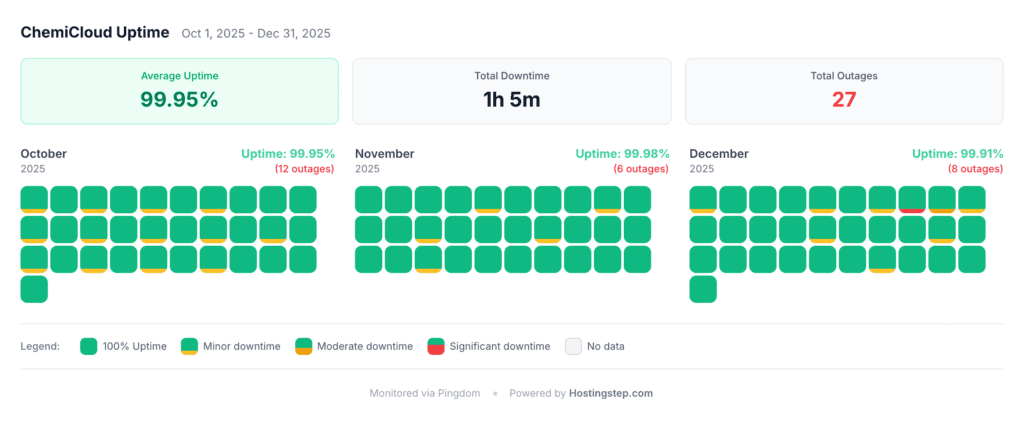
While ChemiCloud claims to have an uptime SLA of 99.9%, the host recorded an uptime of 99.76% in our uptime tests. Hence, we found ChemiCloud falling short of its claims. A total downtime of 1282 minutes in 2025 means 21 hours of downtime in 2025 alone.
Load Handling
In the Load test, we send 100 concurrent visitors in 60 seconds to our demo site using Loader.io to see how well the site handles the traffic. An average response time of 1068 ms under load with 4.2% errors indicates weak load handling. A 4.2% error rate means 1 out of every 24 page requests receives errors under concurrent load.
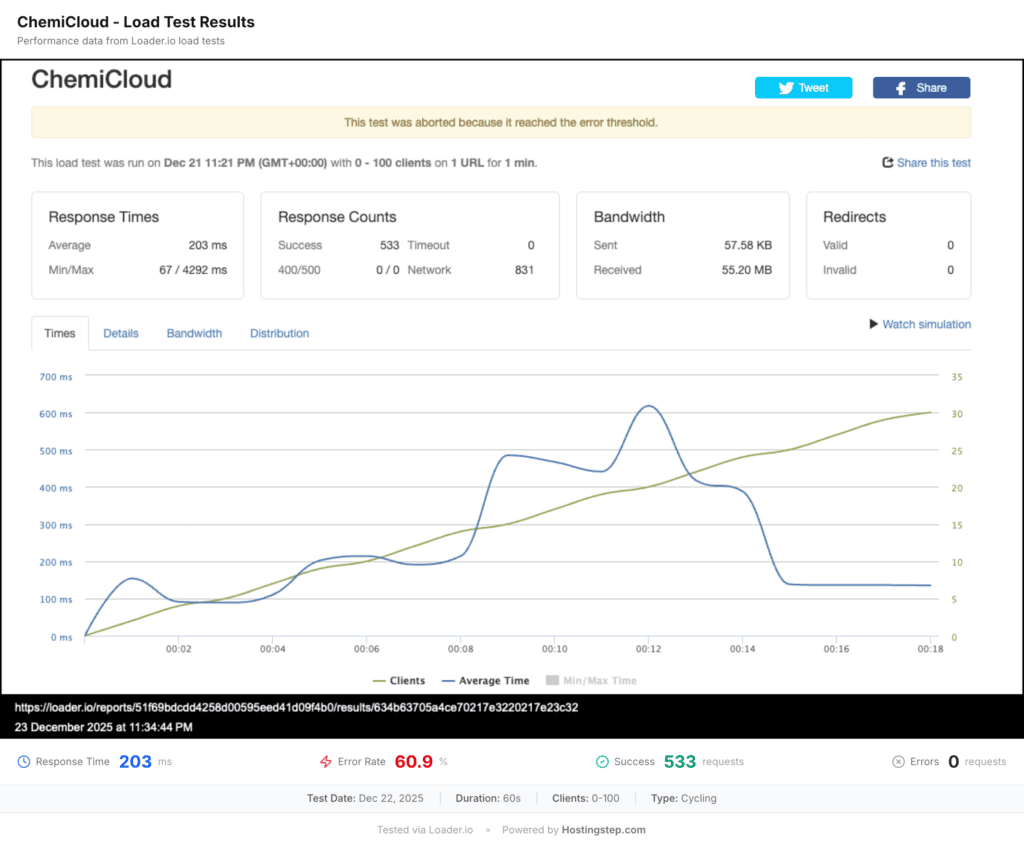
A load handling score of 3 out of 10 reflects poor performance under concurrent traffic. In the real world, any site with a viral post or product launch site or any site with high traffic will experience degraded performance leading to sluggish page loading for visitors.
Server Hardware
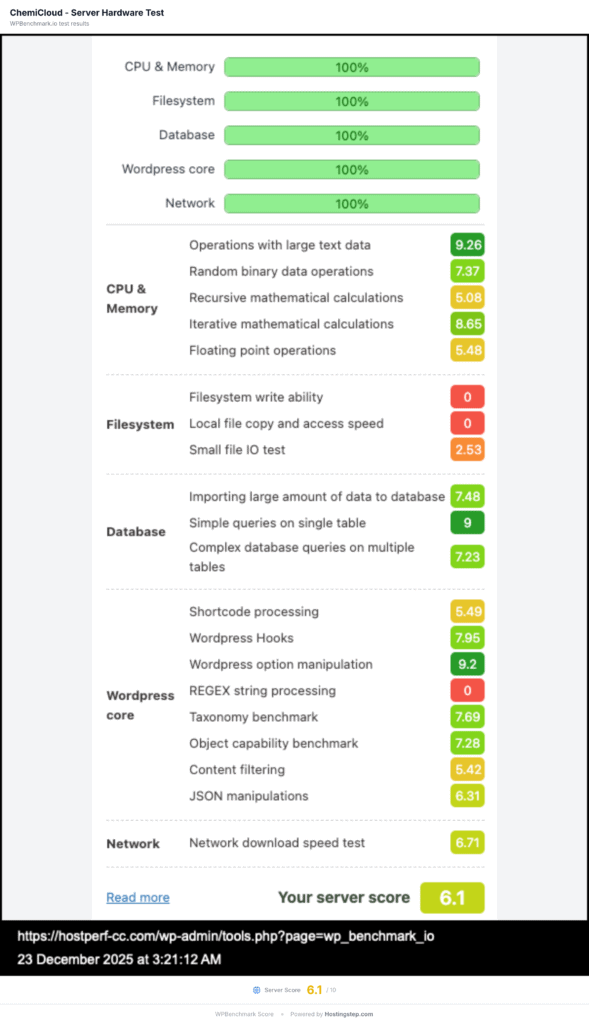
WPBench test measures the raw strength of the server hardware for allocated CPU, RAM, and disk I/O for a plan without any dependence on web server software like LiteSpeed. ChemiCloud recorded 6.1 out of 10. While ChemiCloud’s hardware looks impressive on paper with AMD EPYC 9000 CPUs and NVMe storage, the Starter plan doesn’t get much of it. ChemiCloud Starter plan suffers from resource limitations and may not be ideal for ecommerce sites and sites that are plugin heavy.
Global TTFB
Regional TTFB Data
| Region | Avg TTFB | Best City | Worst City |
| Americas | 252ms ✓ | Oregon 44ms | São Paulo 591ms |
| Europe | 492ms | London 445ms | Sweden 556ms |
| Asia-Pacific | 616ms | Osaka 326ms | Dubai 1,300ms |
ChemiCloud recorded its best TTFB in the Americas with an average of 252 ms, which makes it ideal for sites based on US traffic. The host records its highest latency in Asia Pacific with an average TTFB of 616 ms.
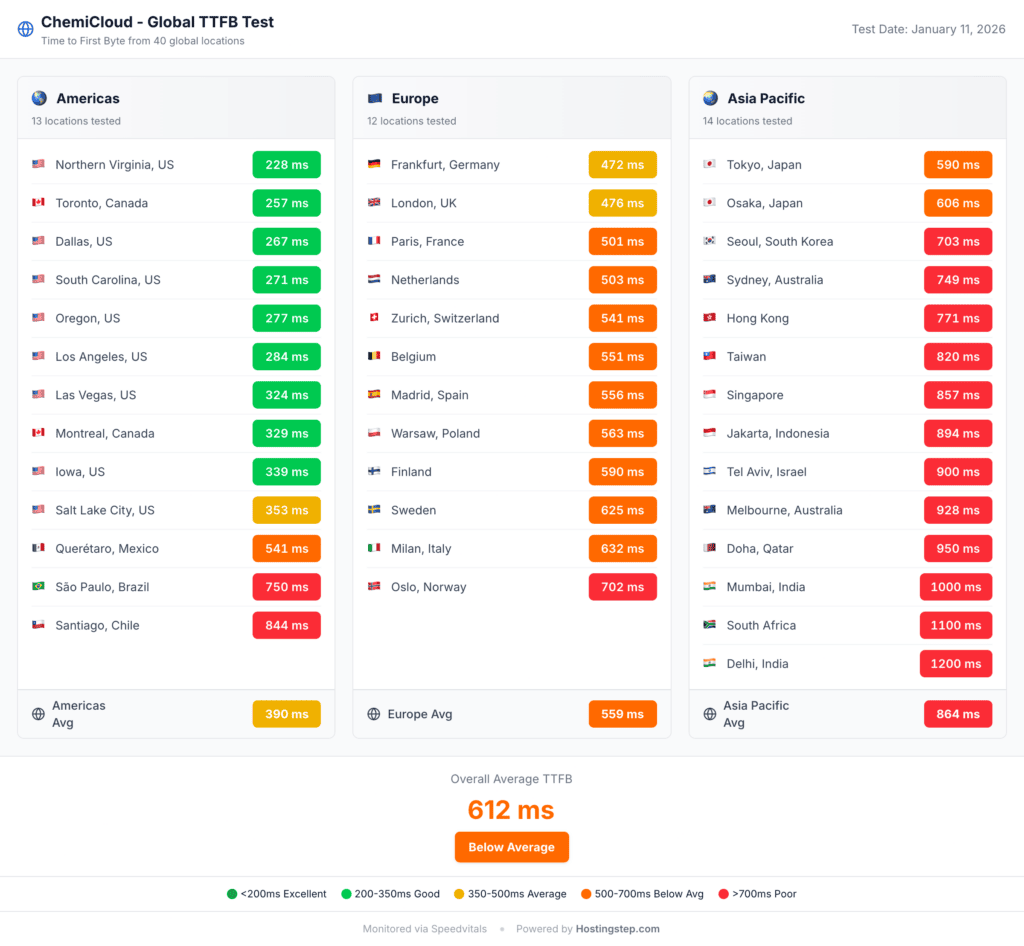
Asia-Pacific visitors will see higher latency, though core hubs like Osaka (326 ms) and Tokyo (353 ms) stay reasonable. One reason for the higher Asia-Pacific latency is the absence of a bundled CDN unlike WordPress.com with a faster global TTFB. Based on our data, ChemiCloud is less suited for sites that rely heavily on Asia-Pacific traffic.
ChemiCloud vs Competitors
| Metric | ChemiCloud | FastComet | GreenGeeks | SiteGround |
| Final Score | 5.61/10 | 7.14/10 | 7.38/10 | 6.27/10 |
| TTFB (Oct 25–May 26) | 531ms | 496ms | 411ms | 745ms |
| TTFB Score | 6/10 | 7/10 | 8/10 | 3/10 |
| Uptime (Oct 25–May 26) | 99.76% | 99.98% | 99.95% | 99.96% |
| Uptime Score | 5/10 | 9/10 | 7.5/10 | 8/10 |
| Load Test | 1,068ms / 4.2% err | 78ms / 0.00% err | 26ms / 0.00% err | 170ms / 0.00% err |
| Load Score | 3/10 | 8/10 | 10/10 | 6/10 |
| Global TTFB | 460ms | 387ms | 386ms | 1,200ms |
| Global Score | 7/10 | 8/10 | 8/10 | 4/10 |
| WPBench | 6.1 | 4.8 | 5.0 | 8.4 |
| CDN | None | None | None | Addon |
| Included | Included | Included | Included | |
| Backups | Daily | Daily | Daily | Daily |
| Intro Price | $2.49/mo | $1.99/mo | $2.95/mo | $3.99/mo |
| Renewal | $11.95/mo | $4.49/mo | $13.95/mo | $17.99/mo |
ChemiCloud vs FastComet
FastComet is cheaper than ChemiCloud with $1.99 per month vs $2.49 per month. Besides, FastComet beats ChemiCloud on almost all performance metrics comprising TTFB with 496 ms vs 531 ms, uptime with 99.98% vs 99.76%, load handling with 78 ms with zero errors vs 1,068 ms with 4.2%, and global TTFB with 387 ms vs 460 ms. ChemiCloud wins on only WPBench hardware score with 6.1 vs 4.8 even though it is not of much advantage in terms of fast performance.
Even though both hosts include similar feature sets with email hosting included and no bundled CDN, FastComet has comparatively faster speeds at a lower price. Besides, FastComet’s renewals are significantly lower than ChemiCloud with $4.49 per month vs $11.95 per month, which is like 62% cheaper.
ChemiCloud vs GreenGeeks
GreenGeeks beats ChemiCloud on most performance metrics. GreenGeeks recorded better TTFB with 411 ms vs 531 ms, better load handling with 26 ms/0% vs 1,068 ms/4.2% and better global TTFB with 386 ms vs 460 ms. While GreenGeeks scored 10 out of 10 in the load test, ChemiCloud scored only 3 out of 10, and this is the starkest single metric contrast. Hence, the two hosts have a big performance gap.
Even while ChemiCloud is slightly cheaper than GreenGeeks with $2.49 per month vs $2.95 per month, the difference is negligible with $0.46 per month. However, both hosts lack CDN and have identical feature scores with 5.0 out of 10. ChemiCloud has a slightly higher score than GreenGeeks in WPBench with 6.1 vs 5.0, meaning it allocates slightly more hardware resources. However, the host still fails to deliver faster speeds. ChemiCloud has slightly lower renewals than GreenGeeks with $11.95 per month vs $13.95 per month.
ChemiCloud vs SiteGround
ChemiCloud wins on the intro pricing with $2.49 per month vs $3.99 per month. ChemiCloud also has cheaper renewals than SiteGround by a big margin with $11.95 per month vs $17.99 per month. ChemiCloud wins on TTFB with 531 ms vs 745 ms and global TTFB with 460 ms vs 1,200 ms. However, SiteGround still outperforms ChemiCloud since it comes with a CDN addon while ChemiCloud doesn’t come with a CDN setup.
SiteGround also wins on the load handling with 170 ms/0% vs 1,068 ms/4.2%. SiteGround also has a higher WPBench with 8.4 vs 6.1 but its delivery speed is below average. ChemiCloud, on the other hand, offers faster TTFB and global TTFB despite weaker hardware. Both hosts sit below the field median. Neither host is our top recommendation. However, SiteGround can be ideal for sites that expect traffic spikes considering its higher hardware score and 0% load test error rate.
Who Should Use ChemiCloud
Bloggers with US based traffic and low traffic personal sites can choose ChemiCloud since the host recorded an average of 44 ms in Oregon, which should be adequate for such low volume content sites. Besides, ChemiCloud is also an ideal option for low renewal price sensitive users.
Sites that don’t expect traffic spikes can go with ChemiCloud since the host’s poor load handling with 4.2% errors won’t come in the way of such sites. Sites with steady low traffic will not trigger this weakness.
Who Shouldn’t Use ChemiCloud
Sites that rely on Asia-Pacific visitors should not choose ChemiCloud since our global TTFB test recorded higher Asia-Pacific latency with the average response time going up to 616 ms. Besides, the host doesn’t have any bundled CDN to minimize the issue. Such sites can go with better alternatives like GreenGeeks as these hosts offer better global reach.
Ecommerce stores need to avoid ChemiCloud since the host recorded a high average response time of 1068 ms with 4.2% errors while such stores experience traffic spikes quite frequently. This means 1 out of 24 requests will fail, putting such stores at a measurable revenue risk during sales. WP Engine and Cloudways are better alternatives for ecommerce stores.
Uptime critical sites should not choose ChemiCloud since the host had 67 outages with a total of 1,282 minutes of downtime in 2025, the worst year in our 5-year test record. For business sites where every minute matters and every downtime has a direct financial impact, this trend is discouraging. Such sites can go with WordPress.com, which held an uptime of 99.99% in our testing.
Growing sites that expect traffic increase should not choose ChemiCloud since the host scored 6.1 out of 10, indicating restricted resource allocation. This will be the biggest performance hurdle as a site begins to grow bigger. ChemiCloud’s raw server strength runs out faster than many other alternatives at a similar price point.
Users that look for low renewal should not choose ChemiCloud since the Starter plan renews at $11.95/mo which is a 380% increase from the intro price of $2.49/mo. FastComet at $1.99/mo, on the other hand, delivers better performance with much lower and predictable renewal costs.
Our Verdict
ChemiCloud recorded an overall score of 5.61 out of 10 in our 2026 WordPress hosting benchmarks. We have been monitoring ChemiCloud since 2021 and found 2025 as the worst year in terms of its performance with a degrading TTFB trend, a load test error rate of 4.2% and 67 outages. The performance clearly indicates a lack of focus and a move in the wrong direction on the part of the host.
We recommend ChemiCloud only for bloggers and low traffic sites that drive traffic from the US alone. We don’t recommend ChemiCloud for growing sites, sites with international traffic, and sites that expect traffic spikes. Such sites can go with better alternatives like FastComet or GreenGeeks. Both hosts outperformed ChemiCloud by a big margin in our tests. A 5.61 out of 10 score does not produce a solid choice verdict.
Methodology
Our methodology includes using Pingdom to monitor TTFB of hosts from 15 US locations every 60 seconds once. We use the same tool to monitor Uptime, record every outage event, duration and the worst day figures. At Hostingstep, we use Loader.io to test the load handling for a host by sending 100 concurrent users in 60 seconds to the host. Next, we measure the response time under load and error rate.
We test the Global TTFB using SpeedVitals in 40 cities across America, Europe, and Asia Pacific. We use WPBench to measure allocated CPU, RAM, disk I/O independent of web server software.
Our test environment includes identical WordPress installs for all 34 providers with the same theme, plugins, PHP version.