Liquid Web Review 2026
Liquid Web scored 7.66 out of 10 in our 2026 rankings. We have been continuously monitoring Liquid Web’s performance since 2021 with over 1,788 days of monitoring and over 2,574,720 individual performance tests conducted on our demo site, hostperf-nx.com with the Pingdom check ID: 7557107. The host recorded a TTFB of 496 ms and 99.96% uptime across our 8-month test window from October 2025 to May 2026.
Liquid Web is a managed WordPress hosting provider that starts for as low as $10 per month with zero renewal markup. Based on our data, Liquid Web scores 7.66 out of 10 while Kinsta scores 6.84 for $30 per month and SiteGround scores 6.27 for $3.99 per month. Liquid Web beats them and that too for $10 per month, a price which costs just a fraction of their costs. Liquid Web’s multisite pricing is unmatched and it charges $56 per month for 10 sites and $76.67 per month for 25 sites while WP Engine or Kinsta charges $100 to $300 for the same.
Liquid Web has its own data centers with no visitor limits, no overage fees and no bandwidth caps. The host’s strengths lie in its excellent load handling of 60 ms, strong uptime of 99.96%, zero renewal markup, no visitor limits, and complete features like email, CDN, DDoS, WAF, and daily backups. The weaknesses lie in 496 ms TTFB, Cloudflare Enterprise CDN limited to only static assets and no staging on the base plan.
Note: This review is based on our testing of Liquid Web’s Spark Thrive plan. The performance figures are measured data; the recommendations reflect our editorial assessment of those results. Unless stated otherwise, everything here applies to the Spark Thrive plan while other Liquid Web plans may produce different benchmark results.
Performance Overview
| Metric | Result | Score (/10) | Rating |
| TTFB (US) | 496ms | 7 | Average |
| Uptime | 99.96% | 8 | Good |
| Load Test | 60ms / 0.00% error | 8 | Good |
| Global TTFB | 349ms | 9 | Strong |
| Server Hardware (WPBench) | 7.2 | 7.2 | Average |
| Performance Total | 4.71/10 | — | — |
Liquid Web scored 4.71 out of 10 for overall performance. The top performers in this field are WordPress.com, Pressable, ScalaHosting, and GoDaddy MW.
Liquid Web recorded a load handling of 60 ms with 0% error, scoring 8 out of 10, which indicates strong resilience. Hosts that scored higher in the competitor set are WP Engine with 27 ms, Hostinger Business with 31 ms, and Kinsta with 40 ms. Liquid Web recorded an uptime of 99.96%, scoring 8 out of 10 while WP Engine (100%), Hostinger Business (99.98%), and Kinsta (99.98%) edged ahead in the comparison group.
Liquid Web scored 8.5 out of 10 on features with email, CDN, and daily backups all included while WP Engine and Kinsta scored the same score of 7.0 as none of them offer email hosting.
Liquid Web’s main performance weakness lies in its TTFB score of 7 out of 10 with an average response time of 496 ms. Even budget hosts like Hostinger Business recorded 438 ms, which is 58 ms faster than Liquid Web. However, Liquid Web’s TTFB is in the average range and is still better than that of SiteGround, which scored 3 out of 10 with a TTFB of 745 ms.
With this overall performance, your site will mostly perform above average. The host also offers an excellent load handling with 60 ms/0% error, which means the host can efficiently handle traffic spikes equally well as hosts that cost 2x to 3x more.
TTFB Response Time
| Year | Avg TTFB | Uptime | Days Monitored | Tests | Outages |
| 2021 | 431ms | 99.91% | 329 | 473,760 | 25 |
| 2022 | 413ms | 99.997% | 364 | 524,160 | 2 |
| 2023 | 438ms | 99.98% | 365 | 525,600 | 7 |
| 2024 | 454ms | 99.99% | 366 | 527,040 | 8 |
| 2025 | 497ms | 99.99% | 364 | 524,160 | 5 |
Liquid Web recorded an average TTFB of 496 ms across our 8-month test window from October 2025 to May 2026, scoring 7 out of 10 on our scale as it sits in the 450 ms to 500 ms bracket. TTFB is the time a server takes to send the first byte of data to a browser after receiving a request. It’s the foundational speed metric that impacts everything on your page.

On our scoring scale, anything below 350 ms is considered Elite with a score of 10 out of 10 while a TTFB between 350 ms to 400 ms scores 9 out of 10. TTFB between 400 ms to 450 ms gets a score of 8, TTFB between 450 ms to 500 ms gets a score of 7, TTFB between 500 ms to 550 ms gets a score of 6, TTFB between 550 ms to 600 ms gets 5, TTFB between 600 ms to 700 gets 4 and anything above 700 ms gets 3 out of 10.
Liquid Web with a TTFB of 496 ms sits just inside the 7 out of 10 bracket, 4 ms from slipping to the 6 out of 10 band at 500 ms and 46 ms from reaching the 8 out of 10 band below 450 ms.
As we look at the historical trend, the host has had a gradual drift from 413 ms in 2022 to 496 ms in our current window, which is a 20% increase in the average response time. While we see an upward trajectory in the average response time, it’s still stable and not collapsing. The host recorded 431 ms in 2021 even though we monitored only 329 days that year. 2022 has been the best year for Liquid Web with a TTFB of 413 ms. However, there has been a gradual decline in TTFB performance since 2023 with the TTFB going up to 438 ms from 413 ms in the past year. The TTFB performance declined even further in 2024 with 454 ms and in 2025 full year, the TTFB went up to 497 ms, approaching the 500 ms threshold.
The hosts with the best performance in this field are WordPress.com with 319 ms, Pressable with 320 ms, and GoDaddy MW with 340 ms. While the field median is 465 ms, Liquid Web is just above the median at 496 ms and SiteGround is the slowest in the comparison set with 745 ms. Among competitors, WP Engine recorded 355 ms, Hostinger Business recorded 438 ms, Kinsta recorded 525 ms, and SiteGround recorded 745 ms. Liquid Web with a TTFB of 496 ms is faster than SiteGround by 249 ms and slower than WP Engine by 141 ms.
At 496 ms, the server will take about half a second to begin responding and for a WordPress blog with images, the full page loading will be from 2 to 3 seconds. The page loading will take from 2.5 seconds to 3.5 seconds in case of WooCommerce stores with dynamic product pages. While this is acceptable for most sites, this is not acceptable for sites that focus on fastest delivery.
Google recommends a TTFB threshold under 800 ms for SEO, which Liquid Web easily passes but again a sub 200 ms is considered good by web.dev standards and Liquid Web doesn’t reach this. While 496 ms is a decent TTFB for a managed hosting at $10 per month, users in need of sub 200 ms can choose faster hosts such as WP Engine at $23 per month, or Pressable at $20.83 per month.
Uptime
Liquid Web recorded an uptime of 99.96% across our 8-month test window, scoring 8 out of 10 on our reliability scale, which is strong. Uptime measures the time your website is accessible and even small differences matter a lot in uptime. An uptime of 99.96% means roughly 17 minutes of downtime per month, while a 100% uptime means zero.

Liquid Web’s 99.96% uptime means a downtime of roughly 17 minutes per month, which on a yearly basis will be about 3.5 hours. The host experienced a total downtime of 1 hour 56 minutes across 3 outages over our 8-month window. For any eCommerce site doing $10k per month, under 2 hours of downtime over 8 months will have a minimal revenue impact.
Our scoring scale comprises scores as 10 for 100%, 9.5 for 99.99%, 9 for 99.98%, 8.5 for 99.97%, 8 for 99.96%, 7.5 for 99.95%, 7 for 99.94%, and 5 for 99.90%. Liquid Web scored 8 with an uptime of 99.96%.
The uptime has significantly improved from 99.91% in 2021 with 25 outages and 406 minutes of downtime roughly for the first year, to 99.99% with 5 outages and 63 minutes of downtime in 2025. This was possible because the host invested in infrastructure reliability. Besides, they own their own data centers, which gives them direct control over hardware, networking and maintenance.
The field best hosts that achieved 100% in our 8-month window are WordPress.com, Pressable, WP Engine, and Templ.io. Among competitors, WP Engine recorded 100%, Hostinger Business recorded 99.98%, Kinsta recorded 99.98%, and SiteGround recorded 99.96%. Liquid Web tied with SiteGround at 99.96% while WP Engine, Hostinger Business, and Kinsta edged ahead.
Liquid Web has its own data centers while most managed hosts resell cloud infrastructure. For example, WP Engine uses Google Cloud, and Kinsta uses Oracle Cloud. This is a genuine differentiator as Liquid Web’s direct ownership means direct control over uptime, hardware maintenance, and resource allocation. This is also the reason that Liquid Web plans come with no visitor limits and no overage fees
Load Handling
Liquid Web recorded an average response of 60 ms with 0.00% error rate under a load of 100 concurrent users and PASSED the load test with distinction with a score of 8 out of 10. Load testing simulates how a host handles the load when many visitors visit your site at the same time. We send a concurrent traffic of 100 visitors in 60 seconds to see how well the host handles the load.
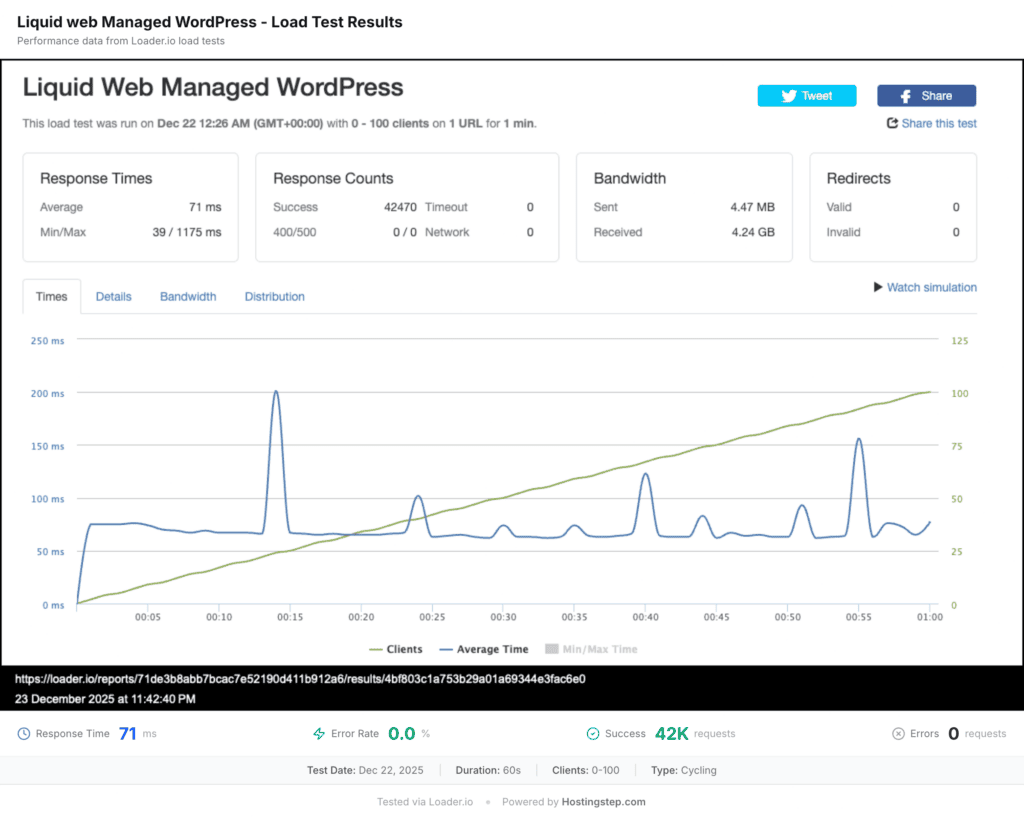
Our scoring scale comprises a score of 10 for a response time below 30 ms, 9 for average response time between 30 ms to 50 ms, 8 when it’s between 50 ms to 80 ms, 7 when it’s between 80 ms to 150 ms, 6 when it’s between 150 ms to 250 ms, 5 when it’s between 250 ms to 500 ms, 3 when it’s greater than 500, and 0 (Failed) when it’s over 50% error.
An average response time of 60 ms with 0.00% error rate means your site remains responsive even during a traffic spike like Reddit post, flash sale, ,or product launch. Pages that normally load in 2 seconds will still load in 2.1 seconds and visitors won’t even notice the spike. The 0% error rate ensures that every single request is successfully served and no visitors will see any error page. For a WooCommerce store, a flash sale with over 100 shoppers will serve every cart page and checkouts without any errors. For agencies, their client sites won’t experience any downtime during their marketing campaigns.
Among competitors, WP Engine recorded 27 ms, Hostinger Business recorded 31 ms, Kinsta recorded 40 ms, and SiteGround recorded 170 ms while Liquid Web recorded 60 ms, sitting at the 4th position in the competitor set. Liquid Web is behind the premium hosts in terms of load handling but well ahead of SiteGround with 3x faster page loading.
Liquid Web not only comes with an excellent load handling with 60 ms and 0% errors but also the host doesn’t penalize sites for traffic spikes with no visitor caps, no bandwidth limits, and no overage fees while hosts like WP Engine and Kinsta do impose visitor caps and charge overages. It’s possible because Liquid Web owns its data centers and controls infrastructure cost unlike hosts reselling cloud infrastructure such as WP Engine on Google Cloud or Kinsta on Oracle Cloud, that charge pay-per-resource fees once sites exceed their imposed limits.
Server Hardware Test
Liquid Web scored 7.2 out of 10 in our WPBenchmark test, which sits at the field median. The WPBenchmark test measures the CPU processing power, RAM allocation and disk I/O speed for the hosting plan. A higher score indicates more computational resources for your WordPress site’s database queries, plugin operations, and page generation.

The field’s best hosts are Bluehost with 9.6, ScalaHosting with 8.8, and Kinsta 8.8. Liquid Web is sitting exactly at the field median of 7.2. Among competitors, Kinsta scored 8.8, SiteGround scored 8.4, Hostinger Business scored 7.4, and WP Engine scored 6.5. Liquid Web with a WP Bench score of 7.2 is ahead of WP Engine.
Despite the lowest WPBench of 6.5, WP Engine delivers the fastest TTFB of 355 ms and global TTFB of 65 ms. This indicates that raw hardware allocation is not the only determinant of speed. The delivery speed depends on server software optimization, CDN configuration, and caching layers alongside raw hardware allocation.
Liquid Web’s 7.2 hardware helps in delivering excellent load handling of 60 ms but the moderate TTFB of 496 ms indicates that the hardware has to work hard under load, less so for single request speed.
Liquid Web’s raw hardware allocation is adequate for plugin heavy sites with over 20 plugins with complex database queries. For WooCommerce stores, product catalogs, dynamic pricing and checkout flows will run smoothly without throttling. The hardware strength is mid range and not a differentiator while the host’s major strengths lie in its load handling, uptime, feature completeness and pricing.
Global TTFB
Liquid Web recorded a global average of 349 ms scoring 9 out of 10 after being tested from 40 locations across the Americas, Europe, and Asia Pacific. Global TTFB tests how fast your site responds to visitors around the world and not just in the US. This metric matters a lot for sites that largely rely on international traffic. Liquid Web uses Cloudflare Enterprise CDN, which caches static assets like images, CSS, and JS rather than full-page HTML at the edge.
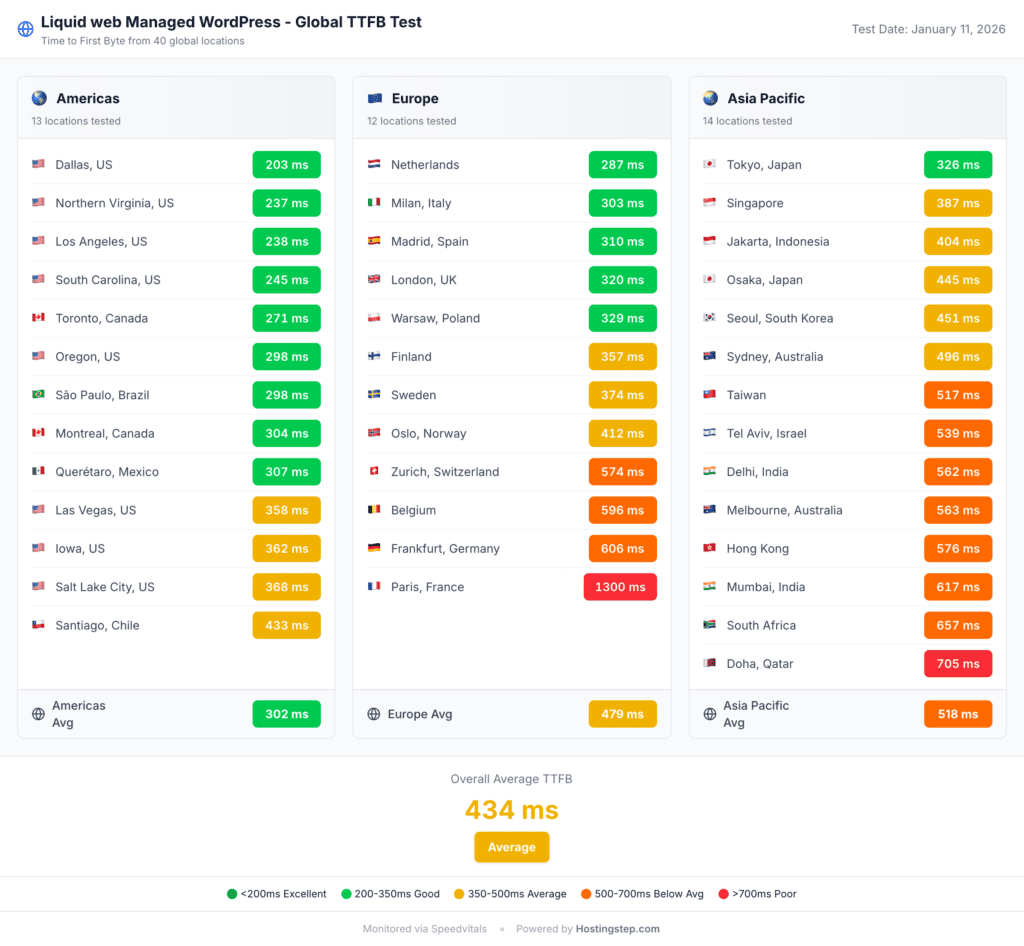
The host recorded an average TTFB of 240 ms in the Americas with the best TTFB in Northern Virginia with 80 ms, Montreal with 117 ms, and Toronto with 126 ms. The host recorded the mid range TTFB in Oregon with 132 ms, Dallas with 153 ms, Los Angeles with 175 ms, and Iowa with 178 ms. The weakest TTFBs were seen in Querétaro with 258 ms, Salt Lake City with 383 ms, and Santiago with 864 ms. Aside from Santiago, every Americas location resolves under 385 ms, with the US and Canada clustered between 80 ms and 224 ms, which indicates strong response times across the region.
Liquid Web recorded an average TTFB of 241 ms in Europe, which is strong, and the best TTFBs were seen in Finland with 201 ms, Zurich with 204 ms, Paris with 212 ms, and Netherlands with 216 ms. Mid-range TTFBs were seen in London with 224 ms, Frankfurt with 241 ms, and Milan with 265 ms. The weakest European TTFBs were Madrid with 271 ms and Warsaw with 330 ms, meaning every European location stays under 350 ms. In Asia Pacific, Liquid Web recorded an average TTFB of 523 ms. The best regional TTFBs were Taiwan with 310 ms, Singapore with 325 ms, and Jakarta with 341 ms, while Osaka (350 ms), Seoul (398 ms), Sydney (409 ms), and Mumbai (414 ms) stayed mid range. The weakest TTFBs were Tokyo with 688 ms, Tel Aviv with 854 ms, and Dubai with 1,500 ms, which pulls the regional average up. Without full-page edge caching, distant Asia Pacific and Middle East visitors see noticeably slower responses than hosts like WP Engine, which averages 65 ms globally with edge CDN.
Liquid Web’s 349 ms global average holds up well against hosts that rely on full-page edge caching. WP Engine leads the field at 65 ms. Kinsta, despite full-page edge caching, averages 477 ms globally, so Liquid Web’s 349 ms is faster. That Liquid Web reaches 349 ms with static-asset caching alone points to strong underlying infrastructure, and full-page caching would improve its global figure further.
For sites with US and European traffic, Liquid Web’s 240 ms across the Americas and 241 ms across Europe deliver fast responses. Sites with heavy Asia Pacific or Middle East audiences can choose alternatives like WP Engine, which offers full-page edge caching with a global average as low as 65 ms. However, WP Engine costs more than double of Liquid Web with $23 per month for 1 site vs $10 per month.
Liquid Web vs Competitors
| Metric | Liquid Web | Hostinger Business | SiteGround | WP Engine | Kinsta |
| Score | 7.66 | 7.97 | 6.27 | 7.98 | 6.84 |
| TTFB | 496ms | 438ms | 745ms | 355ms | 525ms |
| Uptime | 99.96% | 99.98% | 99.96% | 100% | 99.98% |
| Load Test | 60ms/0% | 31ms/0% | 170ms/0% | 27ms/0% | 40ms/0% |
| Global TTFB | 349ms | 351ms | 1200ms | 65ms | 477ms |
| WPBench | 7.2 | 7.4 | 8.4 | 6.5 | 8.8 |
| CDN | Static | Static | Addon | Edge | Edge |
| Included | Addon | Included | None | None | |
| Backups | Daily | Daily | Daily | Daily | Daily |
| Intro Price | $10.00 | $3.69 | $3.99 | $23.00 | $30.00 |
| Renewal | $10.00 | $7.99 | $17.99 | $23.00 | $30.00 |
| Renewal Markup | 0% | 117% | 501% | 0% | 0% |
Liquid Web vs Hostinger Business
Hostinger Business beats Liquid Web on an overall score of 7.97 vs 7.66. Besides, Hostinger Business wins on TTFB with 438 ms vs 496 ms, load handling with 31 ms vs 60 ms, and uptime with 99.98% vs 99.96%. On global reach the two are effectively tied, with Hostinger Business at 351 ms and Liquid Web at 349 ms. Liquid Web comes with included email while Hostinger Business charges extra for email.
Liquid Web also beats Hostinger on CDN quality with Cloudflare Enterprise vs basic static CDN, DDoS protection, WAF, and zero renewal. Hostinger Business is 63% cheaper with $3.69 vs $10 but Liquid Web beats Hostinger on renewal with flat renewal with no surprises with $10 flat vs $7.99. Hostinger renewal is a 117% markup and over 3 years, the total cost gap narrows significantly.
Liquid Web is also better from the multi site perspective as it offers dedicated multi site tiers while Hostinger Business is a single plan product. For example one can host 10 sites for $56.25 per month while one would need 10 separate Hostinger Business accounts to host 10 sites with Hostinger Business.
Both hosts use static CDN, which is not edge caching. Hence, neither delivers global speeds of WP Engine level. Their global TTFB is now essentially level at 351 ms for Hostinger Business and 349 ms for Liquid Web. Check Hostinger Review.
Liquid Web vs SiteGround
Liquid Web outscores SiteGround with 7.66 vs 6.27. Liquid Web wins on TTFB with 496 ms vs 745 ms, load handling with 60 ms vs 170 ms, which is nearly 3x faster under load, and global TTFB with 349 ms vs 1,200 ms, which makes Liquid Web over 3x faster globally.
SiteGround, on the other hand, wins on WPBench hardware with 8.4 vs 7.2, which reflects its more raw hardware strength than Liquid Web. Besides, SiteGound wins on intro price with $3.99 vs $10.00. Both hosts include email and daily backups. However, the SiteGround renewal is a 501% markup from the intro price of $3.99 per month to $17.99 per month while Liquid Web stays $10.00 with 0% markup at its renewal. Hence, Liquid Web is $7.99 per month cheaper than SiteGround after 12 months.
If we consider the TTFB trend, SiteGround’s TTFB has declined from 403 ms to 745 ms over recent years, while Liquid Web’s trend has been comparatively stable with a 20% drift from 413 ms to 496 ms. Besides, there is a big difference in the CDN implementation. Liquid Web uses Cloudflare Enterprise Static CDN while SiteGround uses addon CDN alone, which explains why Liquid Web delivers better global TTFB than SiteGround with 349 ms vs 1,200 ms. Check SiteGround Review.
Liquid Web vs WP Engine
WP Engine beats Liquid Web on overall score with 7.98 vs 7.66. Besides, WP Engine wins on TTFB with 355 ms vs 496 ms, uptime with 100% vs 99.96%, load handling with 27 ms vs 60 ms, and global TTFB with 65 ms vs 349 ms, which makes it over 5x faster globally. WP Engine has been able to deliver such a faster global speed because of its full page edge caching, which caches the entire HTML pages from the closest CDN nodes worldwide. On the contrary, Liquid Web’s Cloudflare Enterprise only caches static assets rather than full-page HTML.
Liquid Web wins on price with $10 vs $23 for 1 site, email with included vs none, and visitor limits with unlimited visitor vs visitor cap. Besides, Liquid Web has better multi-site pricing with $56.25 for 10 sites vs $100 and $76.67 for 25 sites vs $250. The fact that Liquid Web has its own data center gives more control over infrastructure costs unlike WP Engine that resells Google Cloud. This is why Liquid Web has no overage fees.
WP Engine is for those users who prioritize edge cached speed for a high price while Liquid Web is suitable for users who are looking for cost efficiency, no visitor caps, and feature completeness. Check WP Engine Review.
Liquid Web vs Kinsta
Liquid Web outscores Kinsta with 7.66 vs 6.84. Kinsta scored higher in WP Bench with 8.8 vs 7.2, reflecting Kinsta’s better raw hardware than that of Liquid Web. However, Liquid Web now leads on both global TTFB with 349 ms vs 477 ms and TTFB with 496 ms vs 525 ms. Uptime is nearly identical with Kinsta at 99.98% vs Liquid Web at 99.96%.
Liquid Web wins on price with $10 per month vs $30 per month for 1 site. While Kinsta charges approximately $300 per month for 25 sites, Liquid Web charges $76.67 per month on Thrive, which makes it nearly 4x cheaper than Kinsta. Besides, Liquid Web wins on features like email and visitor limits as it comes with included email and no visitor limits unlike Kinsta, which has no email hosting and imposes visitor limits.
Liquid Web wins on infrastructure as the host has its own data centers while Kinsta runs on Oracle Cloud infrastructure. While both hosts are managed WordPress hosts, Liquid Web has an edge because of its infrastructure ownership, which translates to no bandwidth caps and no overage fees. Despite Kinsta’s edge caching, Liquid Web’s 349 ms global average is now faster than Kinsta’s 477 ms, and Liquid Web costs a third of the price. Check Kinsta Review
Who Should Use Liquid Web
Agencies managing 10 to 25 client sites can use Liquid Web since the host offers an excellent multi site pricing. For example, the Thrive plan costs $56.25 per month for 25 sites and it’s 60 to 75% cheaper than WP Engine or Kinsta. For sites that don’t need staging, the Launch plan drops cost further to $28.13 per month for 10 sites.
WooCommerce stores with US focused traffic can choose Liquid Web as the host delivers excellent load handling with 60 ms/0% errors, which will help such stores in staying up and running even during traffic spikes as in flash sales. Besides, the 240 ms Americas TTFB should deliver fast responses for US customers with no visitor limits. This also means there won’t be any overage fees charged for Black Friday traffic. Further, the daily backups will protect data.
Liquid Web is a solid choice for budget conscious users who want managed features at a reasonable price. Besides, the host has a feature score of 8.5 and users will get complete features for $10 per month flat pricing comprising daily backups, Cloudflare Enterprise CDN, email, DDoS protection and WAF. Most managed hosts charge $20 to $30 per month for these equivalent features. Besides, there is no renewal surprise as the price stays flat on renewal with 0% renewal markup.
Users who don’t need staging can choose Liquid Web, as the costs on Thrive ($10 per month) and Launch ($5 per month) plans will significantly drop without staging. Content sites, portfolios, and blogs that don’t need staging for testing can save money.
Users who want predictable pricing and dislike renewal surprises as Liquid Web follows flat pricing where $10 per month stays $10 per month at renewal with no surprise jumps. For any business budgeting annually, this should make things simpler than choosing a host like SiteGound where $3.99 per month becomes $17.99 per month on renewal with a 501% increase.
Who Should Not Use Liquid Web
Users who need sub-250 ms global speed for their sites should look beyond Liquid Web, because while its 349 ms global average is strong, hosts like WP Engine at 65 ms and Pressable at 74 ms deliver far faster worldwide speeds using full-page edge caching. When every millisecond matters for a site, the premium hosts offer a measurable advantage.
Ecommerce sites that target Asia Pacific or the Middle East as primary markets should look elsewhere, as Liquid Web’s 523 ms Asia Pacific average lags edge-cached hosts, with the weakest results in Tokyo (688 ms), Tel Aviv (854 ms), and Dubai (1,500 ms). Its 241 ms Europe average, by contrast, is strong. For a store where a large share of traffic sits in Asia or the Middle East, WP Engine is the better option with an average global TTFB of 65 ms.
Users who need a staging environment in the base plan should not choose Liquid Web because our tested Thrive plan for $10 per month doesn’t include staging while WP Engine and Kinsta offer staging in all plans. Hence, Liquid Web’s base plan is not the right fit when weekly code deployments and staging/production sync are essential.
Liquid Web is not the ideal host for absolute beginners who want the cheapest single site entry since it starts at $10 per month while there are many good hosts that offer much cheaper intro prices such as Hostinger Business with $3.69 per month, or WordPress.com with $2.75 per month. Liquid Web’s value proposition is best for multi site users and those who value managed features, which a beginner will certainly not need.
Sites whose primary audience is in Chile should weigh Liquid Web carefully, as its Santiago TTFB of 864 ms is its weakest Americas result. Elsewhere in Latin America it performs well, with São Paulo at 237 ms and Querétaro at 258 ms, so this caveat is specific to the far south of the region.
Our Verdict
Liquid Web scored 7.66 out of 10 in our 2026 rankings. We recommend Liquid Web if you want managed WordPress hosting with complete features comprising email, CDN, DDoS, WAF, daily backups, zero renewal markup, no visitor limits and affordable multi site pricing that undercuts premium competitors by 60 to 70%.
Liquid Web charges $56.25/mo for 10 sites, $76.67/mo for 25 sites vs $100–$300 on WP Engine/Kinsta. Besides, Liquid Web owns its data centers and that’s why it imposes no visitor caps, or overages. Liquid Web’s zero renewal markup where $10 stays $10 on renewal is rare across all 34 hosts and gives users a strong reason to choose Liquid Web. However, annual prepayment is a requirement when buying Liquid Web.
We don’t recommend Liquid Web if you need sub-250 ms global TTFB with full-page edge caching or if you need a staging environment in the base plan. Liquid Web has a CDN limitation as it offers static-only caching. However, the host’s 349 ms global average is now faster than Kinsta’s edge-cached 477 ms.
Hostinger Business stands out as the single best alternative for Liquid Web as it scores 7.97 out of 10 with a 438 ms TTFB and near-identical 351 ms global TTFB for $3.69 per month intro and $7.99 renewal.
Methodology
We purchase the hosting accounts with our own funds and none of them is a promotional or press account. We use various tools for conducting our performance tests including Pingdom for TTFB and Uptime, Loader.io for load testing, SpeedVitals for testing global TTFB, WPBenchmark to measure server hardware strength. We conduct over 525,600 tests per provider per year with monitoring every minute for 24/7/365.
Our current rankings are based on our 8-month test window from October 1, 2025 to May 31, 2026. For this Liquid Web review, we used continuous monitoring data spanning over 1,788 days starting from 2021, and we tested a total of 34 providers.

Mohan Raj is the founder of Hostingstep.com, where he oversees the independent testing of 25+ web hosting providers. He conducts 525,600+ performance tests per year across 60+ global locations to measure TTFB speed, uptime, load test, core web vitals, and hardware benchmarks. Each provider is tested using independently purchased hosting accounts, backed by verifiable data.