ScalaHosting Review 2026
ScalaHosting scored 8.37 out of 10 in our 2026 WordPress rankings. The host has the highest ranked shared hosting plan under $3 per month. ScalaHosting starts at $2.95 per month and renews at $9.95 per month.
The provider got a WPBench score of 8.8 out of 10 and excellent load handling of 48 ms with zero errors.
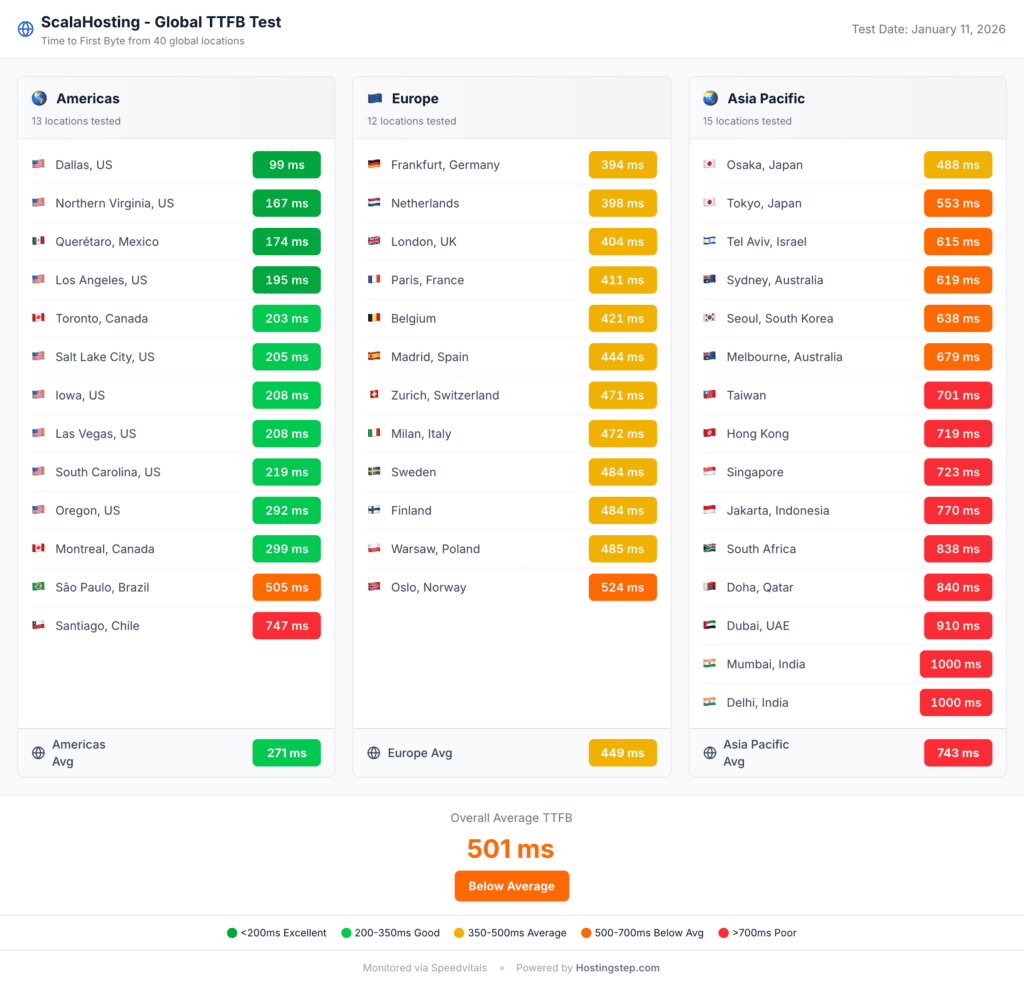
ScalaHosting has the lowest Global TTFB in Dallas with a response time of 99 ms. However, the Global TTFB results indicate slow page loading outside America. ScalaHosting recorded an average Global TTFB of 271 ms for America, 449 ms for Europe, and 743 ms for Asia-Pacific.
It has unique features like an anytime unconditional money-back guarantee, unlimited bandwidth, automated Cloudflare CDN integration, and human-only customer support.
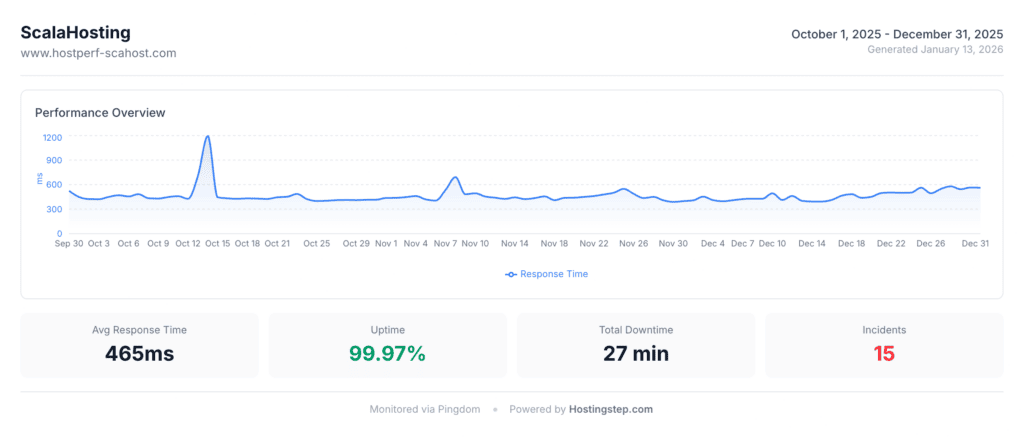
Performance Overview
| Metric | Result | Score | Rating | Context |
| TTFB (US) | 465ms | 7 / 10 | Good | Median field: ~465ms |
| Uptime | 99.97% | 8.5 / 10 | Good | ~13 min downtime/month |
| Load Test | 48ms / 0.00% error | 9 / 10 | Excellent | Top 5 in load handling |
| Global TTFB | 501ms avg | 7 / 10 | Average | Weak outside Americas |
| Server Hardware | 8.8 / 10 WPBench | 8.8 / 10 | Excellent | #3 best hardware overall |
| Performance Total | 4.82 | Strong Tier |
ScalaHosting recorded an excellent load handling of 48 ms with zero errors and also scored 8.8 out of 10 in the WPBench test of server hardware. E-commerce stores and viral blogs can benefit a lot from these performance metrics. However, the host recorded an average of 465 ms in the TTFB, which is a good but not great kind of performance.
ScalaHosting’s Global TTFB is pretty average, with an average response time of 501 ms. The poor Global TTFB is the biggest limitation for websites with audiences spread across the world. Hence, ScalaHosting is ideal only for medium to large websites with traffic concentrated within America.
TTFB Response Time
In 2025 (Q4), ScalaHosting recorded a TTFB of 465 ms, and anything between 450 and 550 ms is good according to our Tier Threshold. However, the host recorded a TTFB slightly higher, with 484.83 ms, over the past 18 days in January 2026. It’s still too early to call it a trend until we complete our 90 days of monitoring for 2026 (Q1).
As we compare ScalaHosting’s TTFB with that of other hosting providers that we have been monitoring, 465 ms sits in the median field, being 124 ms slower than Pressable and 286 ms faster than GoDaddy.
We measure TTFB from US Pingdom monitoring locations alone. For global performance, you should read our Global TTFB section.
Uptime
| Year | Days | Tests | Avg TTFB | Uptime | Downtime |
| 2025 (Q4) | 90 | 25,920 | 464.59ms | 99.97% | 27 min / 15 outages |
| 2026 (Jan) | 18 | 5,184 | 484.83ms | 99.94% | Monitoring continues |
We started Uptime monitoring in 2025 (Q4) and the host recorded an excellent uptime of 99.97%. ScalaHosting had 15 outages with a total downtime of 27 minutes. Our monitoring is still going on for 2026 (Q1).
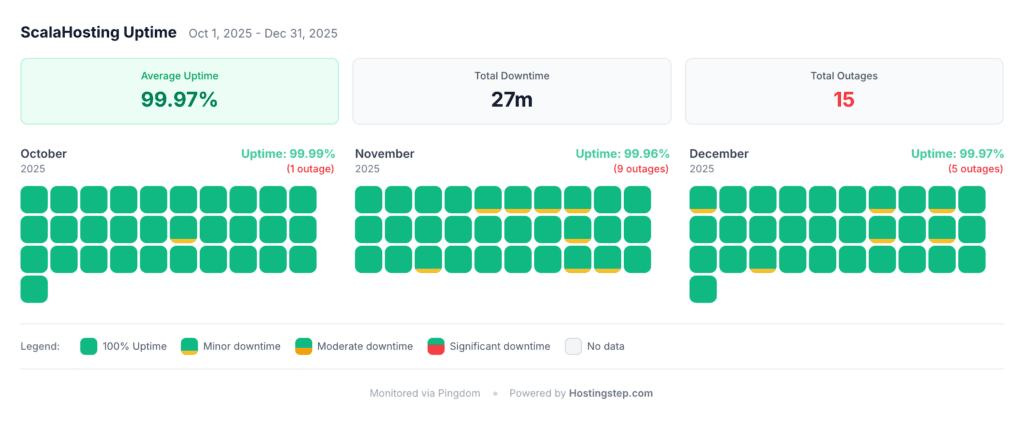
The past 18 days of monitoring this year reflect a slight drop in the Uptime from 99.97% to 99.94%. However, we haven’t seen any downtime so far. Hence, ScalaHosting has a reliable uptime, meeting the Standard of 99.9%.
Load Handling
ScalaHosting recorded an average response time of 48 ms under a load of 100 concurrent users in our Load test with zero errors. The host scored 9 out of 10 and ranked fifth among 34 providers. The top four providers are Pressable with 12 ms, WordPress.com with 16 ms, GreenGeeks with 26 ms, WP Engine with 27 ms, and Hostinger Business with 31 ms. ScalaHosting’s load handling is excellent and this is what buyers looking for budget hosting need to look for.
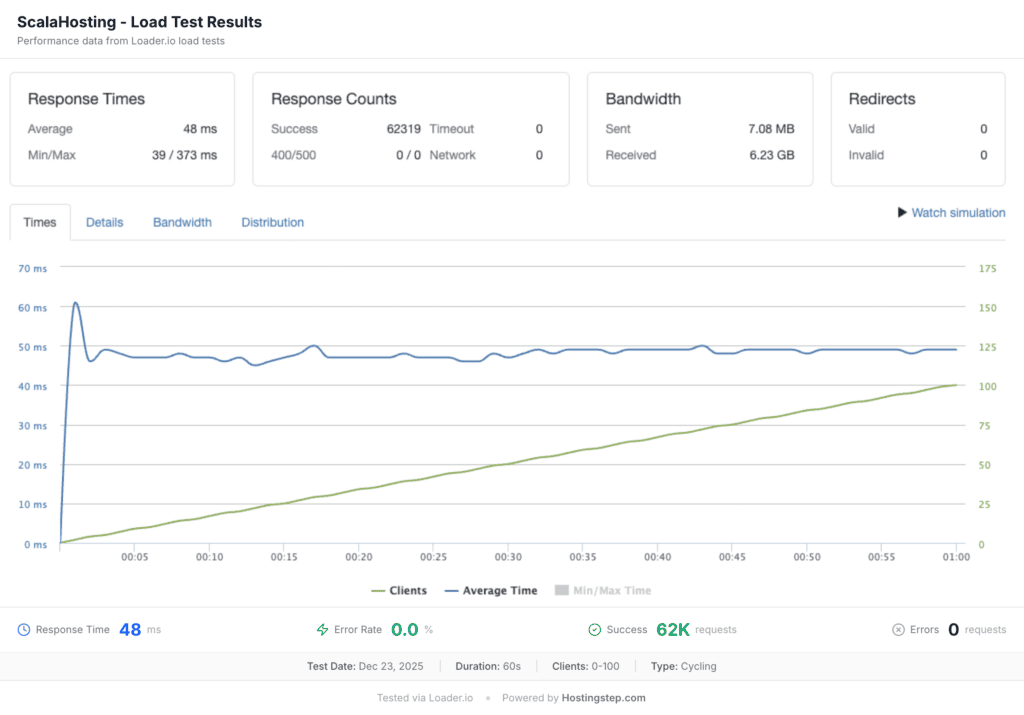
Many affordable hosting services fail in load tests. For example, Rocket.net recorded 100% errors, and GoDaddy recorded 68.8% errors in the Load test. Hence, ScalaHosting can handle traffic spikes efficiently without dropping requests. It ensures your site remains up and running even during traffic spikes.
Server Hardware Test
ScalaHosting recorded 8.8 out of 10 in our WPBench test, and ranks third, at par with Kinsta and below Bluehost (9.6) and Hostgator (9.6). WPBench measures the actual hardware capability comprising CPU, memory, filesystem and I/O, without any software optimization.
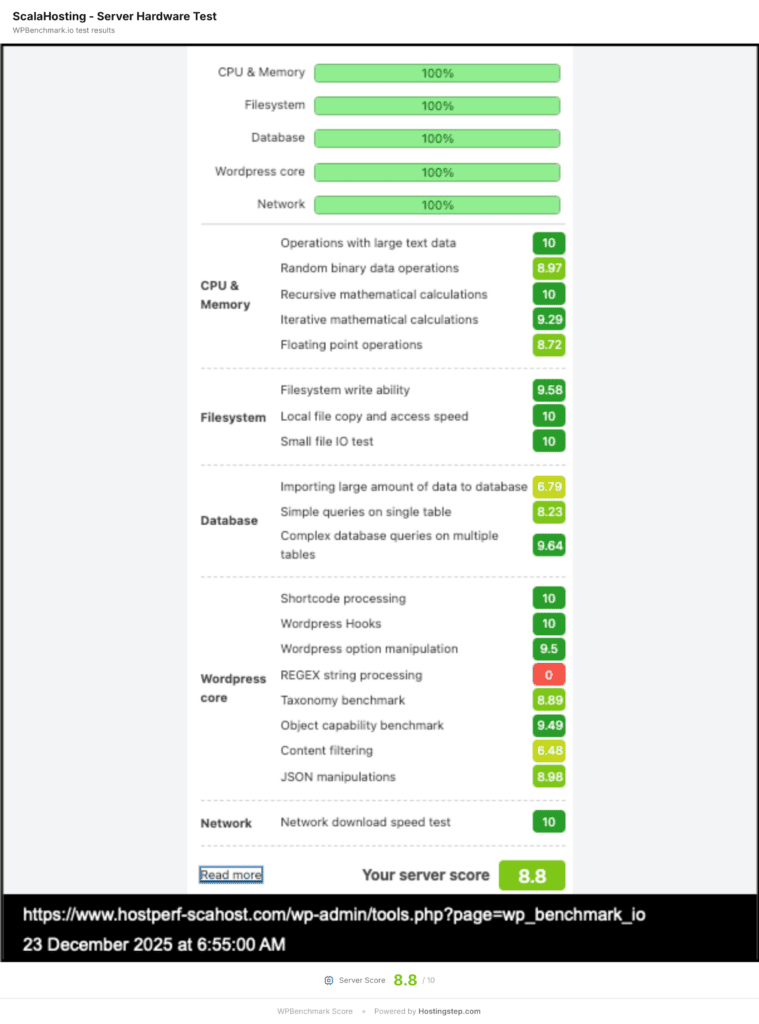
8.8 is a good score and is higher than many premium manager hosts such as WP Engine (6.5), Pressable (6.7) and WordPress.com (6.8). Hence, ScalaHosting has excellent server hardware among shared hosts under $5 per month.
Global TTFB
| Region | Avg TTFB | Best City | Worst City |
| Americas | 271ms | Dallas: 99ms | Santiago: 747ms |
| Europe | 449ms | Frankfurt: 394ms | Oslo: 524ms |
| Asia-Pacific | 743ms | Osaka: 488ms | Delhi: 1.2sec |
ScalaHosting recorded the best TTFB at Dallas with 99 ms and the worst at Delhi with 1.2 sec. While the average Global TTFB was somewhat okay for America with 271 ms, it was too bad for Europe and the Asia Pacific with 449 ms and 743 ms, respectively. This clearly means the host is ideal for websites that have a target audience in America and not at all ideal for sites with traffic outside America.
Sites with single region traffic can benefit from the automated Cloudflare CDN in terms of performance. The host makes it really simple for users with its automated Cloudflare integration.
ScalaHosting uses a static CDN, which means it delivers the cached content from the origin server. This is different from edge caching, where the content is delivered from different edge points located across the globe, which eventually results in faster delivery of content. This is why the performance is better in America and worse in Asia-Pacific
ScalaHosting vs Competitors
| Metric | ScalaHosting | Hostinger Biz | Bluehost | SiteGround | Cloudways |
| Rank | #3 | #5 | #14 | #22 | #17 |
| Score | 8.37 | 8.02 | 6.9 | 6.5 | 6.7 |
| TTFB | 465ms | 478ms | 520ms | 632ms | 424ms |
| Uptime | 99.97% | 99.98% | 99.95% | 99.97% | 99.99% |
| Load Test | 48ms / 0% | 31ms / 0% | 170ms / 9% | 170ms / 0% | 96ms/0% |
| Global TTFB | 501ms | 223ms | 345ms | 833ms | 444 ms |
| WPBench | 8.8 | 7.4 | 9.6 | 8.4 | 7.6 |
| CDN Type | Static | Static | Static | Addon | Addon |
| Included | Addon | Addon | Included | Addon | |
| Backups | Daily | Daily | Weekly | Daily | Daily |
| Intro Price | $2.95 | $3.69 | $3.99 | $3.99 | $16 |
| Renewal Price | $9.95 | $7.99 | $12.99 | $17.99 | $16 |
| Features Total | 8.5 | 7 | 6 | 7 | 5.5 |
ScalaHosting vs Hostinger Biz: ScalaHosting loses on Global TTFB and Renewal Price
ScalaHosting beats Hostinger Biz on hardware with 8.8 vs 7.4. Besides, both hosts recorded excellent load handling response time with 48 ms vs 31 ms. The actual difference starts with the global TTFB. While Hostinger recorded a global TTFB of 223 ms, ScalaHosting recorded a global TTFB of 501 ms, which makes Hostinger the clear winner.
ScalaHosting has slower speeds for global traffic, while Hostinger Biz is still ideal for global traffic with good global speeds. Another difference is in terms of renewal pricing. Hostinger Biz has lower renewal pricing than ScalaHosting with $7.99 vs $9.95. Sites with US based audiences should choose ScalaHosting and sites with global audiences should choose Hostinger. (See Hostinger review)
ScalaHosting vs Blueshost: ScalaHosting wins on Load handling and Renewal Price
ScalaHosting is better than Bluehost in every metric. ScalaHosting has better TTFB with 465 ms vs 520 ms, better uptime with 99.97% vs 99.95%, and stronger features with 8.5 vs 6.0. Bluehost has a slight edge over ScalaHosting on WPBench hardware score (9.6 vs 8.8). Besides, Bluehost recorded a better global TTFB with 345 ms vs 501 ms.
However, there is a big difference in terms of load handling and renewal price. ScalaHosting beats Bluehost by a big margin in load handling with 48 ms/ 0% errors vs 170 ms/9% errors. ScalaHosting’s renewal price is way less than that of Bluehost, with $9.95 vs $12.99. (See Bluehost review)
ScalaHosting vs SiteGround: ScalaHosting wins on Load handling and Pricing
ScalaHosting outperforms SiteGround with better TTFB (465 ms vs 632 ms), and better load handling (48 ms vs 170 ms). Besides, ScalaHosting has better features than SiteGround, with a score of 8.5 vs 7.0.
There is a big difference in the pricing. ScalaHosting has lower promotion pricing than SiteGround with $2.95 vs $3.99. Most importantly, while ScalaHosting’s renewal price is $9.95, SiteGround’s renewal price is much higher at $17.99. (See SiteGround review)
ScalaHosting vs Cloudways: ScalaHosting wins on Pricing
Cloudways is slightly better than ScalaHosting in most performance metrics. Cloudways has better TTFB with 424 ms vs 465ms, better uptime with 99.99% vs 99.97% and better global TTFB with 444 ms vs 501 ms. However, if you look at the values closely, the difference isn’t much and 444 ms global TTFB is still not a great TTFB. ScalaHosting has better load handling with 48 ms vs 96 ms and is excellent for a single region website.
Most importantly, ScalaHosting is the winner in terms of pricing. While ScalaHosting starts at $2.95 and renews at $9.95, Cloudways Vultr HF starts and renews at $16. This is like 5x more than ScalaHosting’s price. Hence, Cloudways isn’t the ideal host for anyone under a tight budget, while ScalaHosting is an excellent option to go with. (See Cloudways review)
Who Should Use ScalaHosting
US-based blogs and sites: ScalaHosting offers an average TTFB of 271 ms for America and a load handling of 48 ms at just $2.95 per month, making it an excellent host for sites with a US audience. Besides, the host’s 8.8 out of 10 WPBench score reflects excellent hardware strength to efficiently handle WordPress plugins.
WordPress sites with growth: WordPress sites with constant growth can benefit from ScalaHosting’s unlimited inodes and bandwidth with no hidden charges. Besides, ScalaHosting’s 48 ms/0% error load handling can handle traffic spikes without any problem.
Users who want free email hosting: Unlike many hosting services like Hostinger and Bluehost that offer email addons, ScalaHosting offers email hosting for free in the plan. Besides, the host offers SSL, migrations, and daily backups for no additional charge.
First-time buyers: The fact that ScalaHosting comes with an anytime unconditional money-back guarantee makes it really risk-free for first-time buyers. Besides, the host also allows users to refund unused months on a 36-month plan.
Who Shouldn’t Use ScalaHosting
Sites that depend on global traffic: ScalaHosting recorded a global TTFB of 501 ms, and the TTFF is worse over Asia Pacific with an average of 743 ms. We noticed sluggish loading in Delhi and Singapore, with 1.2 sec and 723 ms, respectively. Hostinger Business, with a global TTFB of 223 ms, and WP Engine, with a global TTFB of 169 ms, are the best choices for sites based on global traffic.
Users who require 100% uptime: ScalaHosting is not ideal for mission-critical sites that need 100% uptime since it recorded an uptime of 99.97% with 15 outages over 90 days. WordPress.com, Pressable, and WP Engine are the best hosts for mission-critical sites.
Users who look for a low renewal price: ScalaHosting’s starting plan costs $2.95, but at renewal, it costs $9.95, which is like a 237% increase from the promotional price. Even though there is anytime money back guarantee, the renewal price is just too much for any user under a tight budget. Hostinger Business, with a renewal price of $7.99, is comparatively more affordable than ScalaHosting.
Sites that need the fastest raw TTFB: ScalaHosting’s TTFB of 465 ms should be adequate for most sites. However, mission-critical sites that need TTFB below 400 ms should choose Pressable (341ms), WordPress.com (357ms), or WP Engine (367ms).
Our Verdict
ScalaHosting scored 8.37 out of 10, attaining the third position among 34 hosting providers in our 2026 rankings. It is the highest ranked shared hosting under $3 per month. ScalaHosting is suitable for sites with US based traffic with excellent TTFB, load handling, strong server hardware and unlimited bandwidth. Most importantly, there are no hidden charges.
Sites with traffic spread across the world should avoid going with ScalaHosting because of its poor global TTFB. Sites that need 1005 uptime or sub 400 ms or low renewal price should also avoid choosing ScalaHosting. Hostinger Business is a good alternative for such sites with better global reach (223 ms), and lower renewal ($7.99).
ScalaHosting starts at a promotional price of $2.95 and renews at $9.95 per month, which is like a 237% increase. However, the host offers an anytime unconditional money-back guarantee on unused months.
This ScalaHosting review is based on 1,104 performance tests conducted between October 2025 and January 2026 using advanced tools like Pingdom, Loader.io, SpeedVitals, and WPBenchmark.
Methodology
Hosting accounts we use for testing are bought with our funds and are not promotional accounts. We use tools like Pingdom for TTFB and Uptime, Loader.io for load testing, WPBenchmark for server hardware testing and SpeedVitals for global TTFB.
We conduct over 525,600 tests per provider per year and we monitor every minute, 24/7 with testing locations over 40 cities across America, Europe, Asia Pacific. ScalaHosting scored 60% on performance, 30% on features, and 10% on value in 2025 Q4. We tested 34 hosting providers in total.

Mohan Raj is the founder of Hostingstep.com, where he oversees the independent testing of 25+ web hosting providers. He conducts 525,600+ performance tests per year across 60+ global locations to measure TTFB speed, uptime, load test, core web vitals, and hardware benchmarks. Each provider is tested using independently purchased hosting accounts, backed by verifiable data.