WPX Hosting Review 2026
WPX currently hosts 52,452 live websites according to publicly available datasources. The data also shows, WPX is one of the top 10 fastest growing web hosting providers in the entire WordPress hosting industry.
WPX Homepage speaks lot about speed; let it be website speed or faster site migrations or faster customer support. We decided to test them out.
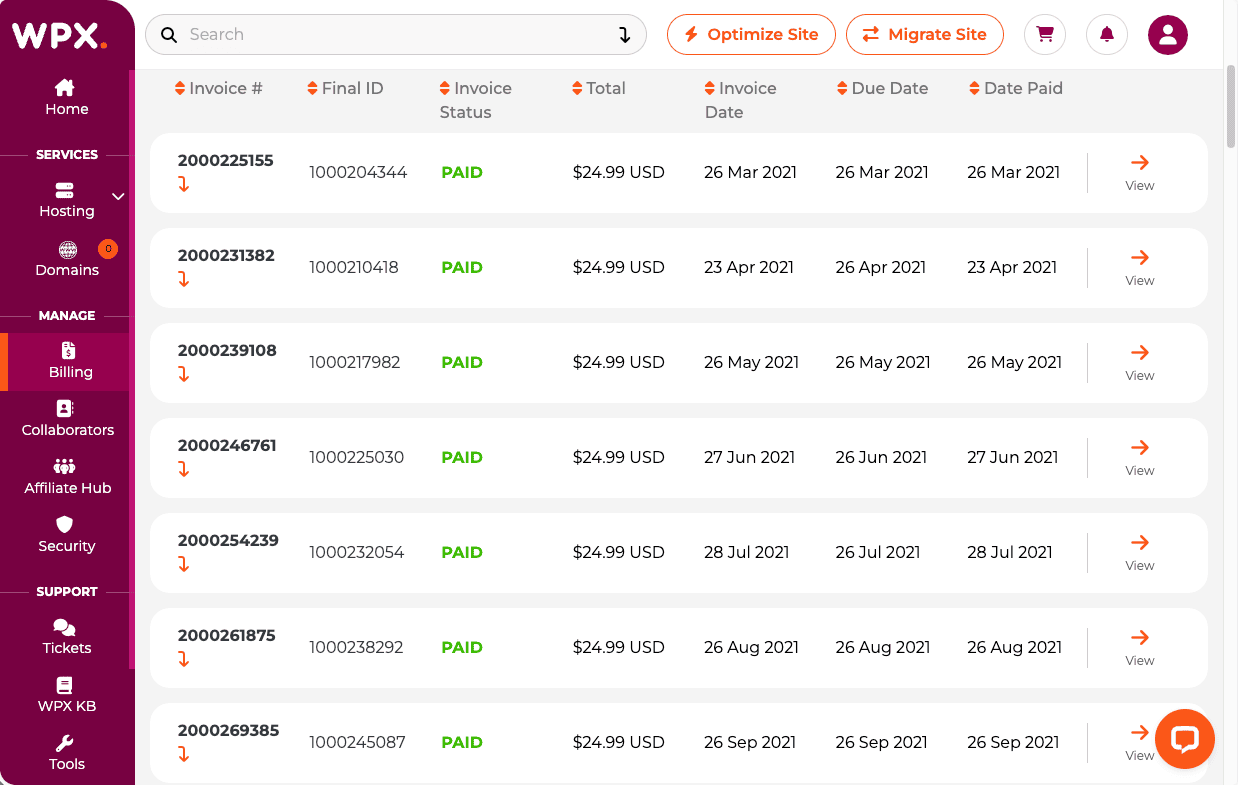
We bought their Business Web hosting plan at $24.99/month on 26 March 2021 and have been continually testing them 24/7 across 5 different performance tests.
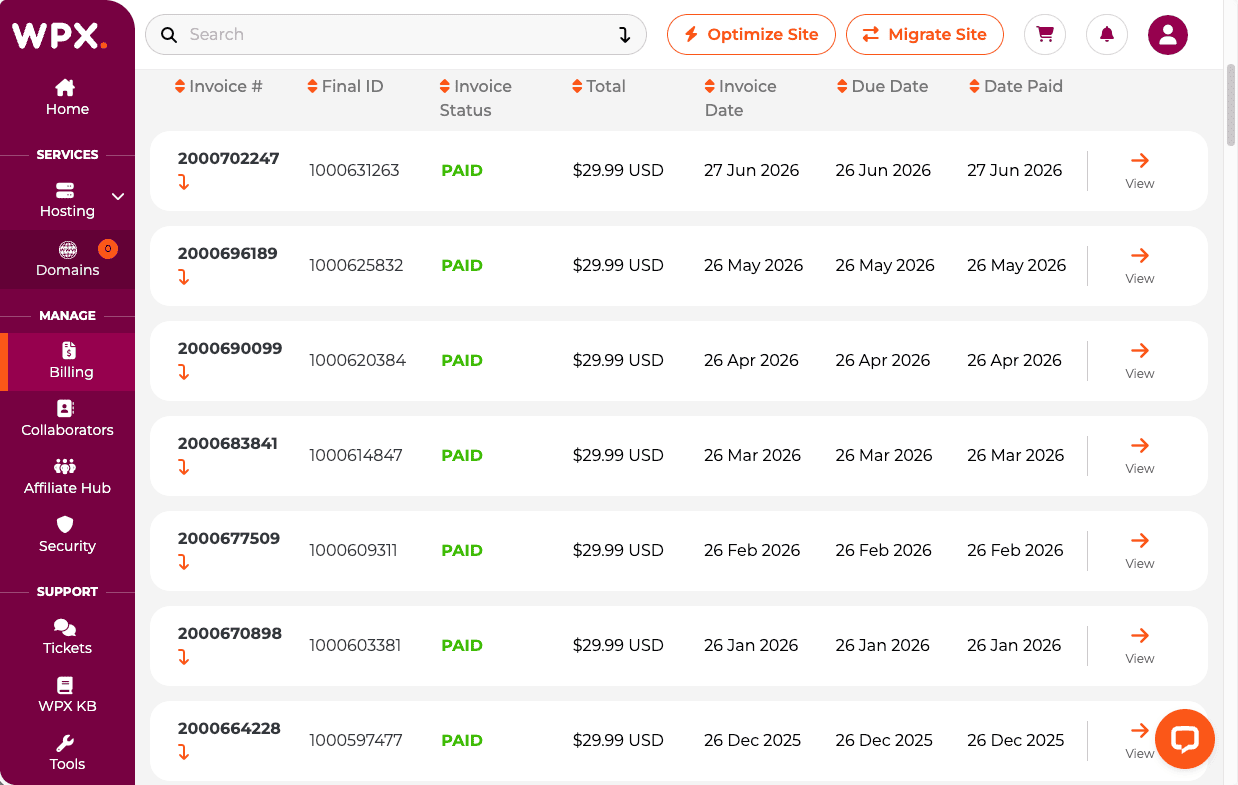
We paid our last invoice in 27 June 2026 and collected over 5 years (60 months) of performance data. This is more than enough to evaluate the company across different performance parameters.
How we test WPX Hosting?
WPX Hosting is tested using our standard methodology which involves using a fixed WordPress theme and set of WordPress plugins to emulate a real-world site. We use the same setup across all our 29 other hosting services we’ve tested to bring a fair apple-to-apple comparisons.
We conduct 5 different performance tests:
- TTFB (speed)
- Uptime
- Load Handling
- WPBenchmarks
- and Global TTFB.
The TTFB and Uptime is measured using Pingdom Synthetic monitoring tool where the WPX test site is monitored every 60 seconds once to calculate the score.
Load Handling, WPBenchmarks, Global TTFB are one-shot tests done using differnet tools to measure its performance. More about this are dicussed in respective sections.
Our Verdict:
WPX Hosting scored 8.4 out of 10 in our WordPress hosting rankings and we put them in Strong Performance Tier Category. The host recorded 459ms speed, 99.9948% uptime, 45ms load handling response time, 240ms global TTFB and 6.5 in WPBenchmarks score.
Performance Overview
| Metric | Result | Score (/10) | Rating |
| TTFB (US) | 459ms | 7 | Strong |
| Uptime | 99.99% | 9.5 | Elite |
| Load Test | 45ms | 9 | Strong |
| Global TTFB | 240ms | 6 | Strong |
| Server Hardware | 6.5 | 6.5 | Average |
| Performance Total | 8.44/10 | Excellent |
TTFB Response Time
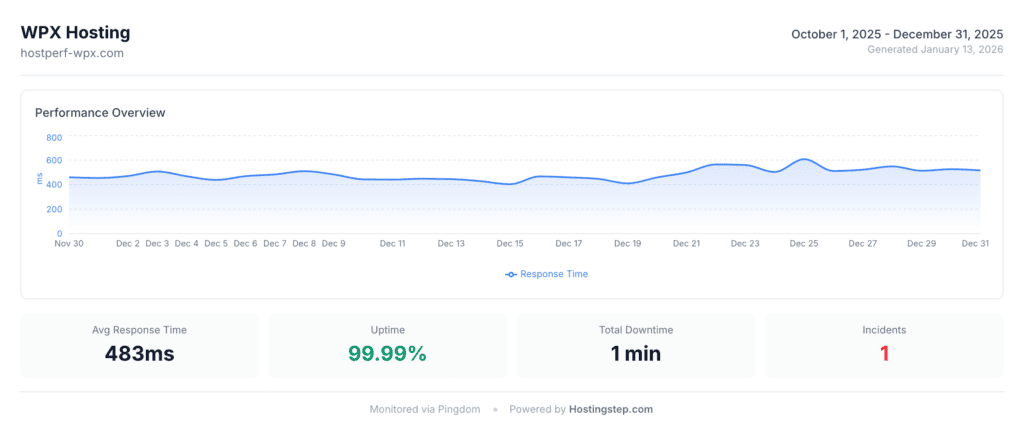
WPX Hosting recorded a TTFB of 483 ms in Q4 2025, scoring 7 out of 10 and the performance falls in the mid pack bracket of 450 ms to 500 ms.
We began our TTFB monitoring from mid 2021 and the host recorded a TTFB of 278 ms that year. However, that was only partial monitoring. The host recorded 339 ms in 2022, and we saw a slight improvement in 2023 with a TTFB of 330 ms.
However, since 2023, the TTFB response showed a negative trend with 365 ms in 2024, 411 ms in 2025 (full year) and 483 ms in Q4 2025.
| Year | Avg TTFB | Uptime | Days Monitored | Tests | Outages |
| 2021 | 454ms | 99.92% | 278 (partial) | 80,064 | 18 |
| 2022 | 339ms | 99.996% | 364 | 104,832 | 11 |
| 2023 | 330ms | 100.00% | 365 | 105,120 | 0 |
| 2024 | 365ms | 99.9996% | 366 | 105,408 | 2 |
| 2025 | 411ms | 99.997% | 365 | 105,120 | 9 |
| Q4 2025 | 483ms | 99.99% | 92 (quarter) | 26,496 | — |
The peak era was during 2022 to 2023 and WPX was genuine fast with TTFB in the 330 ms to 340 ms range, scoring 9 out of 10 by our current scale. Since 2023, TTFB has only worsened with a 50 ms increase in average response time per year on average.
Uptime
WPX recorded an uptime of 99.99% in Q4 2025, scoring 9.5 out of 10, which places it in the top tier category, indicating excellent reliability.
As we look at the historical trend, the host recorded 100% uptime with zero outages in 2023 and 99.9996% with 2 outages amounting to 9 minutes downtime in 2024, which is also near perfect.
However, the uptime performance has slightly declined in 2025 with 99.997% with 9 outages amounting to 16 minutes downtime. While the Uptime performance is still strong, the outages have gone up from 2 in 2024 to 9 in 2025.
2021 has been the worst year in terms of uptime with 99.92% and 18 outages with a total of 323 minutes downtime. The worst single day uptime in 2021 was 79.10%. It’s important to mention that the 2021’s uptime monitoring started mid-year and early monitoring might have included setup and stabilization artifacts.
However, the data of 2022 shows dramatic improvement with an uptime of 99.996% with 11 outages with a total of 22 minutes downtime.
WPX’s 99.99% uptime means a downtime of approximately 4.3 ms over 3 months. For most sites, it’s just more than adequate. Uptime is WPX’ strongest performance metric and this will keep small sites up and running even while load handling and TTFB is deteriorating.
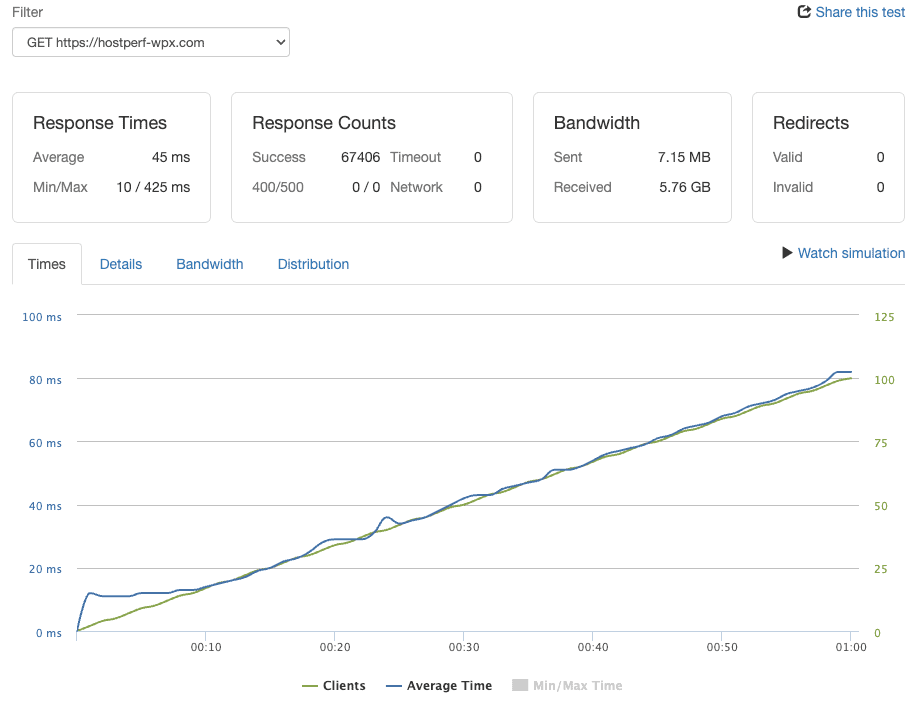
Load Handling
WPX hosting has recorded 45ms response time in our load testing.
In our earlier report, we have mentioned WPX hosting has got 56% of errors as our test is blocked by WPX security settings.
We have coordinated with the WPX team to temporarily enable the security settings at the server level, which enabled us to perform load testing in July 2026.
The response time is on par with many managed WordPress hosting services and WPX is excellent at handling the real-world traffic faster.
Server Hardware (WPBench)
WPX secured a WPBench score of 6.5 out of 10, which is mid range.
As we compare the performance with field leaders, Bluehost scored 9.6, ScalaHosting scored 8.8, Kinsta scored 8.8, and SiteGround scored 8.4 while WPX’s 6.5 is below average for its price point of $29.99.
Kinsta achieved 8.8 for a price point of $30 per month while WP Engine at $23 per month has the same WP Bench score as WPX in spite of being $7 lesser in cost to WPX.
Hostinger Business at an intro price of $3.69 per month scored 7.4, which indicated better hardware for a price which is 88% lesser than that of WPX.
If we look at the server allocation for the WPX Business plan, it comes with 1 CPU core, 5 GB RAM, 20 GB storage at $29.99 per month. However, the resources are just too limited for such a high price point.
WPX’s 6.5 WPBench indicates adequate raw server strength for standard WordPress sites. However, the server allocation may not be sufficient for plugin heavy sites or WooCommerce stores with complex database queries compared to what Kinsta or Bluehost offers with a WPBench score of 8.8 and 9.6 respectively.
Global TTFB
WPX recorded an average global TTFB of 240 ms, scoring 8 out of 10, which is strong for a host that comes with edge CDN.
The scores are excellent across most of the Americas location. While we noticed some of the hosts are slowing down in southern American countries like Mexico and Chile, however WPX scored incredibly well in all these locations.
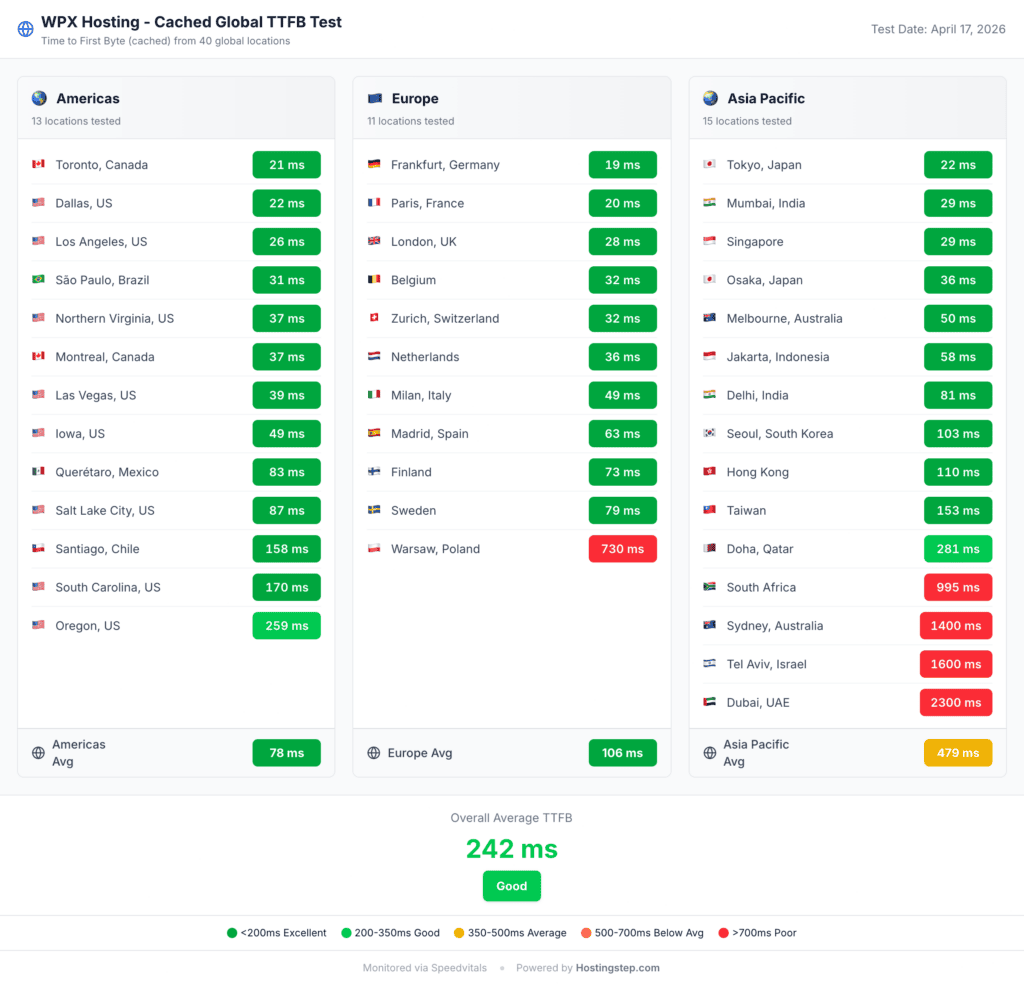
WPX recorded an average global TTFB of 106 ms in Europe, which is a strong performance for an edge CDN host. It’s again incredible to see excellent scores of below 100ms across all the European locations, apart from Warsaw, Poland.
Similarly, the average of Asia Pacific is 479 ms, which is quite average in Asia Pacific too. Most of the locations are getting good scores, apart from a few locations like South Africa, Australia, Israel and Dubai where the scores are skyrocketed above 1 second.
To give you a clear understanding on how we test the global TTFB, is that we test the site across 40 location for at least 3 times to get the cached TTFB data.
While most hosts with Edge CDN usually gets Cache HIT and delivers below-100ms TTFB, however, WPX is inconsistent where even after 5 times, the cache HIT still didn’t happen. This may not happen all the times but we can’t ignore the factor that Cache HIT is not happening.
So, users needs to continusoly test their site to see if the Edge caching is properly working for thier sites hosted with WPX.
WPX vs Competitors
| Metric | WPX | WP Engine | Kinsta | Cloudways | Hostinger |
| Score | 8.4 | 7.98 | 7.02 | 6.70 | 8.02 |
| Tier | Strong | Elite | Strong | Strong | Strong |
| TTFB | 483ms | 367ms | 469ms | 424ms | 478ms |
| TTFB Score | 7/10 | 9/10 | 7/10 | 8/10 | 7/10 |
| Uptime | 99.99% | 100% | 99.97% | 99.99% | 99.98% |
| Load Test | 41 | 27ms / 0% | 40ms / 0% | 96ms / 0% | 31ms / 0% |
| Load Score | 0/10 | 10/10 | 9/10 | 7/10 | 9/10 |
| Global TTFB | 611ms | 169ms | 416ms | 444ms | 223ms |
| Global Score | 6/10 | 10/10 | 8/10 | 8/10 | 10/10 |
| WPBench | 6.5 | 6.5 | 8.8 | 7.6 | 7.4 |
| CDN | Edge | Edge | Edge | Addon | Static |
| Included | None | None | Addon | Addon | |
| Backups | Daily | Daily | Daily | Daily | Daily |
| Features | 10.0/10 | 7.0/10 | 7.0/10 | 5.5/10 | 7.0/10 |
| Intro Price | $14.99 | $23.00 | $30.00 | $16.00 | $3.69 |
| Renewal | $14.99 | $30.00 | $30.00 | $16.00 | $7.99 |
| Metric | WPX | SiteGround | Bluehost |
| Score | 8.4 | 6.50 | 6.90 |
| Tier | Below Avg | Below Avg | Average |
| TTFB | 483ms | 632ms | 520ms |
| TTFB Score | 7/10 | 4/10 | 6/10 |
| Uptime | 99.99% | 99.97% | 99.95% |
| Load Test | 45ms | 170ms / 0% | 170ms / 9% |
| Load Score | 9/10 | 6/10 | 6/10 |
| Global TTFB | 611ms | 833ms | 345ms |
| Global Score | 6/10 | 4/10 | 9/10 |
| WPBench | 6.5 | 8.4 | 9.6 |
| CDN | Edge | Addon | Static |
| Included | Included | Addon | |
| Backups | Daily | Daily | Weekly |
| Features | 10.0/10 | 7.0/10 | 6.0/10 |
| Intro Price | $14.99 | $3.99 | $3.99 |
| Renewal | $14.99 | $17.99 | $12.49 |
WPX vs WP Engine
WP Engine clearly beats WPX in almost all fields.
WP Engine wins on TTFB with 367 ms vs 483 ms, Uptime with 100% vs 99.99%, Load test with 27ms vs 45ms, and global TTFB with 169 ms vs 240 ms.
WPX wins on features for including email hosting, while WP Engine doesn’t come with free email hosting. WP Engine wins on pricing being $7 per month cheaper than WPX with $23 vs $29.99.
Even though both hosts claim edge CDN, WP Engine delivers faster global average with 169 ms vs 240 ms as it uses Cloudflare Enterprise vs WPX’s own CDN.
None of the hosts have an edge in terms of renewals. WPX comes with a flat renewal while WP Engine renews at $30.
You can choose WPX only if you need email hosting included for no extra cost but if a strong performance means a lot for you, you must choose WP Engine over WPX. (Check WP Engine Review)
WPX vs Kinsta
While WPX and Kinsta have nearly identical pricing with $29.99 per month vs $30.00 per month, Kinsta has a leading edge in almost all metrics.
Kinsta and WPX holds similar on load handling at 40ms vs 45ms, while in Global TTFB WPX rocks at 240ms vs Kinsta’s 416ms, indicates Kinsta is slower for global reach.
Kinsta beats WPX by a slight margin on TTFB with 469 ms vs 483 ms. WPX wins on features for included email while Kinsta has no email hosting.
Besides, WPX wins on Uptime with 99.97% vs 99.99%. You can choose WPX on most use cases.
WPX vs Hostinger Business
Hostinger costs 88% less than WPX with $3.69 vs $29.99 yet outperforms WPX on all metrics. This is the comparison that hurts WPX the most.
Hostinger wins on load test with 31 ms vs 45ms on WPX, and a similar Global TTFB score with 223 ms vs 240ms.
The TTFB is nearly identical with 478 ms vs 483 ms.
WPX wins on features with 10 vs 7 for its included email while Hostinger offers an addon alone.
Hostinger Business renewal price is $17.99 per month cheaper than WPX’s renewal, which is a flat $29.99. You can also host up to 50 websites on Hostinger while WPX is limited to 5 websites.
Hostinger wins comfortably over WPX. (Check Hostinger Review)
WPX vs Bluehost
Bluehost wins on price with $3.99 vs $29.99, which makes it 87% cheaper than WPX.
Besides, the host is Average tier with 14 while WPX is Below Average with 19. Bluehost wins on load handling with 170 ms/9% vs FAILED, global TTFB with 345 ms vs 611 ms, and hardware WPBench with 9.6 vs 6.5, the highest scorer in this field.
However, WPX wins on TTFB with 483 ms vs 520 ms, which makes it 37 ms faster. Besides, the host wins on Uptime with 99.99% vs 99.95% and features with 10 vs 6 for edge CDN vs static CDN, included email vs addon and daily backups vs weekly backups.
Bluehost wins on renewals with $12.49 per month vs $29.99 per month, which makes it $17.50 per month cheaper than WPX. You can choose WPX over Bluehost if you need the convenience of managed WordPress with included email, daily backups. (Check Bluehost Review)
WPX vs SiteGround
Both hosts are Below Average tier but SiteGround is 87% cheaper than WPX with $3.99 vs $29.99. SiteGround has a slightly higher score than WPX with 6.5 vs 6.4. While WPX wins on TTFB with 483 vs 632 ms, Uptime with 99.99% vs 99.97% and features 10 vs 7, SiteGround wins on load handling with 170 ms/0% vs FAILED and hardware WPBench score with 8.4 vs 6.5. WPX has slightly lesser average response time than SiteGround in Global TTFB with 611 ms vs 833 ms but both scores are poor.
SiteGround renewal is 6x more than the intro price with $17.99 per month while WPX follows a flat renewal with $29.99. However, SiteGround is $12 per month cheaper at renewals. Both hosts are underperformers but SiteGround costs 87% less than WPX. WPX, on the other hand, has better features but the host failed the load test. You can choose WPX if only you need edge CDN, included email and if you are not concerned about load handling. (Check SiteGround Review)
Who Should Use WPX Hosting?
WPX is excellent hosting choice for websites with US as well as global visitors. We found their speed is excellent, uptime is strong, load handling is great.
It is also one of the very few managed WordPress hosts that offers Email hosting included, which is a great value addition for website owners who are one a budget.
Who Should NOT Use WPX Hosting?
If you are a budget consious user, WPX might be a overkill for you.
For example, Bluehost starts at $1.99/month and renews at $8.99/month. The performance is much similar to WPX in most aspects like TTFB, uptime, load handling and even better scores at Global TTFB and WPBenchmarks.
Even better, the Bluehost Starter plan starts at $3.99/month and renews at $9.99/month allows up to 10 website hosting. This plan outperforms WPX in both performance and feature and it easily raises the question on why you need to invest in a premium priced WPX hosting.
WPX Hosting Review 2026 - Hostingstep

WPX is our top recommended affordable managed WordPress hosting in 2024. WPX recorded an average TTFB of 329 ms, ranking #3 in the fastest TTFB, and also secured 100% uptime, making it both faster and reliable. It also recorded 32 ms in the load handling test, one of the top scores in the category
Product Currency: USD
Product Price: 14.99
Product In-Stock: InStock
4.2

Mohan Raj is the founder of Hostingstep.com, where he oversees the independent testing of 25+ web hosting providers. He conducts 525,600+ performance tests per year across 60+ global locations to measure TTFB speed, uptime, load test, core web vitals, and hardware benchmarks. Each provider is tested using independently purchased hosting accounts, backed by verifiable data.