Summary: WP Engine outperforms Kinsta in most performance tests like response time, uptime, load handling and Global TTFB. Meanwhile, Kinsta is rock solid with server hardware score outperforming WP Engine by a big margin. The performance data discussed here is collected between November 1, 2025 and August 31, 2026. If you are looking for raw performance, WP Engine is a solid choice. If you are looking for higher hardware performance where a CDN doesn’t work out, Kinsta should be your choice for WooCommerce, LMS or any high workload sites.
We have been paying customers of both Kinsta and WP Engine since 2020. We have attached our invoices and our methodology used to collect the data. Both hosts are also tracked in our WordPress hosting benchmarks. While Kinsta had a better performance from 2020 to 2023, WP Engine introduced true edge caching in Q3 2024, which made their performance skyrocket. It also improved their uptime, which tells a different story that WP Engine is not just masking the site with edge CDN, but it made a complete infrastructure overhaul for better performance.
Our Verdict:
| Metric | Kinsta | WP Engine | Winner |
|---|---|---|---|
| Average response time | 424ms | 362ms | WP Engine |
| Uptime | 99.98% (6 outages, 46 minutes) | 99.99% (2 outages, 29 minutes) | WP Engine |
| Load handling (100 users, 60 seconds) | 36ms, 0% errors | 27ms, 0% errors | WP Engine |
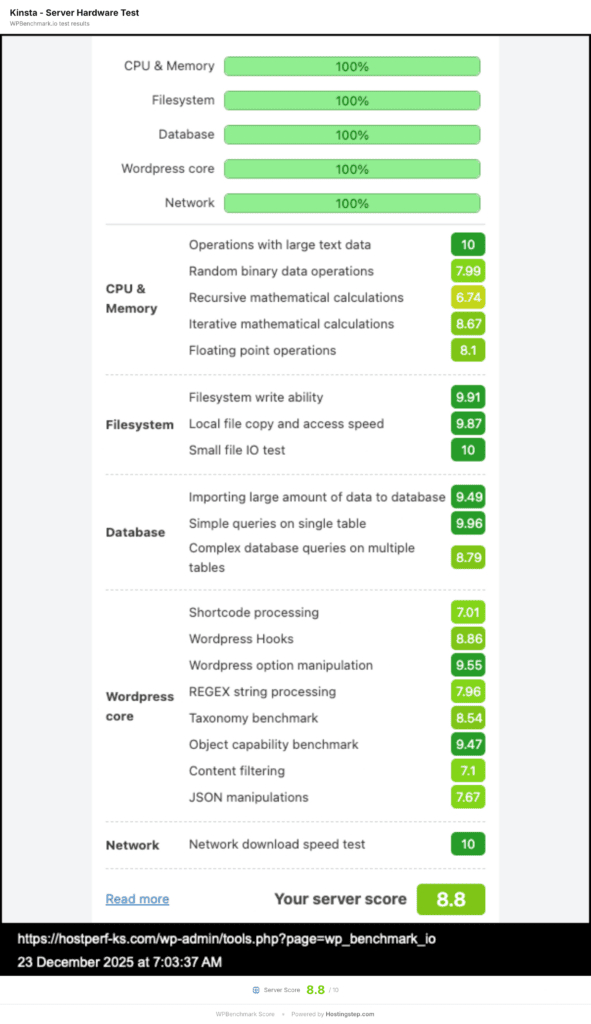
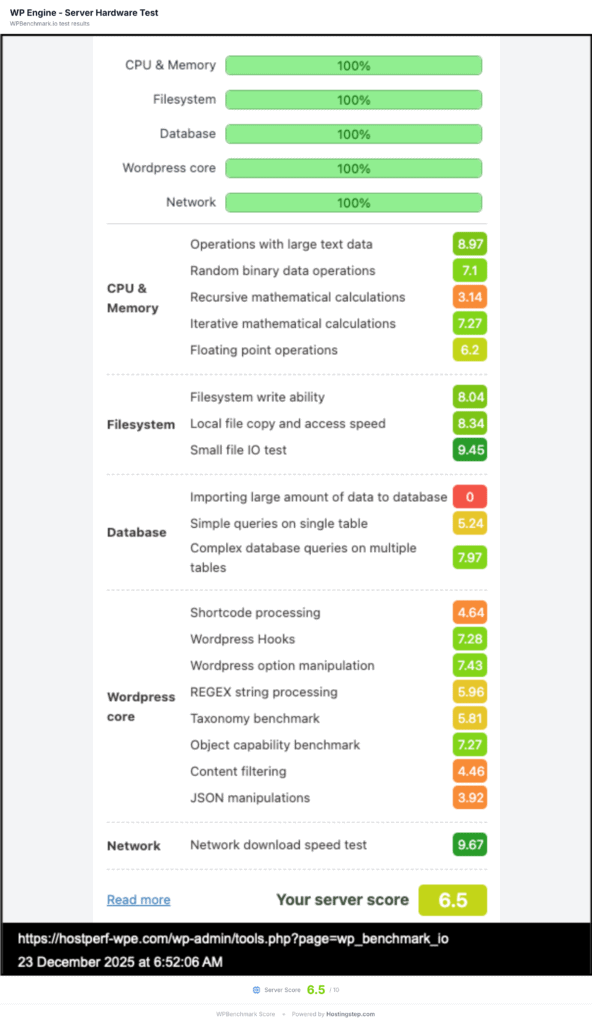
| Server hardware (WPBench) | 8.8/10 | 6.5/10 | Kinsta |
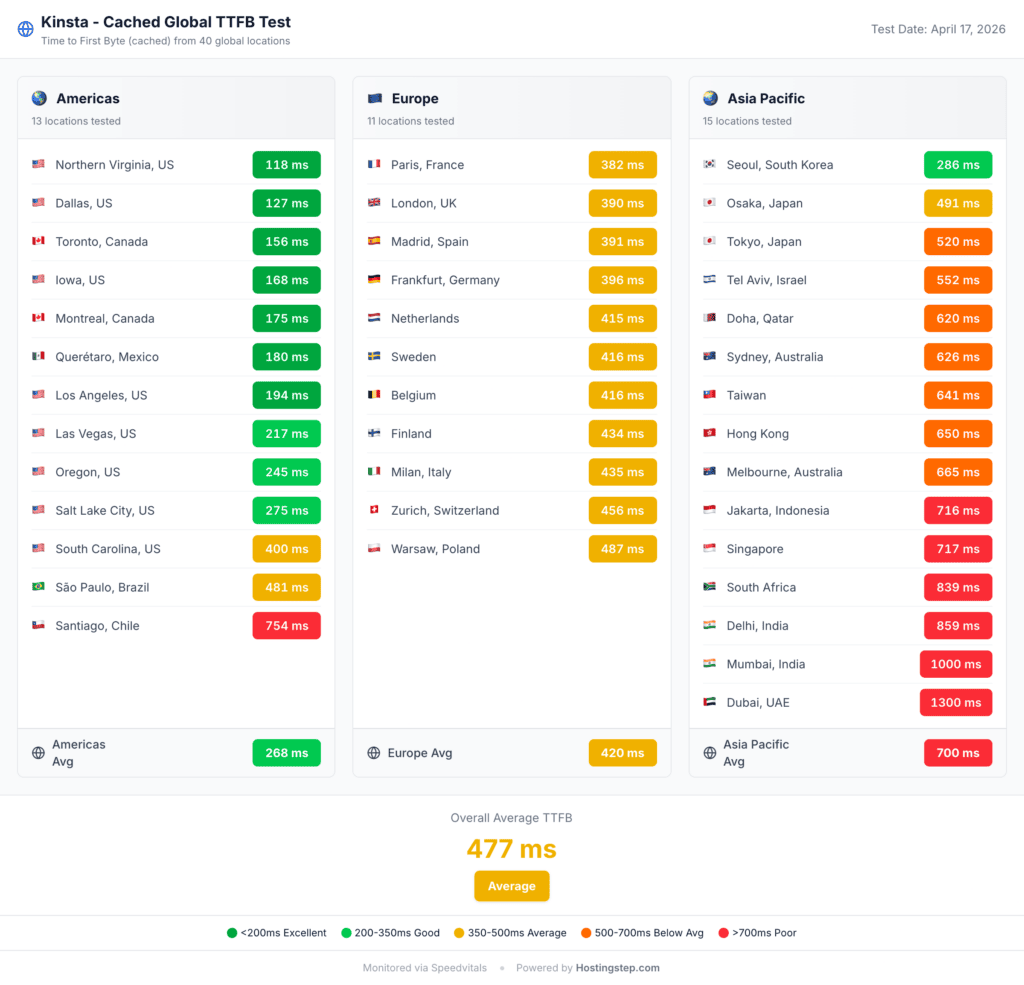
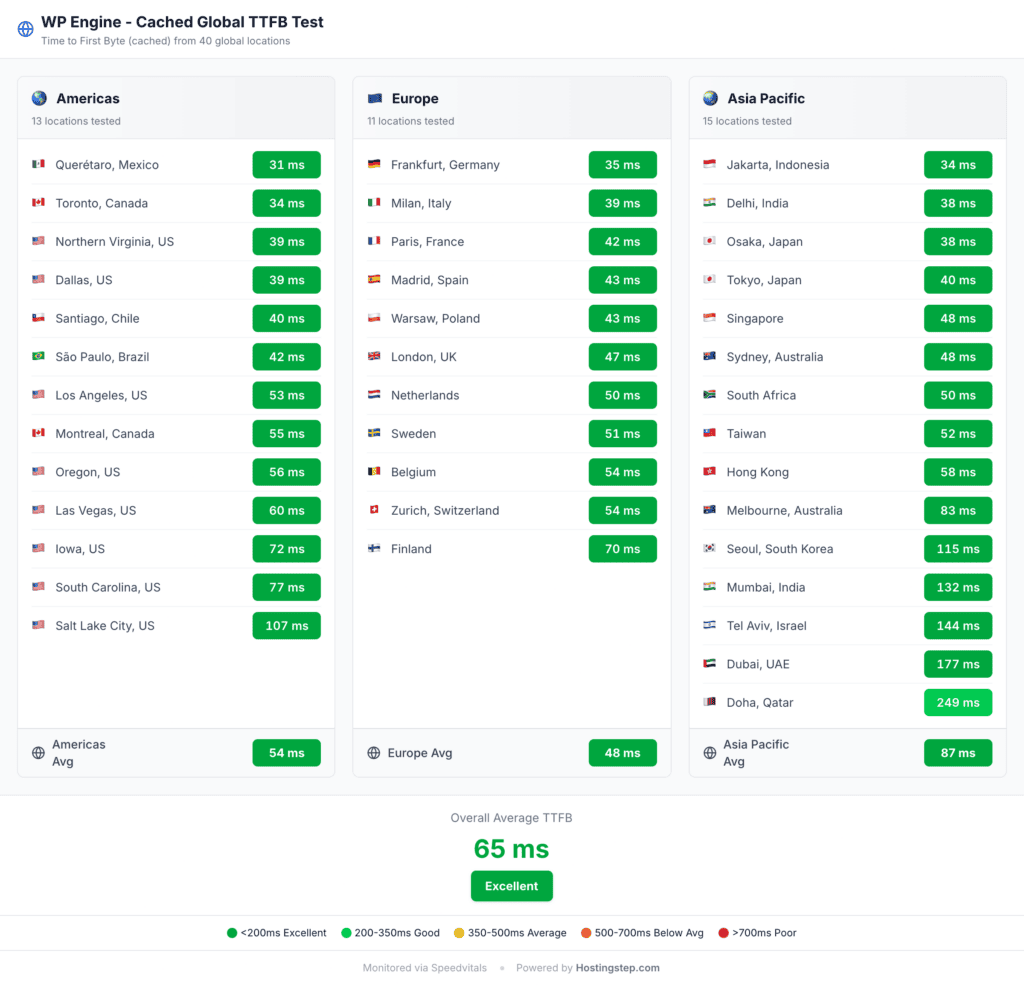
| Global TTFB (40 locations, cached) | 477ms | 65ms | WP Engine |
| Visit Kinsta.com | Visit WPEngine.com |
Kinsta vs WP Engine: Speed
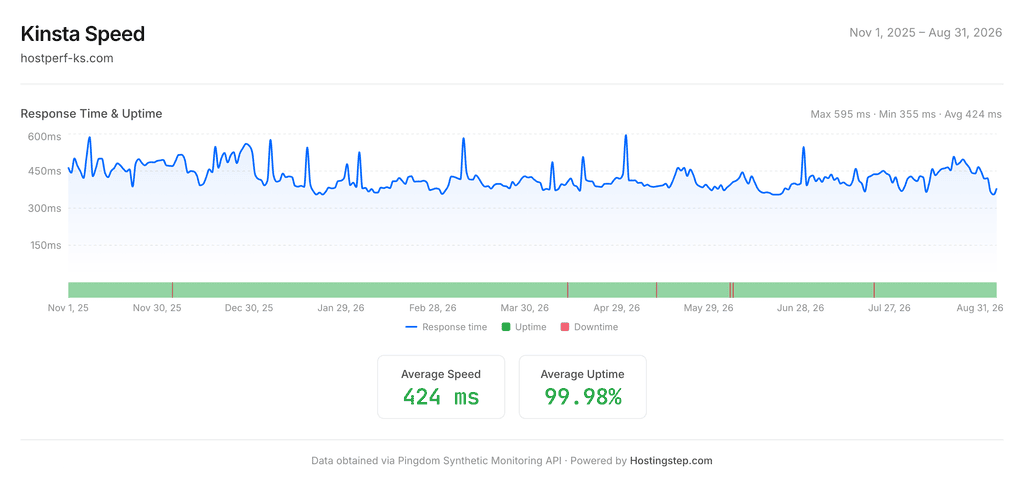
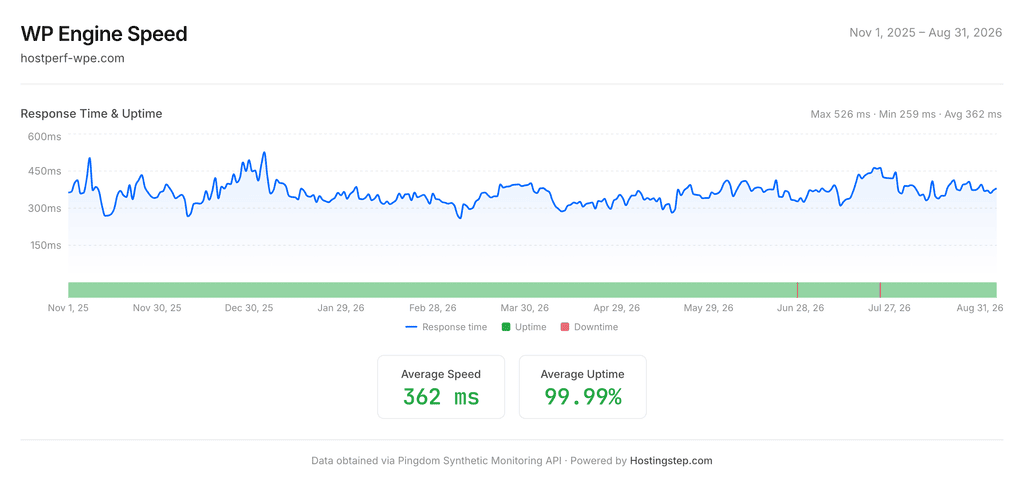
WP Engine outperforms Kinsta by at least 100 ms in raw response time speed. WP Engine recorded 362 ms response time while Kinsta recorded 424 ms in the same time period. The major difference is WP Engine offers true edge caching, which reduces the response time, while Kinsta, though advertised as offering edge caching, is not as fast as WP Engine.
| Speed metric | Kinsta | WP Engine |
|---|---|---|
| Average response time | 424ms | 362ms |
| Fastest month | 393ms (June 2026) | 331ms (April 2026) |
| Slowest month | 486ms (December 2025) | 394ms (July 2026) |
| Fastest single reading | 355ms | 259ms |
| Slowest single reading | 595ms | 526ms |
Kinsta vs WP Engine: Uptime
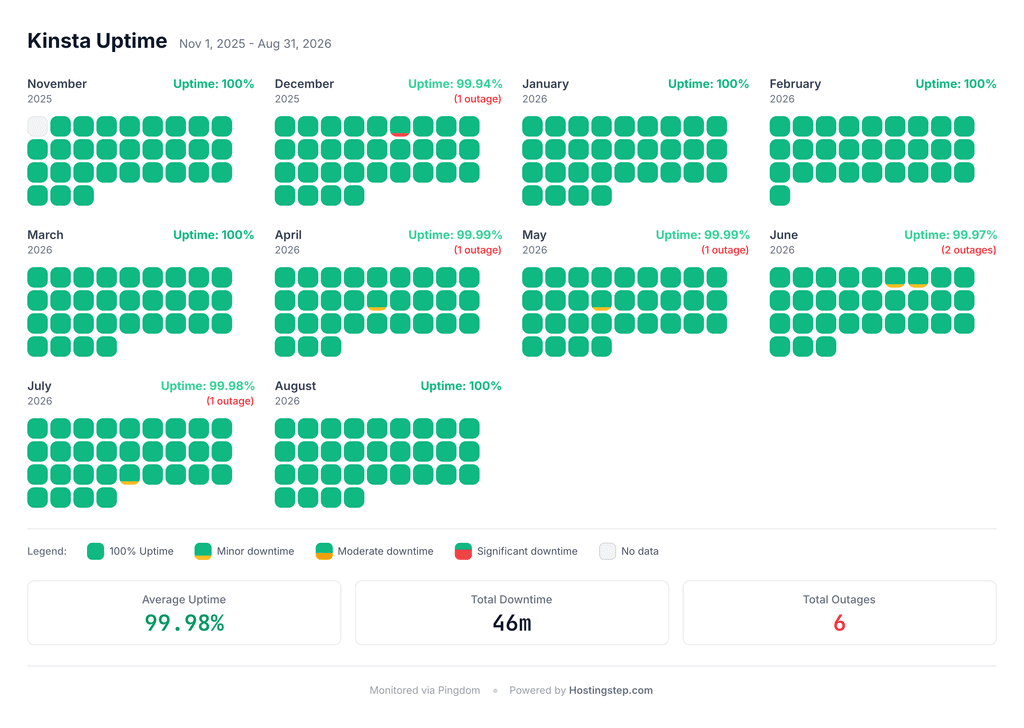
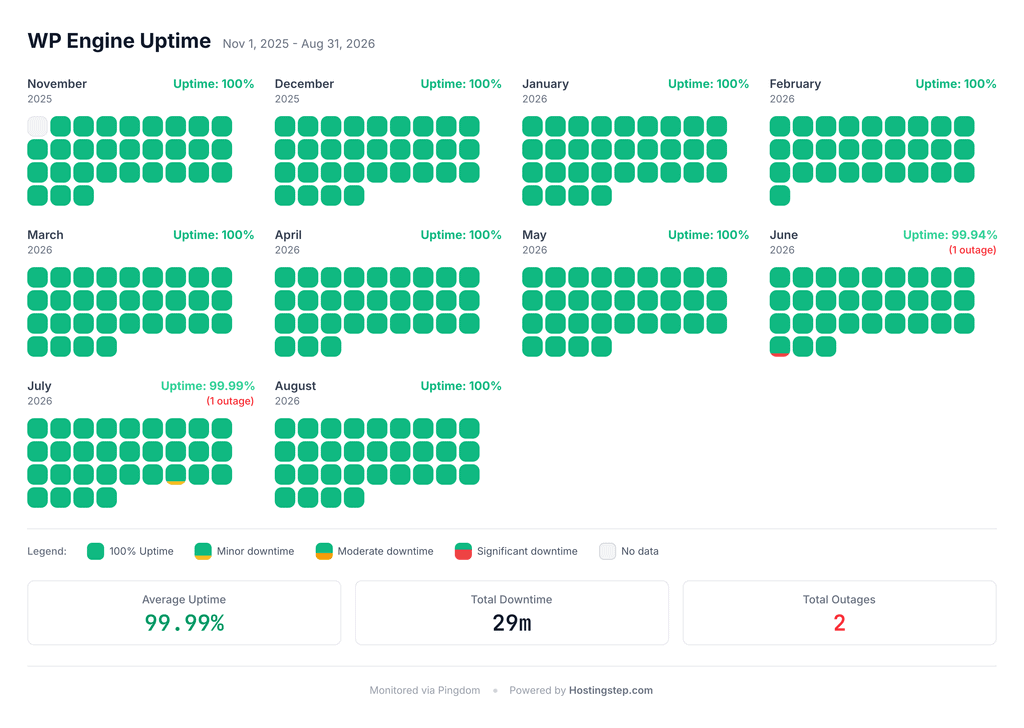
WP Engine wins over Kinsta in uptime testing. While WP Engine recorded 99.99% uptime with just 2 outages for 29 minutes, Kinsta recorded 99.99% uptime with 6 outages totalling 46 minutes. The outage issue of Kinsta is mainly caused by Cloudflare outages which is a part of Kinsta’s infrastructure, though there is no issue with Kinsta’s origin data center. However, WP Engine too had the same infrastructure as Kinsta with Google Cloud as origin and Cloudflare on Edge, but they managed to run without any issues. Out of 2 outages of WP Engine, one lasted 25 minutes, which was a scheduled maintenance outage.
| Uptime metric | Kinsta | WP Engine |
|---|---|---|
| Uptime | 99.98% | 99.99% |
| Exact figure | 99.9893% | 99.9933% |
| Separate outages | 6 | 2 |
| Total downtime | 46 minutes | 29 minutes |
| Months at 100% | 5 of 10 | 8 of 10 |
Kinsta vs WP Engine: Load Handling
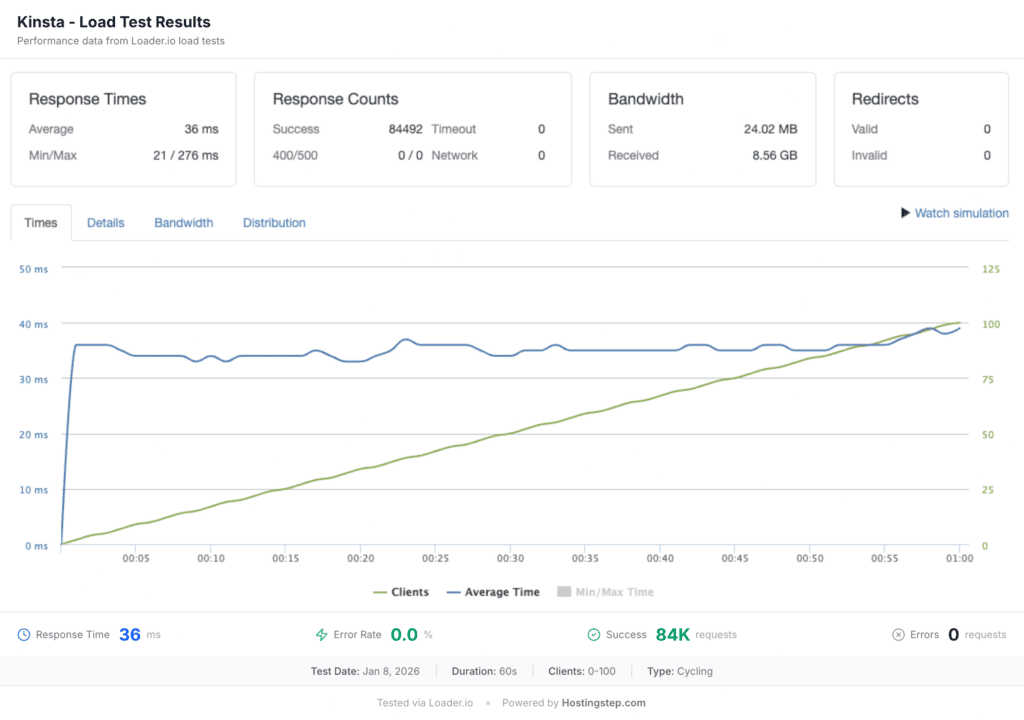
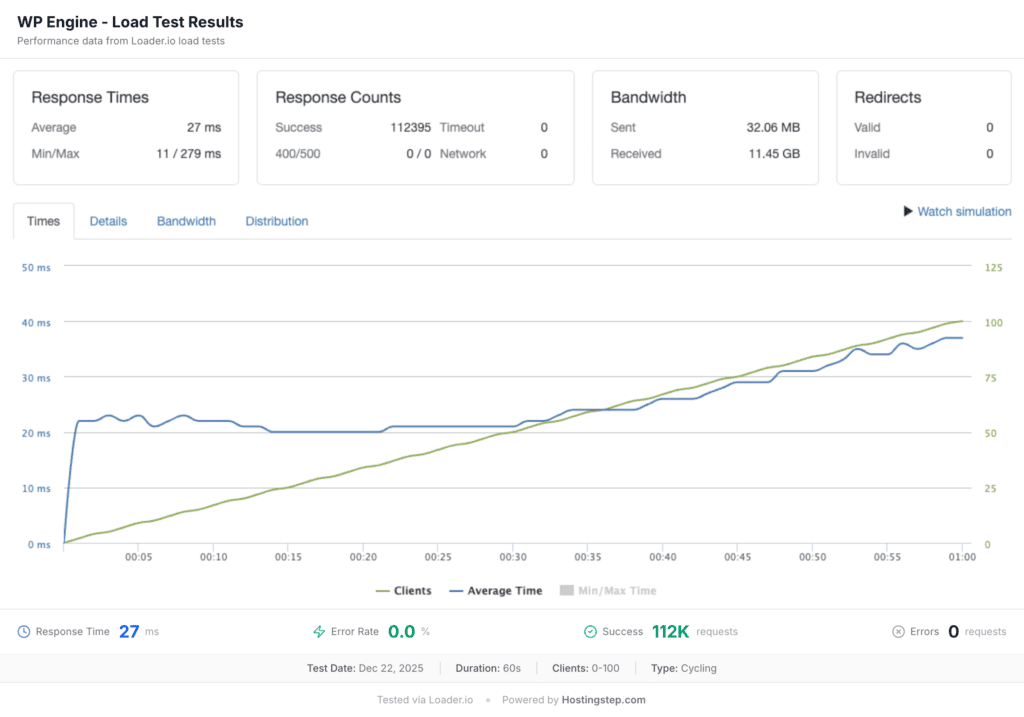
WP Engine outperforms Kinsta in load handling by a thin margin. There is less than a ~10ms difference in response time, so it’s generally a tie. Both Kinsta and WP Engine handle traffic load faster.
| Load test | Kinsta | WP Engine |
|---|---|---|
| Average response under load | 36ms | 27ms |
| Successful requests | 84,492 | 112,395 |
| Errors | 0 (0.00%) | 0 (0.00%) |
| Test date | January 8, 2026 | December 22, 2025 |
Kinsta vs WP Engine: Hardware server performance
Kinsta outperforms WP Engine by a big margin. Kinsta recorded a WPBench score of 8.8 while WP Engine recorded 6.5. In simple terms, a higher score indicates you have been allocated higher server resources and it’s essential to run high workload sites faster. WP Engine offers fast response time primarily due to CDN edge caching while their server hardware scores are average. However, Kinsta offers better server hardware, which is good for sites where CDN can’t do its work. For example, in a WooCommerce cart page or an LMS site or even your WordPress backend, CDN won’t have a role there. For this case, Kinsta offers you the better performance. We have been testing nearly 10 managed WordPress hosting providers including Pressable, Rocket.net, Liquid Web, etc., but nothing comes close to the hardware/server resources score offered by Kinsta. So if you are looking for a host for your high workload site, Kinsta should be your only ultimate choice.
| Server hardware | Kinsta | WP Engine |
|---|---|---|
| WPBench score | 8.8/10 | 6.5/10 |
| Public report | View report | View report |
Kinsta vs WP Engine: Global TTFB
WP Engine outperforms Kinsta by a big margin in the Global TTFB test. WP Engine recorded an average response time of 65ms while Kinsta recorded 477ms. So if you are running a site with global visitors, WP Engine should be your only choice. If you like Kinsta, then I recommend you use Cloudflare APO at $5 per month separately to get performance similar to WP Engine.
| Global TTFB | Kinsta | WP Engine |
|---|---|---|
| Overall average | 477ms | 65ms |
| Americas (13 locations) | 268ms | 54ms |
| Europe (11 locations) | 420ms | 48ms |
| Asia-Pacific (15 locations) | 700ms | 87ms |
| Fastest location | Northern Virginia, 118ms | Querétaro, 31ms |
| Slowest location | Dubai, 1,300ms | Doha, 249ms |