Based on 349,920 tests per plan across Oct 1, 2025 – May 31, 2026, we compared the five Cloudways plans across five performance metrics. Here’s what we found:
- Best TTFB: Cloudways Vultr: 419ms
- Best Uptime: All five plans: 99.99%
- Best Load Handling: Cloudways DigitalOcean Premium: 360ms and 0% errors
- Best Global TTFB: Cloudways Vultr: 359ms (2024 test)
- Best Server Hardware: Cloudways Vultr HF: 7.6/10
Tiers: Elite · Strong · Average · Below average · Poor
In this post, I’m comparing Cloudways DigitalOcean, Cloudways Vultr, and Cloudways Linode across five performance tests.
For this comparison, I bought five Cloudways starter plans: Cloudways DigitalOcean Premium and Standard, Cloudways Linode, and Cloudways Vultr Standard and HF. I deployed identical WordPress sites on all five plans and monitored their performance continuously.
This comparison uses our data collected from October 1, 2025, to May 31, 2026, to show the performance differences between the five plans.
We compare the five plans using these five tests:
- Server response time (TTFB): Pingdom checks each test site once every 60 seconds from 22 U.S. locations to calculate its average server response time.
- Uptime: We use the same Pingdom data above to measure the uptime.
- Load testing: A 0 to 100 concurrent user ramp is sent over 60 seconds to test the load handling.
- Global TTFB: The global TTFB is calculated from 10 different locations.
- Server hardware: WPBenchmark runs 21 hardware tests across 5 categories to score the CPU, RAM and disk I/O each plan allocates.
Our testing methodology
- Identical WordPress sites with Twenty Twenty-Four theme, Contact Form 7, Rank Math SEO, Breeze caching, and Akismet
- 24/7 monitoring for 243 days (Oct 1, 2025 – May 31, 2026)
- Server response time (TTFB) measured every 60 seconds from 22 USA locations
- Load testing with a 0 to 100 concurrent user ramp over 60 seconds
- Global TTFB measured from 10 international locations
- 21 server hardware tests per plan via WPBenchmark
Cloudways DigitalOcean vs Vultr vs Linode: Performance tests
Test 1 – Server Response Time (TTFB)
Server response time (TTFB) measures how quickly the server begins responding to a request. Pingdom checked all five test sites once every 60 seconds from 22 North American locations.
Based on 8 months of performance data (October 1, 2025, to May 31, 2026), the average TTFB sits inside a 28ms band across all five plans. Cloudways Vultr clocked 419ms, Cloudways Linode 427ms, Cloudways Vultr HF 428ms, Cloudways DigitalOcean Standard 442ms, and Cloudways DigitalOcean Premium 447ms.
Quick summary: TTFB results
| Cloudways plan | TTFB |
|---|---|
| Cloudways Vultr ⚡ Fastest | 419ms |
| Cloudways Linode | 427ms |
| Cloudways Vultr HF | 428ms |
| Cloudways DigitalOcean Standard | 442ms |
| Cloudways DigitalOcean Premium | 447ms |
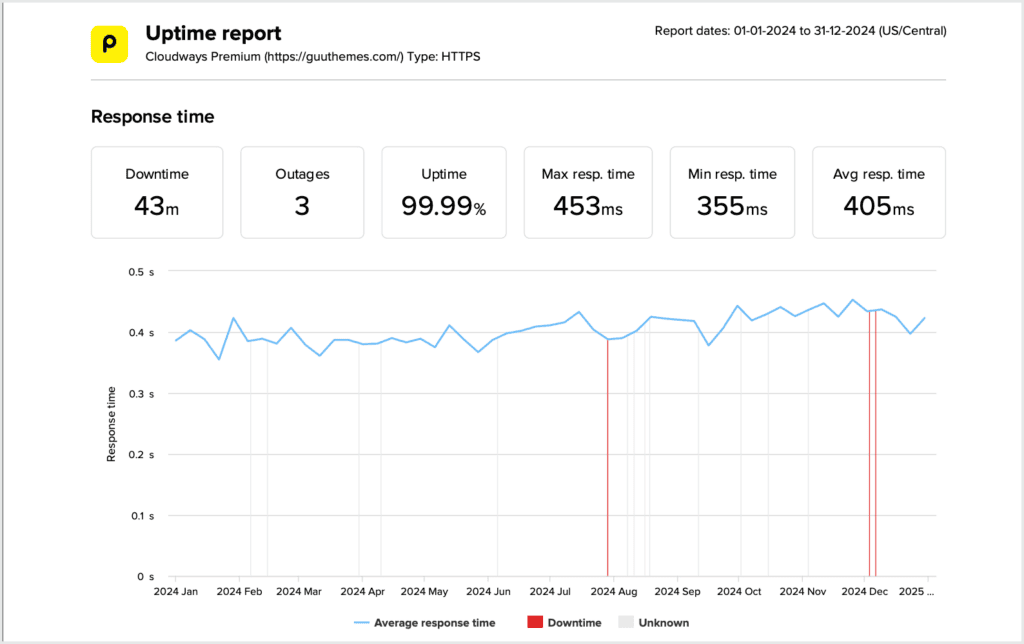
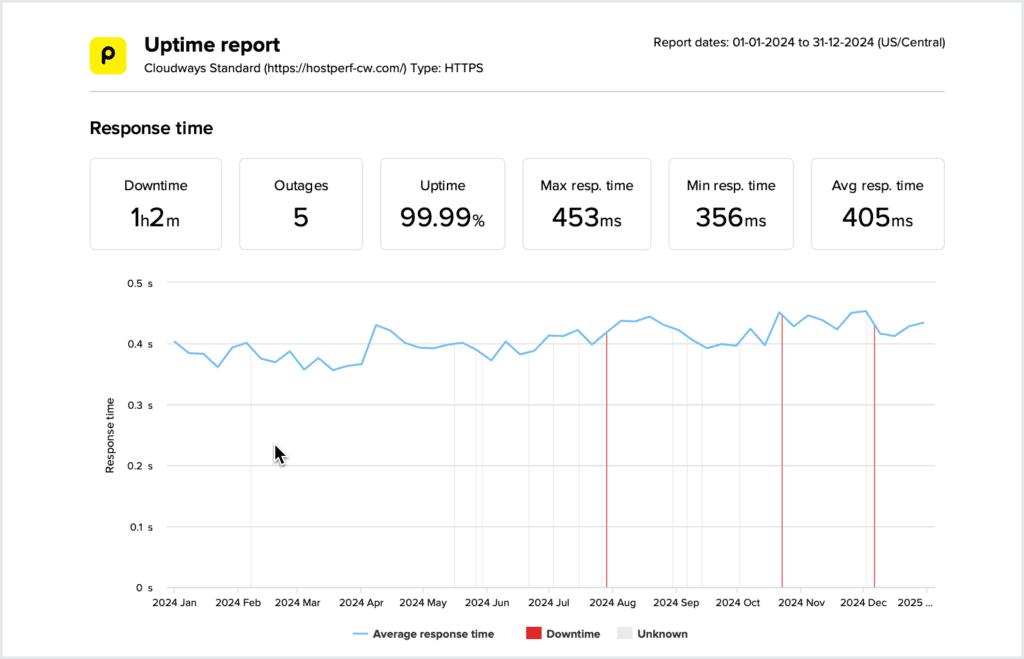
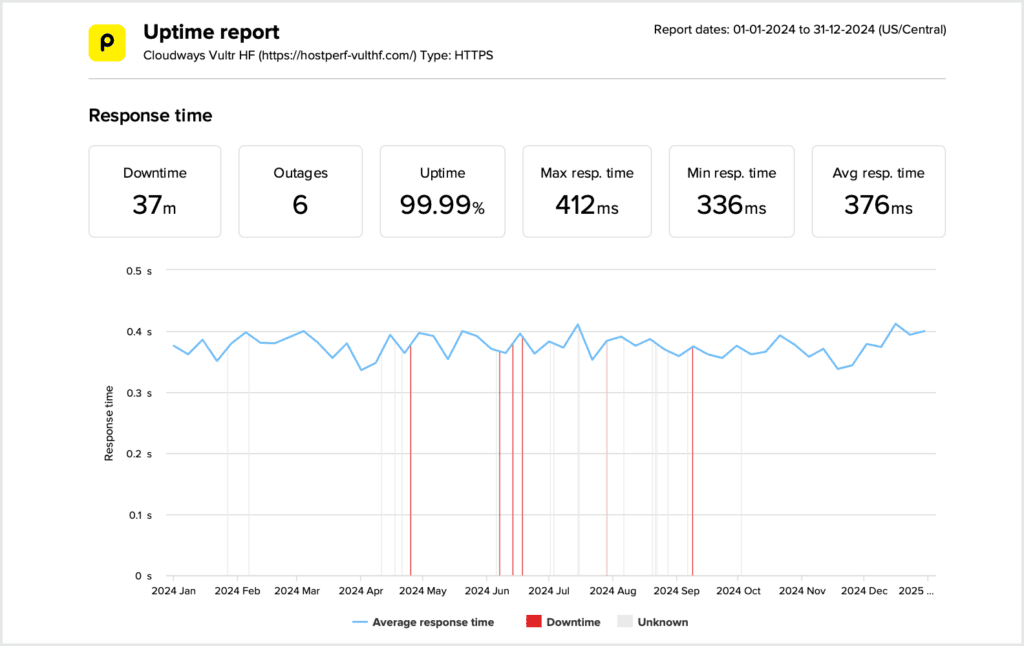
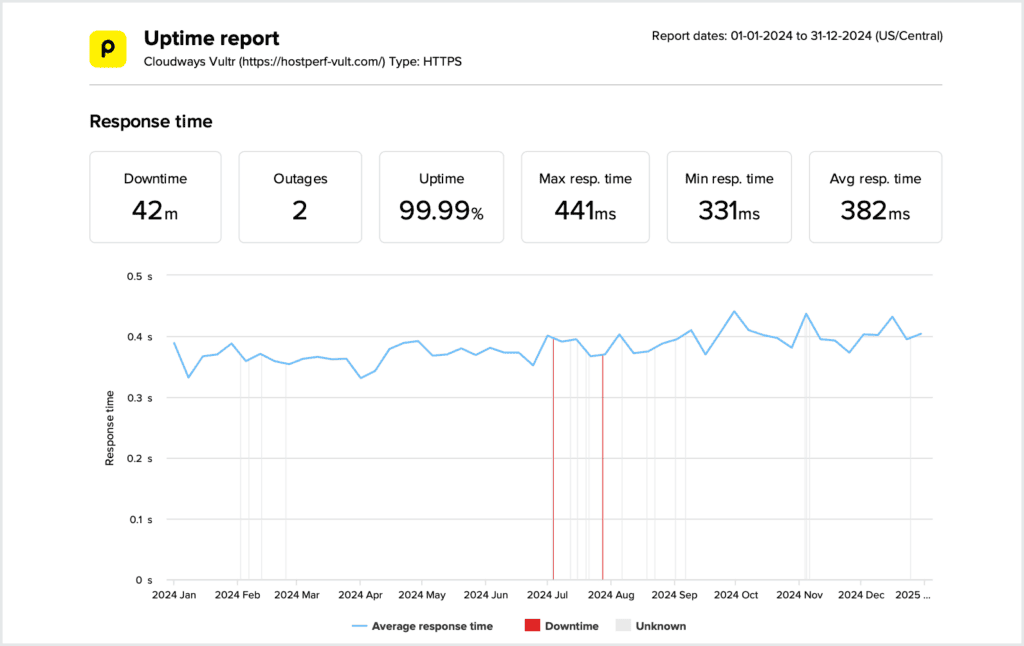
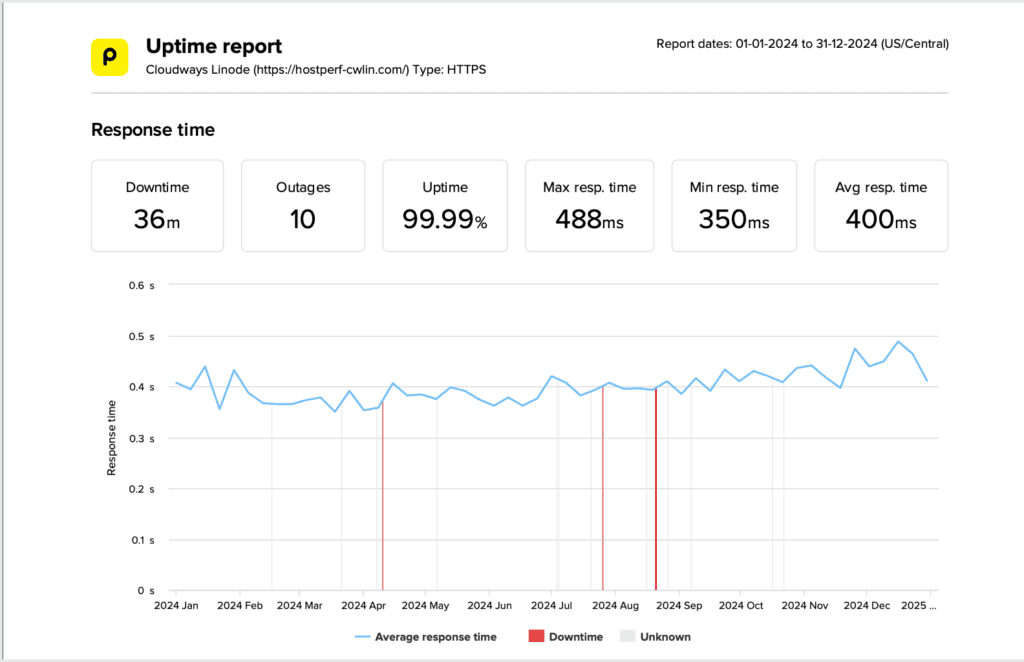
The five plans finished within 28ms of one another in this test. For everyday WordPress use, TTFB alone is not a strong reason to choose one of these plans over another.
🏆 TTFB Test Winner: Cloudways Vultr
Fastest response time at 419ms, 28ms ahead of the slowest plan
Test 2 – Uptime
Like the TTFB test, the uptime is measured by pinging the test sites every 60 seconds from 22 North American regions. The 8-month average uptime of all five sites is 99.99% (Refer to the TTFB Pingdom screenshot for uptime data.)
| Cloudways Plans | Uptime | Downtime | Outages |
|---|---|---|---|
| Cloudways DigitalOcean Standard | 99.9985% | 5 minutes | 5 |
| Cloudways DigitalOcean Premium | 99.9960% | 14 minutes | 4 |
| Cloudways Vultr HF | 99.9985% | 5 minutes | 3 |
| Cloudways Vultr | 99.9965% | 12 minutes | 5 |
| Cloudways Linode | 99.9980% | 7 minutes | 4 |
All five plans round to 99.99% uptime, but their downtime and outage totals differ.
My verdict: Cloudways delivered similar TTFB and uptime across all five plans. In this 243-day window, the largest TTFB difference was 28ms, so the data does not show a decisive speed advantage for any one plan.
🏆 Uptime test winner: All five plans (tie)
Every plan held 99.99% uptime, with Cloudways Vultr HF the cleanest at 5 minutes across 3 outages.
Test 3 – Load testing
Load testing shows how each plan handles concurrent traffic.
In this test, I ramp from 0 to 100 concurrent users over 60 seconds and measure average response time and failed requests. A lower response time is faster, but the error rate matters just as much.
Quick summary: Load-test results
| Cloudways plan | Response Time | Error Rate |
|---|---|---|
| Cloudways Linode | 269ms | 2.2% |
| Cloudways Vultr | 279ms | 1.5% |
| Cloudways Vultr HF | 288ms | 1.7% |
| Cloudways DigitalOcean Premium 🏆 Best | 360ms | 0% |
| Cloudways DigitalOcean Standard | 443ms | 0% |
Fast average response and zero dropped requests do not land on the same plan. The two Cloudways DigitalOcean plans complete every request; the other three responded faster but returned errors near peak load.
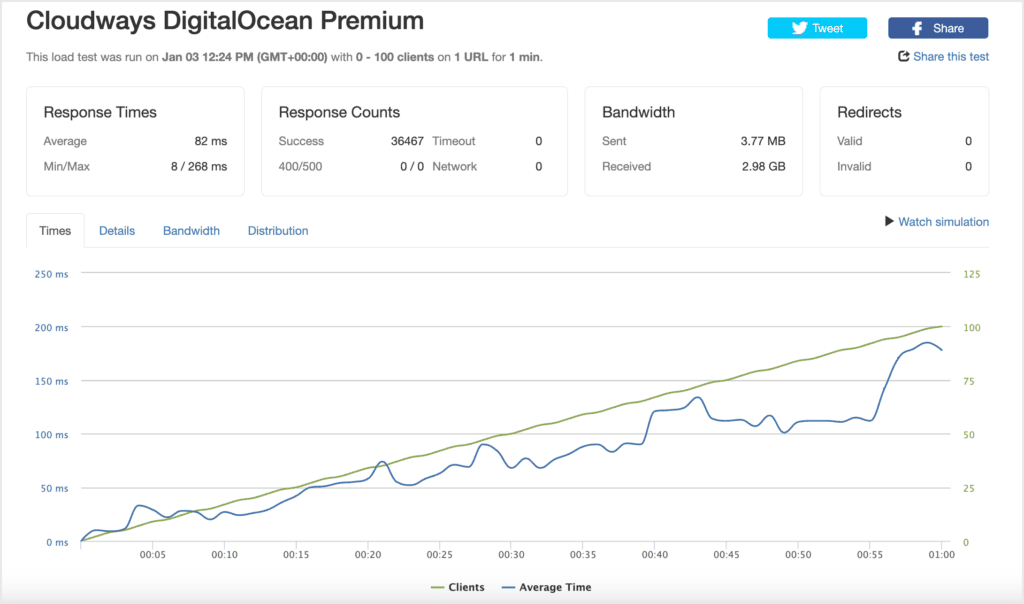
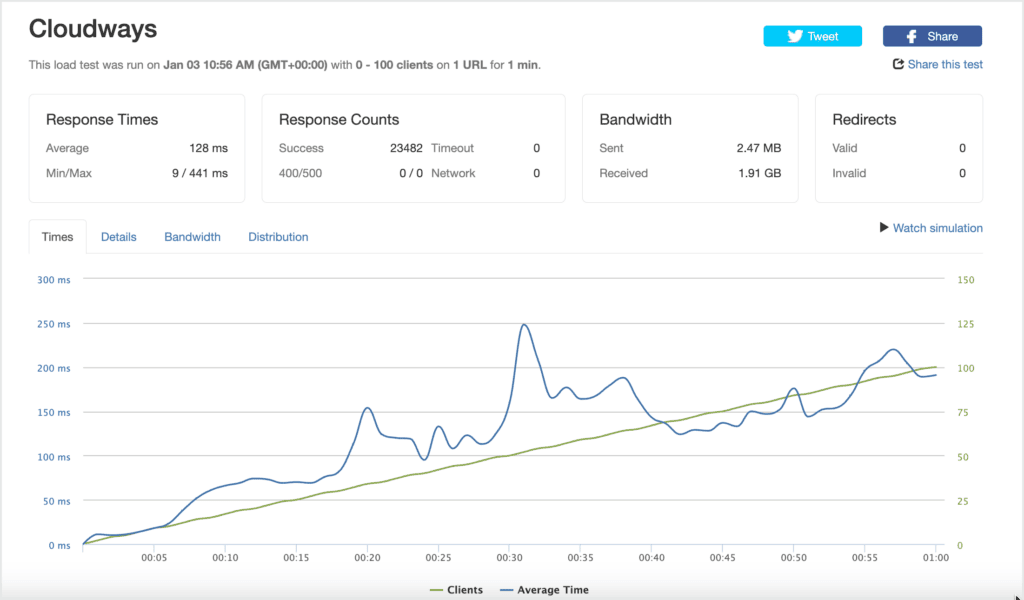
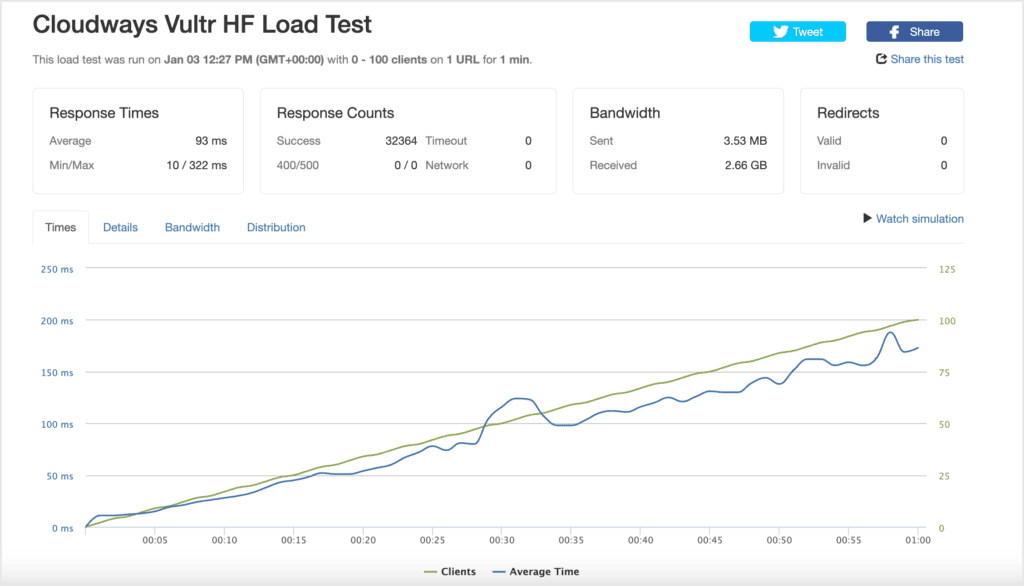
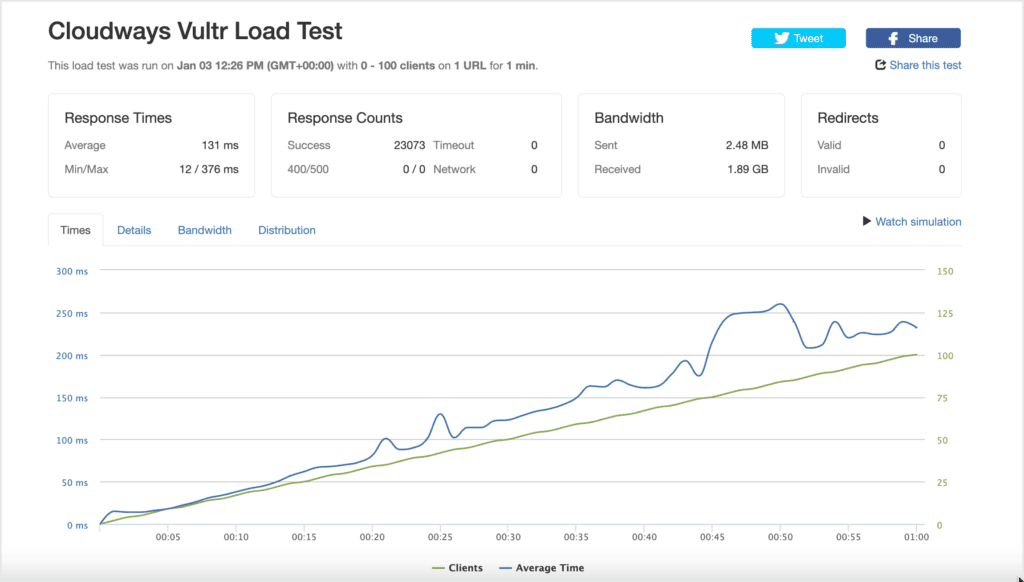
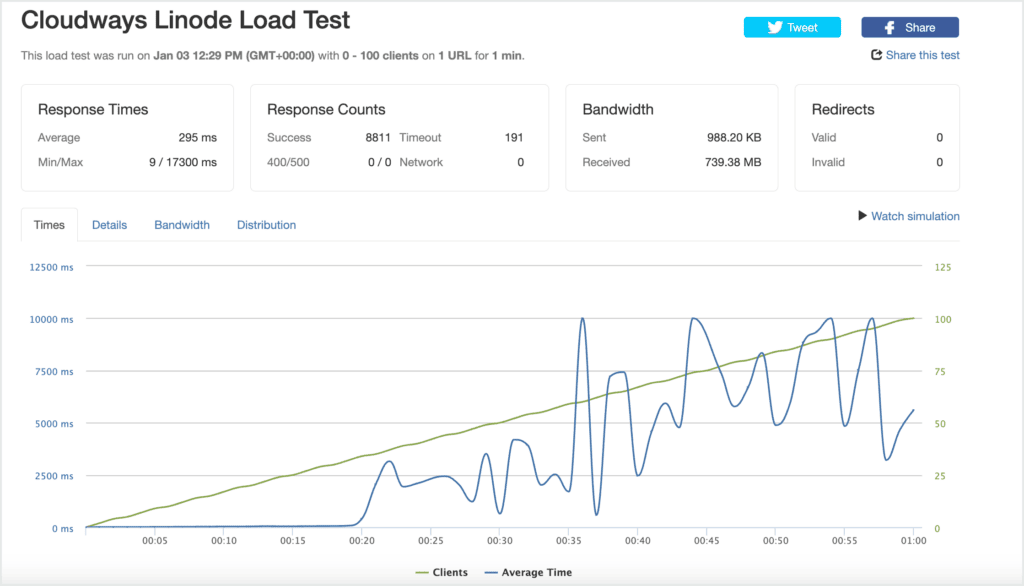
Cloudways Linode returned the fastest average for completed requests at 269ms, followed by Cloudways Vultr at 279ms and Cloudways Vultr HF at 288ms. All three returned errors as load approached the peak: 2.2%, 1.5%, and 1.7%, respectively. Cloudways DigitalOcean Premium (360ms) and Cloudways DigitalOcean Standard (443ms) were slower but served every request at a 0% error rate.
If your priority is completing every request in this specific load test, Cloudways DigitalOcean Premium produced the strongest result.
🏆 Load Test Winner: Cloudways DigitalOcean Premium
Fastest among the plans with a 0% error rate: 360ms
Test 4 – Global TTFB (2024 test)
These global figures come from our January–December 2024 SpeedVitals run across 10 locations. Plan-level global TTFB for the current window is being retested; the Cloudways DigitalOcean Standard 40-city result is published in our Cloudways review.
Our test 1 TTFB is measured only from 22 North American regions, and this global test is conducted from different global locations. If your site gets global traffic, these results are useful for assessing which server is best for you.
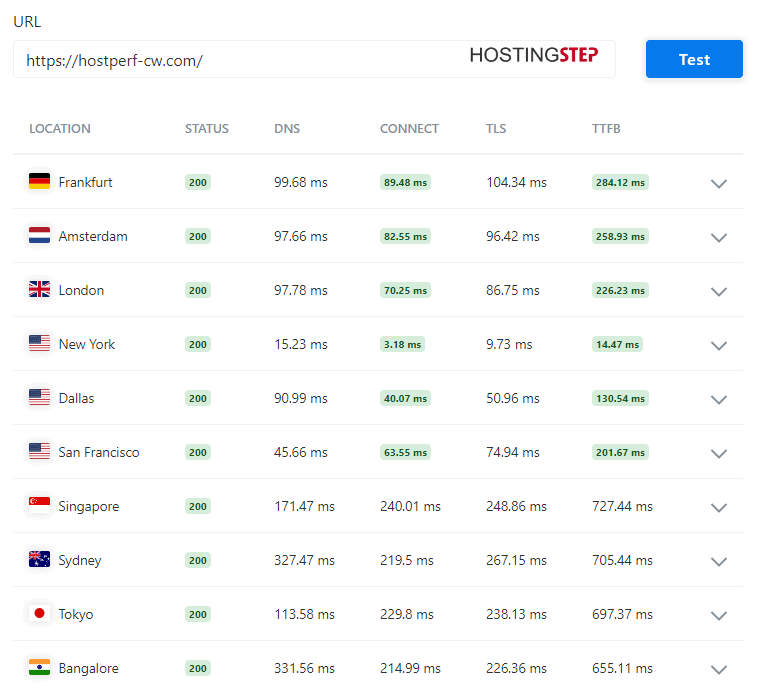
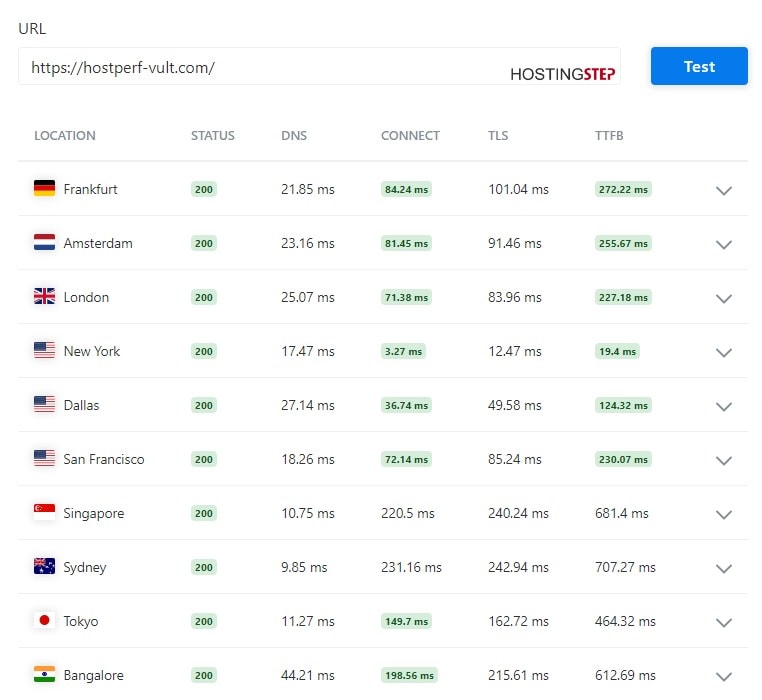
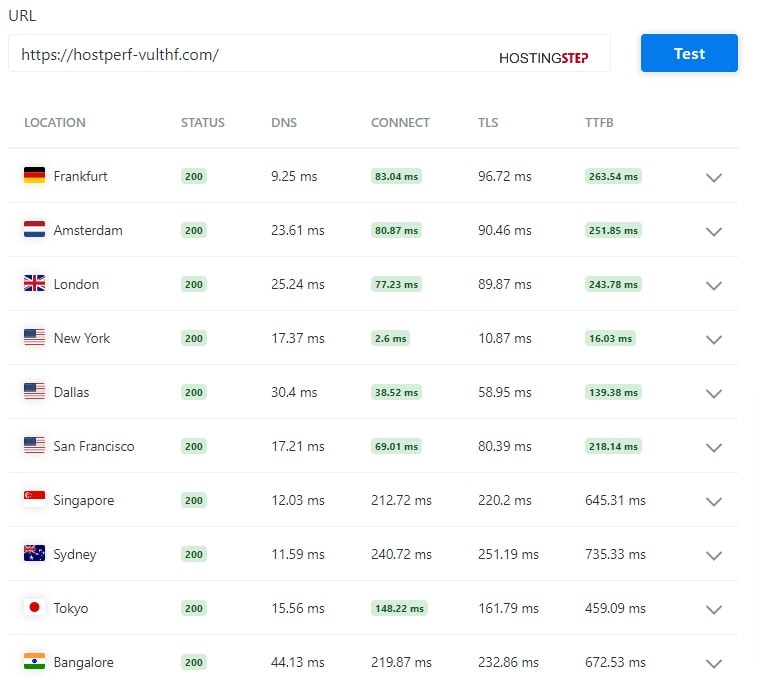
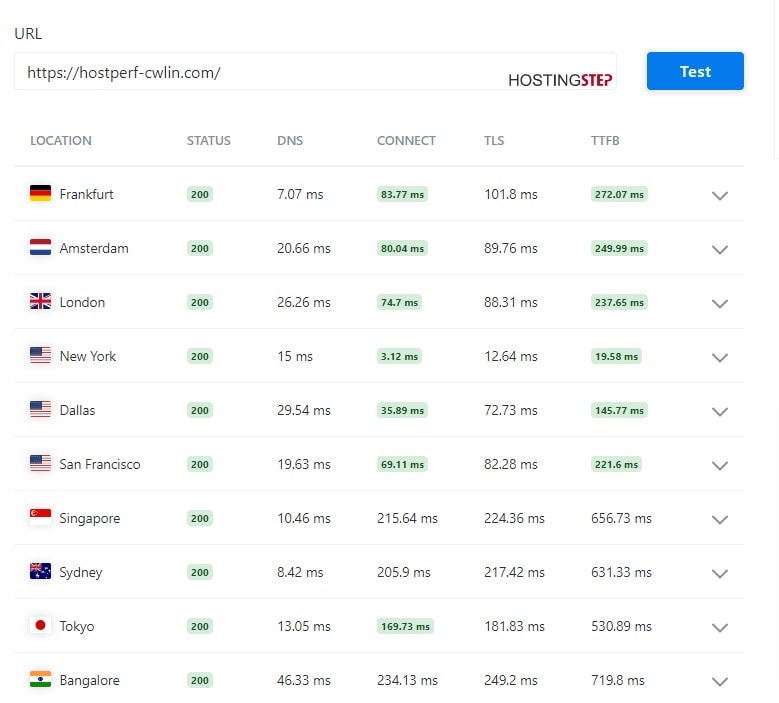
The global TTFB averages were Cloudways DigitalOcean Standard at 369.81ms, Cloudways DigitalOcean Premium at 365.07ms, Cloudways Vultr at 359.45ms, Cloudways Vultr HF at 364.49ms, and Cloudways Linode at 368.54ms. The fastest and slowest averages were 10.36ms apart.
Quick summary: Global TTFB results
| Cloudways plan | Global TTFB |
|---|---|
| Cloudways Vultr 🏆 Best | 359.45ms |
| Cloudways Vultr HF | 364.49ms |
| Cloudways DigitalOcean Premium | 365.07ms |
| Cloudways Linode | 368.54ms |
| Cloudways DigitalOcean Standard | 369.81ms |
All five plans finished within 10.36ms of one another.
Detailed global TTFB by location
| Location | DO Std | DO Prem | Vultr | Vultr HF | Linode |
|---|---|---|---|---|---|
| 🇺🇸 New York | 15.88ms | 19.18ms | 19.4ms | 16.03ms | 19.58ms |
| 🇺🇸 Dallas | 132.76ms | 138.56ms | 124.32ms | 139.38ms | 145.77ms |
| 🇺🇸 San Francisco | 204.62ms | 221.16ms | 230.07ms | 218.14ms | 221.6ms |
| 🇬🇧 London | 219.58ms | 242.2ms | 227.18ms | 243.78ms | 237.65ms |
| 🇳🇱 Amsterdam | 252.69ms | 255.5ms | 255.67ms | 251.85ms | 249.99ms |
| 🇩🇪 Frankfurt | 284.72ms | 280.93ms | 272.22ms | 263.54ms | 272.07ms |
| 🇮🇳 Bangalore | 676.88ms | 635.57ms | 612.69ms | 672.53ms | 719.8ms |
| 🇸🇬 Singapore | 743.68ms | 683.53ms | 681.4ms | 645.31ms | 656.73ms |
| 🇯🇵 Tokyo | 525.6ms | 526.36ms | 464.32ms | 459.09ms | 530.89ms |
| 🇦🇺 Sydney | 641.72ms | 647.68ms | 707.27ms | 735.33ms | 631.33ms |
| Average | 369.81ms | 365.07ms | 359.45ms | 364.49ms | 368.54ms |

🏆 Global TTFB Test Winner: Cloudways Vultr
Best global average at 359.45ms; all five plans were within 10.36ms.
Test 5 – Server hardware (WPBenchmark)
WPBenchmark runs 21 tests across 5 categories to score the CPU, RAM and disk I/O each plan actually allocates. It measures allocated resources only and is independent of the web server software running on the box.
| Cloudways plan | WPBench Score |
|---|---|
| Cloudways Vultr HF 🏆 Best | 7.6/10 |
| Cloudways Linode | 7.2/10 |
| Cloudways DigitalOcean Premium | 4.7/10 |
| Cloudways DigitalOcean Standard | 4.7/10 |
| Cloudways Vultr | 4.3/10 |
Tiers · Elite 9.0+ · Strong 7.5–8.9 · Average 6.0–7.4 · Below average 4.5–5.9 · Poor under 4.5
TTFB spans 28ms and uptime is effectively identical, but the WPBenchmark scores range from 4.3 to 7.6. Cloudways Vultr HF includes NVMe storage and scored 7.6/10, compared with 4.3/10 for Cloudways Vultr.
A low score means the provider allocated fewer resources to this plan in WPBenchmark. It does not indicate whether the server uses LiteSpeed, Apache, or Nginx. Cloudways Vultr HF and Cloudways Linode recorded the two highest scores at 7.6/10 and 7.2/10.
🏆 Server Hardware Test Winner: Cloudways Vultr HF
Highest WPBenchmark score of the five at 7.6/10, with NVMe storage.
Which is the best cloud provider at Cloudways?
Based on the data, I recommend Cloudways Vultr HF and Cloudways DigitalOcean Premium as the two best options to get started, for different reasons. Cloudways Vultr HF carries the strongest hardware allocation at 7.6/10; Cloudways DigitalOcean Premium was the faster of the two plans with a 0% error rate in our load test.
If you want the best balance of price and clean load handling in this test, I recommend Cloudways DigitalOcean Premium at $14/month with no renewal increase. Check Cloudways Coupon Code for 30% off for up to 3 months, and 40% off for 4 months while the current promotion runs, across all Cloudways providers.
Our recommendation
Based on our 243-day test window, Cloudways DigitalOcean Premium is the stronger load-handling choice, while Cloudways Vultr HF recorded the highest WPBenchmark score.
🏆 CLEANEST UNDER LOAD
Cloudways DigitalOcean Premium
360ms average under load with a 0% error rate and no renewal increase.
From $14/month · 40% off for 4 months
⚡ BEST HARDWARE
Cloudways Vultr HF
WPBench 7.6/10 with NVMe storage, the highest hardware score of the five plans.
From $16/month · 40% off for 4 months
Changelog:
August 20, 2026: Replaced the 2024 TTFB, uptime and load-test data with our October 1, 2025 – May 31, 2026 window (349,920 tests per plan, 1,749,600 across the five plans). Added a server hardware test using WPBenchmark. Global TTFB figures remain from the 2024 run and are labelled as such pending a retest. This copy-edit removed em dashes, corrected grammar, and tightened claims without changing the measured test results.
March 25, 2025: Removed Core Web Vitals test as it doesn’t bring much value to users. We updated the post with the new TTFB, uptime, and load test for 2025.
September 10, 2024: Improved content accuracy.
April 10, 2024: We tested the latest Cloudways Autonomous plan. The full load-handling result is available in our Cloudways Autonomous review.
April 10, 2024: The old 5-month data from August 31, 2022, to January 31, 2023, was replaced with the new 1-year data from January 1, 2023, to December 31, 2023.
April 10, 2024: Removed the 1,000-client constant-load test because it produced results similar to the 500-client test.
April 10, 2024: Ran a new load test and updated the results on the same day.