FastComet scored 7.40 out of 10 on performance in our 2026 rankings. The host recorded a TTFB of 496 ms, which is 25 ms slower than the 471 ms field median. Besides, FastComet recorded an uptime of 99.98%, a load handling of 78 ms with 0% error, a WPBench hardware score of 4.8 out of 10 and a Global TTFB of 387 ms.
We have been monitoring FastComet since September 2020 using our purchased account. Our Pingdom check ID is 6603252, and our hostname is hostperf-fc.com. We conducted over 3,018,240 individual TTFB and uptime checks at 60-second intervals across 5 years of constant monitoring, of which 349,920 fall inside our current window of October 1, 2025 to May 31, 2026. Our additional tests include Load testing using Loader.io, global TTFB test in 40 cities using SpeedVitals and WPBenchmark server hardware scoring.
FastComet has been recently acquired by WorldHostGroup, which is the same company behind Hosting.com, Rocket.net, and over 10 other hosting brands. The existing FastComet infrastructure has been replaced by new Hosting.com servers, and now FastComet has the same infrastructure as Hosting.com. The support team also been replaced by the WorldHostGroup support team. Our current window of October 1, 2025 to May 31, 2026 runs entirely on the new infrastructure, giving us 243 days of post-acquisition data. That data shows the transition has gone in FastComet’s favour, with TTFB, global TTFB and uptime all improving against the pre-acquisition baseline.
Note: This review is based on our testing of FastComet’s Starter plan. The performance figures are measured data; the recommendations reflect our editorial assessment of those results. Unless stated otherwise, everything here applies to the Starter plan while other FastComet plans may produce different benchmark results.
Performance Overview
| Metric | Value |
| Performance Score | 7.40 / 10 |
| Monitoring Window | Oct 1, 2025 – May 31, 2026 (243 days) |
| Intro Price | $1.99/mo (promotional rate) |
| Renewal Price | $9.95/mo |
| Visit | Www.FastComet.Com |
| Metric | Result | Score (/10) | Context |
| TTFB (US) | 496ms (spike ratio 2.02) | 6.75 | 25ms above the 471ms median |
| Uptime | 99.98% (16 outages, 1h 10m) | 8.40 | Strong duration, mid-pack outage count |
| Load Test | 78ms / 0% errors | 8.00 | Clean pass |
| Global TTFB | 387ms | 7.00 | Level with the 390ms median |
| WPBench (Hardware) | 4.8 | 4.80 | Below the 6.7 median |
FastComet’s strongest metric is its 99.98% uptime, which puts it level with the most reliable shared hosts we track. The host performed exceptionally well in the load test with a response of 78 ms with 0% error, indicating its reliable load handling capacity during traffic spikes. However, the low WPBench score of 4.8 and the 496 ms TTFB are the two drags. The hardware allocation sits 28% below the 6.7 median.
The Global TTFB of 387 ms lands at the field median despite the lack of CDN. Hence, FastComet’s performance profile is a story of two halves with one half having excellent uptime reliability and load handling, and the other half with a below average hardware allocation and inconsistent TTFB. If you need a host that reliably stays online and handles traffic spikes efficiently, FastComet delivers it but if raw speed for your website is what you are looking for, there are faster hosts at this price point.
FastComet’s performance score of 7.40 sits just behind Hostinger Premium at 7.51 and just ahead of DreamHost at 7.39, while Bluehost leads the sub-$2 group at 8.45. Hosting.com, which is FastComet’s sister company under WorldHostGroup, scores 6.84 on the same infrastructure generation, so FastComet is currently the stronger of the two WorldHostGroup shared brands we monitor.
TTFB Response Time
| Year | Avg TTFB | Tests | Context |
| 2020 (119 days) | 351ms | 171,360 | Strong — original DC infrastructure |
| 2021 | 334ms | 525,600 | Best year — peak performance |
| 2022 | 325ms | 525,600 | Excellent — consistent sub-350ms |
| 2023 | 365ms | 525,600 | First signs of degradation |
| 2024 | 427ms | 527,040 | Significant slowdown — transition year |
| 2025 | 520ms | 525,600 | New DC infrastructure rollout |
| Oct 1, 2025 – May 31, 2026 | 496ms | 349,920 | Current window — post-acquisition |
FastComet recorded an average TTFB of 496 ms across our current window from October 1, 2025 to May 31, 2026, scoring 6.75 out of 10 on our scale. TTFB (Time to First Byte) is the time the server takes to begin responding after receiving a request and it’s the foundational speed metric since it affects everything else on the website TTFB directly impacts LCP (Largest Contentful Paint), which is a Google ranking factor, which is why it holds a lot of importance.
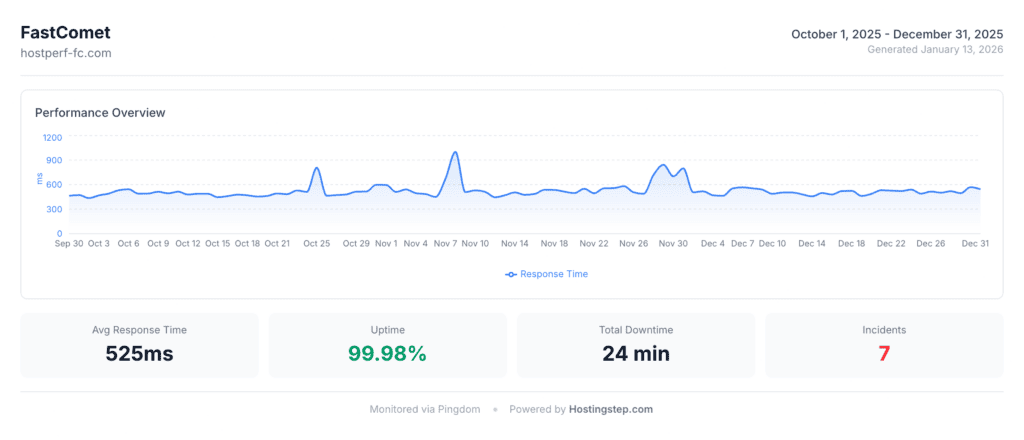
As we look at the historical TTFB trend, FastComet recorded its peak performance in 2022 with an average TTFB of 325 ms. However, FastComet’s TTFB declined from 325 ms in 2022 to 496 ms in our current window, indicating 53% slower page loading than the 2022 peak. The 2024 to 2025 period is also the time when the WorldHostGroup acquired FastComet and the host was in the process of data center transition. The 496 ms average across the full eight months is 24 ms faster than the 2025 calendar-year figure of 520 ms, which confirms the new infrastructure has stopped the decline rather than merely paused it.
Averages alone hide instability, so we also track the spike ratio, which is the highest recorded response time divided by the average. FastComet’s response times ranged from 413 ms at the low end to 1,001 ms at the peak, giving a spike ratio of 2.02. That means the slowest responses run at roughly double the average, and it is the single reason FastComet’s TTFB score lands at 6.75 rather than the full 7 its 496 ms average would otherwise earn. Bluehost recorded 1.72 and NameCheap 1.44 over the same window, so FastComet is the least consistent of the sub-$2 hosts we monitor.
The field’s best hosts are Pressable with 320 ms, WordPress.com with 319 ms, and WP Engine with 355 ms. However, these hosts comes with edge CDN, thus offering greater speed. The field median is approximately 471 ms, FastComet is 25 ms above median. GoDaddy is the worst performer in this field with 734 ms. Among the four competitors, Hostinger Premium recorded 447 ms, NameCheap recorded 471 ms, Bluehost recorded 498 ms, and SiteGround recorded 745 ms. FastComet’s TTFB is 2 ms faster than Bluehost.
At 496 ms, the server will take just under half a second to begin responding, which for a blog with cache static content is noticeable but also manageable. For dynamic sites such as WooCommerce, and membership sites, the impact will be more since every uncached database query will add to this baseline.
Uptime
| Year | Uptime | Outages | Downtime | Worst Day |
| 2020 (119 days) | 99.98% | 3 | 26 min | 98.33% |
| 2021 | 99.99% | 11 | 42 min | 98.68% |
| 2022 | 99.97% | 12 | 129 min | 93.89% |
| 2023 | 99.97% | 22 | 121 min | 98.47% |
| 2024 | 99.84% | 101 | 836 min (13.9 hrs) | 95.07% |
| 2025 | 99.92% | 39 | 403 min (6.7 hrs) | 82.29% |
| Oct 1, 2025 – May 31, 2026 | 99.98% | 16 | 70 min (1 hr 10 min) | — |
FastComet recorded an uptime of 99.98% across our current window from October 1, 2025 to May 31, 2026, scoring 8.40 out of 10 on our uptime scale. The 99.98% duration alone would score 9.0, but the host logged 16 separate outages totalling 1 hour 10 minutes across the 243 days, and the outage count pulls the blended score down to 8.40. Frequent short interruptions and one long outage are different problems for visitors, so we score both.
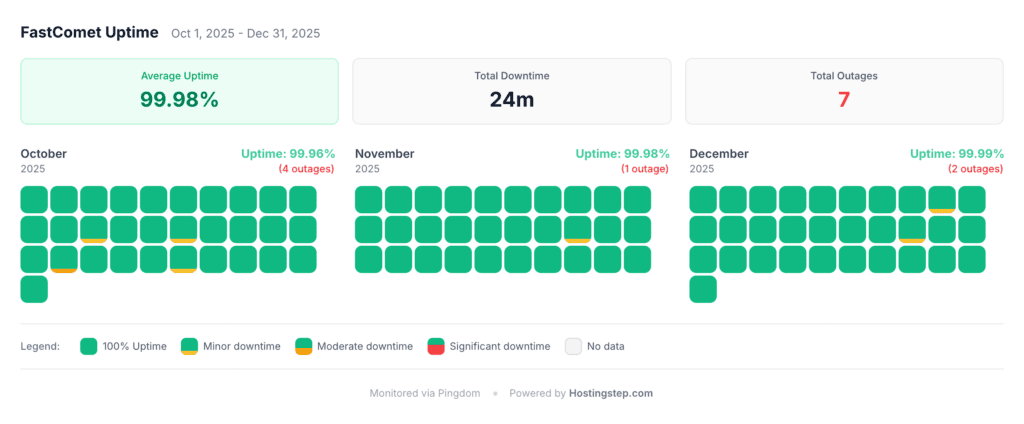
2024 has been the worst year for FastComet in terms of uptime since the host’s uptime declined to 99.84% with 101 separate outages, amounting to 836 minutes (13.9 hours) of total downtime. There were nearly one outage every 3.6 days for an entire year with 101 outages across 101 days. The uptime of the worst single day in 2024 was 95.07% with roughly 71 minutes of downtime.
As we look at FastComet’s historical uptime pre acquisition, the uptime was approximately 99.97% to 99.99%, which was consistently strong. The 99.98% recorded across the eight months since the transition puts FastComet back inside that pre-acquisition range and closes the question the 2024 and 2025 data left open.
FastComet’s 99.98% uptime beats NameCheap with 99.98% vs 99.95% and SiteGround with 99.98% vs 99.97%. Bluehost and Hostinger Premium edge ahead at 99.99%, and both did it with fewer outages than FastComet’s 16 — Bluehost logged 10 and Hostinger Premium 11.
Load Handling
We used Loader.io to create a traffic spike simulation wherein we send from 0 to 100 concurrent visitors over 60 seconds to the host to measure the average response time and error rate during the load handling. FastComet PASSED the load test with an average response time of 78 ms and 0% errors, scoring 8.00 out of 10, which is a strong performance.
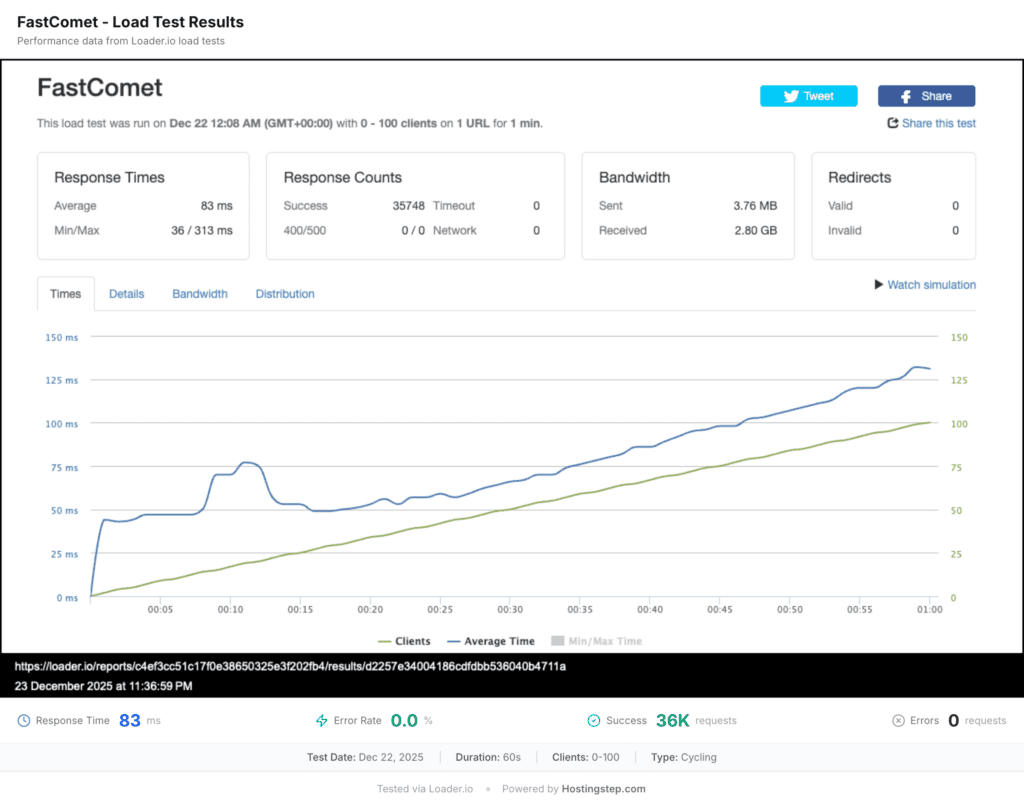
The 78 ms with 0% error load handling for any website means whenever you share any of your blog posts on social media and 100 people visit your website using that link at the same time, your blog post will load correctly to all of them. For an eCommerce store with a flash sale driving 100 concurrent shoppers, all the shoppers will have a smooth shopping experience without any errors. Even though 78 ms means fast enough, some visitors may experience slow page loading during traffic spikes.
The best performers in the field are Pressable with 12 ms/0% error, GreenGeeks with 26 ms/0% error, and WP Engine with 27 ms/0% error. FastComet with 78 ms sits in the second tier of load test performers, ahead of Hostinger Premium at 245 ms, SiteGround at 170 ms and NameCheap at 150 ms. It is not the fastest, but it is reliably clean.
Server Hardware
FastComet recorded a WPBench score of 4.8 out of 10, which is below the 6.7 field median. The host is above the bottom tier hosts such as NameHero with 3.7 and GoDaddy with 3.8. We conducted 21 individual tests across 5 categories comprising CPU compute, memory throughput, filesystem I/O, database performance, and WordPress core operations. The scores are based on a 0 to 10 scale. The test as a whole measures allocated resources and not theoretical server capacity. Account-level resource isolation means the result reflects only the allocation FastComet offers you on the plan.
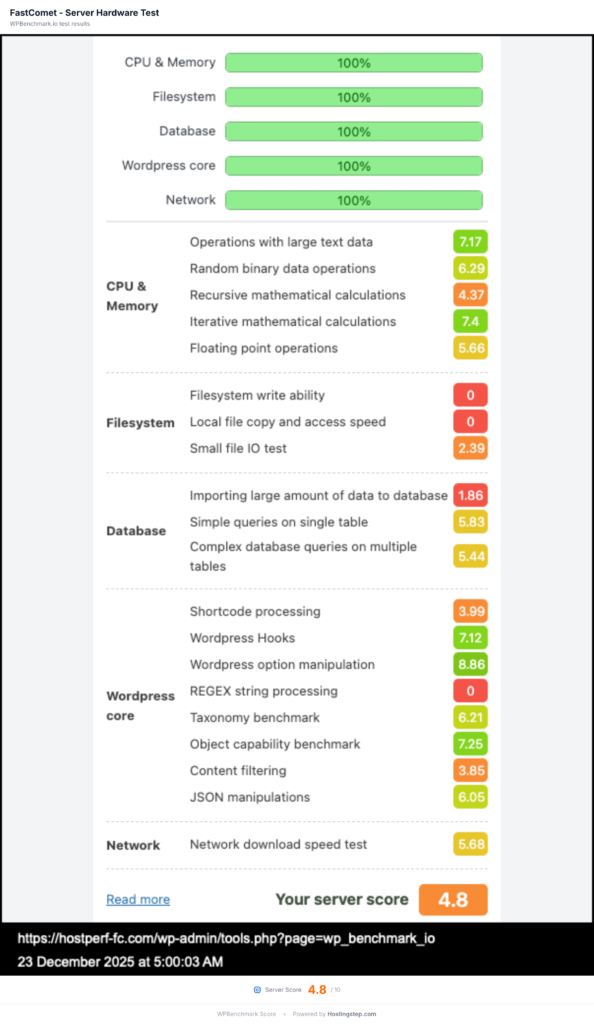
The field leaders are Bluehost with 9.6, HostGator with 9.6, ScalaHosting with 8.8, Kinsta with 8.8, and SiteGround with 8.4. Among the competitors, Bluehost recorded 9.6, SiteGround recorded 8.4, Hostinger Premium recorded 7.4, and NameCheap recorded 5.0. FastComet has the lowest score with 4.8 and NameCheap with 5.0 is the nearest match.
The 4.8 score should be adequate for any blog with 5 to 10 plugins since server-side caching handles most requests. However, WooCommerce stores, membership sites or complex WordPress setups with over 20 plugins and page builders may experience degraded performance because of limited CPU and RAM allocation.
While FastComet’s load handling of 78 ms with 0% error indicates that the server handles concurrent traffic well despite its hardware limitation, the reality is that caching is doing all the heavy lifting. However, at places where caching can’t help anymore such as cart pages, admin dashboard, search queries and logged in users, the 4.8 hardware score becomes the limiting factor.
Global TTFB
| Region | Avg TTFB | Best City | Worst City |
| Americas (13 cities) | 179ms | N. Virginia: 36ms | São Paulo: 420ms |
| Europe (11 cities) | 275ms | London: 230ms | Finland: 341ms |
| Asia-Pacific (15 cities) | 650ms | Tel Aviv: 395ms | Dubai: 928ms |
FastComet recorded a Global TTFB of 387 ms with a score of 7 out of 10, measured on April 17, 2026. We tested from 40 cities in the Americas, Europe, and Asia Pacific using SpeedVitals with cached values only, and our test site hosted on the Chicago data center. The host recorded a regional average of 179 ms in the Americas with the best TTFB in Northern Virginia with 36 ms, Montreal with 46 ms, Toronto with 62 ms, and South Carolina with 73 ms. All these cities had the benefit of being close to the origin server.
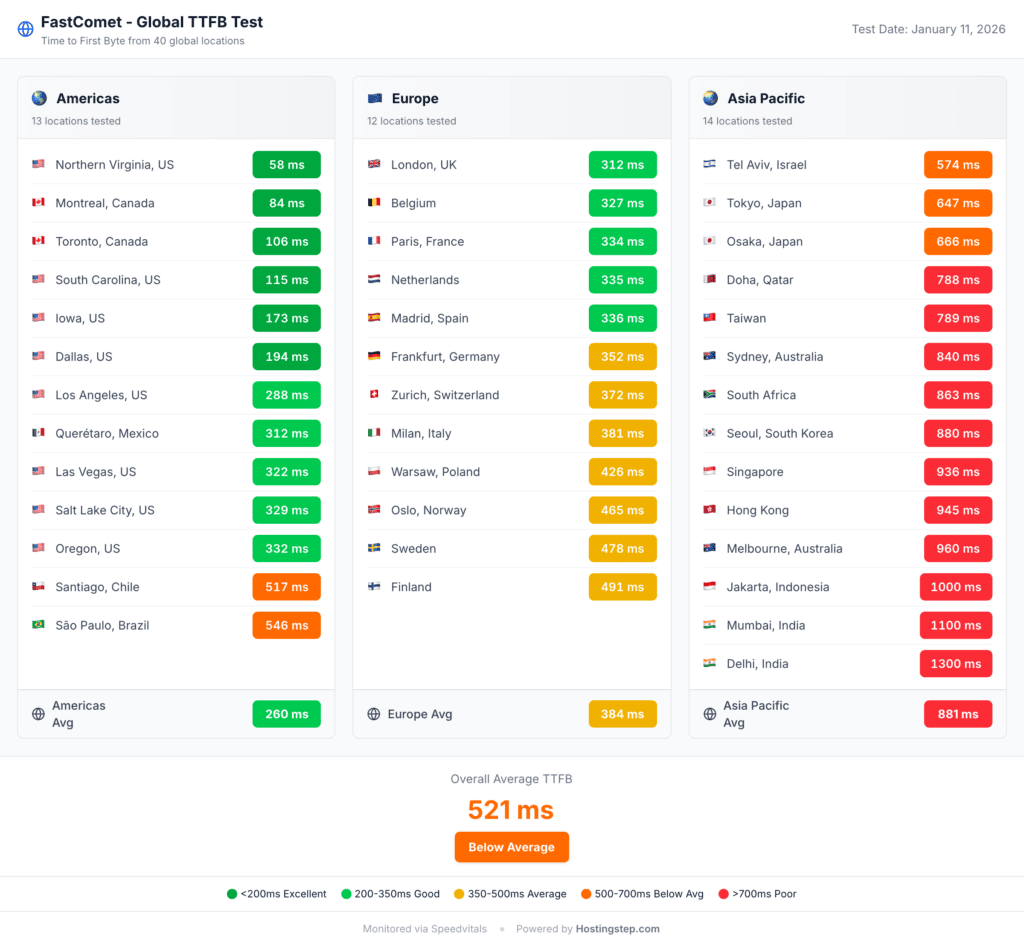
Cities with good TTFB are Iowa with 114 ms, Dallas with 124 ms, and Los Angeles with 216 ms while the host recorded degraded TTFBs in Latin America with 420 ms in São Paulo, and 384 ms in Santiago. While central and eastern North America benefit from proximity to the Chicago origin server, the West Coast and Latin America experienced degraded speed as they were away from the origin server.
FastComet recorded a regional average of 275 ms in Europe with the best TTFB in London with 230 ms, Madrid with 233 ms, Belgium with 240 ms, and Paris with 246 ms. Cities with mid TTFB performance are Netherlands with 251 ms, Frankfurt with 254 ms, Zurich with 271 ms and Milan with 284 ms. Cities with the worst TTFB are Sweden with 335 ms, Warsaw with 340 ms, and Finland with 341 ms. All 11 European cities came in under 350 ms, which is the strongest regional result FastComet has posted since we started global testing.
FastComet’s global TTFB in Asia Pacific is 650 ms with the best TTFB in Tel Aviv with 395 ms, Tokyo with 490 ms, and Doha with 498 ms. Cities with mid TTFB are Osaka with 517 ms, Seoul with 559 ms, Taiwan with 594 ms, Hong Kong with 609 ms and Sydney with 624 ms. Cities with the worst TTFB are Singapore with 716 ms, Jakarta with 724 ms, Mumbai with 868 ms, Delhi with 913 ms, and Dubai with 928 ms. Google recommends a TTFB under 800 ms for good user experience, and 3 of the 15 Asia Pacific cities we tested exceed that threshold, down from 8 of 14 on the previous infrastructure.
FastComet now offers 6 data center locations — Dallas, Frankfurt, London, Singapore, Sydney and Mumbai — and users choosing the Singapore, Sydney or Mumbai data center would see dramatically improved Asia Pacific results than our US based test. While this gives you better TTFB in one region, it will degrade the cities that are far away from the origin server. For example, choosing the Singapore data center improves the Asia Pacific performance but degrades global delivery speed in Americas and Europe. Your site files live on one server only, so this is a single choice at signup and not a replicated network.
A CDN that caches content at edge locations globally can solve this problem but FastComet doesn’t come with any CDN. Users can configure Cloudflare free tier CDN manually with FastComet as a workaround but again this is not out of the box. Bluehost ships a static CDN and records a 224 ms global average, which is 163 ms faster than FastComet at the same $1.99 intro price. Hostinger Premium, which also ships without a CDN, records 404 ms and is the one competitor here that FastComet beats on global delivery.
FastComet vs Competitors
| Metric | FastComet | Hostinger Premium | Bluehost | SiteGround | NameCheap |
| Performance Score | 7.40 | 7.51 | 8.45 | 5.59 | 6.90 |
| TTFB (US) | 496ms | 447ms | 498ms | 745ms | 471ms |
| Spike Ratio | 2.02 | 1.79 | 1.72 | 2.24 | 1.44 |
| Uptime | 99.98% | 99.98% | 99.95% | 99.97% | 99.98% |
| Load Test | 78ms / 0% | 31ms / 0% | 170ms / 9% | 170ms / 0% | 150ms / 0% |
| Global TTFB | 521ms | 223ms | 345ms | 833ms | 574ms |
| WPBench | 4.8 | 7.4 | 9.6 | 8.4 | 5.0 |
| CDN | None | Static | Static | Addon | None |
| Included | Addon | Addon | Included | Included | |
| Backups | Daily | Daily | Weekly | Daily | Daily |
| Intro Price | $1.79/mo | $3.69/mo | $3.99/mo | $3.99/mo | $1.98/mo |
| Perf Tier | Average | Strong | Average | Below Avg | Average |
FastComet vs Hostinger Business
FastComet wins on intro price with $1.79 vs $3.69 while Hostinger scores 16% higher than FastComet with 6.89 vs 8.02. FastComet has a leading edge in terms of features as it comes with included email, daily backups, and 12 data center locations in spite of being $1.90 per month cheaper than Hostinger. The included email saves around $1 to $2 per month.
Hostinger, on the other hand, wins on global TTFB with a massive gap with 223 ms vs 521 ms, hardware score with 7.4 vs 4.8, load handling with 31 ms vs 78 ms, CDN with static vs none and TTFB with 478 ms vs 525 ms. Hostinger Business beats FastComet on every speed metric and the extra $1.90 per month buys you a CDN, which makes global delivery 54% faster combined with stronger hardware. Check Hostinger Review.
FastComet vs Bluehost
FastComet ranks 14 with a score of 6.90 while Bluehost ranks 15 with a score of 6.89, which is very close. FastComet wins on the intro price with $1.79 vs $3.99. Besides, the host wins on uptime with 99.98% vs 99.95%, but Bluehost wins on TTFB with 525 ms vs 520 ms, hardware with 9.6 vs 4.8 and global TTFB with 521 ms vs 345 ms. While FastComet offers included email and daily backups, Bluehost doesn’t have included email and it offers only weekly backups.
Bluehost also wins on CDN with static vs none and has better hardware allocation on its plan with a WPBench of 9.6, which is double of FastComet’s WPBench score of 4.8. If you prioritize performance and raw compute power, you can go with Bluehost but if you are under a tight budget and need features such as free email hosting and daily backups, you can go with FastComet. Check Bluehost Review
FastComet vs SiteGround
FastComet beats SiteGround on ranking, being 7 positions higher than SiteGround. The host wins on TTFB with 525 ms vs 632 ms, global TTFB with 521 ms vs 833 ms, and price with $1.79 vs $3.99. SiteGround wins on hardware with 8.4 vs 4.8, which is 75% more while FastComet wins on load handling with 78 ms vs 170 ms. While both hosts offer email hosting, and daily backups.
FastComet outperforms SiteGround on almost all speed metrics and also costs $2.20 per month less. SiteGround, on the other hand, has stronger hardware allocation with 8.4. For budget conscious users, FastComet offers better performance and good value for money. Check SiteGround Review
FastComet vs NameCheap
Both FastComet and NameCheap are under $2 per month and both offer email, and similar hardware. Both hosts lack CDN. However, FastComet wins on load handling with 78 ms vs 150 ms, global TTFB with 521 ms vs 574 ms, and 12 data center locations vs fewer. NameCheap, on the other hand, wins on TTFB with 462 ms vs 525 m, which makes it 63 ms faster. NameCheap also has a slightly better WPBench score than FastComet with 5.0 vs 4.8 while FastComet is slightly cheaper with $1.79 vs $1.98, which makes it $0.98 per month cheaper.
FastComet and NameCheap are the two most budget hosts with complete features in our rankings. NameCheap is 63 ms faster than FastComet on US TTFB, while Fastcomet offers 12 data center locations to choose from. Both hosts include email and daily backups. The hosts are pretty similar and you must pick one based on your data center location preference alone.
Who Should Use FastComet
Budget users who need a hosting with free email and daily backups should use FastComet since it comes with both for a low intro price of $1.79 per month. Every other host be it Hostinger or Bluehost charges additionally for email or only offers weekly backups instead of daily backups. If you need daily backups and email hosting for no additional price and your budget is tight, FastComet is the ideal host for you.
Users who need a specific non US data center location can use FastComet since the host comes with 12 data center locations across 4 continents, which is the broadest geographic spread among shared hosts we tested. FastComet can be a strong option for sites targeting users in Asia Pacific or South America, or any specific European city since choosing the nearest data center location will dramatically improve the delivery speed. However, this is a single server choice and if you also need US performance, you must consider using a CDN.
Users who prioritise uptime over raw speed should choose FastComet as the host delivers 99.98% uptime and a clean load test with 0% errors, indicating excellent reliability. This ensures that your site stays up and running all the time, which is relevant for blogs, portfolio sites, and small business sites where downtime can cause damage to their reputation while a 50 ms speed difference will not affect conversion.
Users who need LiteSpeed Enterprise, cPanel control panel, NVMe storage, and CloudLinux isolation can opt for FastComet. The host also maintains a familiar workflow with LiteSpeed’s caching advantages for users migrating from other cPanel hosts.
Who Should NOT Use FastComet
Users who need fast global speed without the configuration should avoid FastComet since the host recorded a Global TTFB of 521 ms and lacks a built in CDN. The average TTFB in Asia pacific is poor with 881 ms. Competitors like Hostinger and Bluehost offer better global TTFB with 223 ms and 345 ms respectively. FastComet has 12 data center locations for users to choose from and one can choose the nearest data center to one target audience, but it cannot replace a CDN’s importance for globally distributed audiences. Hence, Hostinger Business stands out as a great alternative with a global TTFB of 223 ms for $3.69 per month.
WordPress sites that are hardware intensive should not use FastComet since the host has a low WPBench of 4.8, indicating restricted CPU, RAM and disk I/O allocation. Complex setups like WooCommerce, membership plugins, sites with over 20 active plugins and page builders will bottleneck on the limited hardware. On the contrary, Bluehost has a WPBench score of 9.6 and SiteGround has a score of 8.4. These hosts offer 75% to 100% more hardware allocation than FastComet. Bluehost makes a great alternative for $3.99 per month offering double the hardware that FastComet offers.
Users who are sensitive to renewal pricing can avoid FastComet since the host has a 5x renewal markup with the intro price of $1.79 per month jumping to $8.95 per month at renewal. Over 4 years, the total cost will get to $343.68 with 1 year intro plus 3 years renewal while Hostinger Business’ 4 year cost would be significantly lower at renewal.
Our Verdict
FastComet scored 6.89 out of 10 with the rank of 15 out of 34 in our 2026 rankings. The host has an average performance with a performance total of 4.39. While the host indicates strong reliability with 99.98% uptime, it has a below average speed and hardware and also lacks CDN. However, FastComet offers excellent value features with email and daily backups included for no additional price. Currency, the host is going through an ownership transition.
We recommend FastComet if you need the cheapest hosting with email and daily backups included for no extra cost plus LiteSpeed and cPanel and if you need a specific non US data center location. It’s also ideal if you prioritise uptime over raw speed and are okay with the WorldHostGroup transition uncertainty. We do not recommend FastComet if you need fast global performance without CDN configuration and look forward to running hardware intensive WordPress sites since it has a low WPBench of 4.8. Besides, it’s not ideal for risk averse users who are skeptical about the ownership transitions related to the 2024 uptime crisis.
FastComet is undergoing a significant change in its history because of WorldHostGroup acquisition, which involves change in data center infrastructure and support team replacement. This also means FastComet of 2026 is different from the FastComet that we monitored in 2020 to 2023. Even though our Q4 2025 data reflects the earliest snapshot of the new version, we need to wait for the Q1 2026 full quarter data for a clearer picture.
Hostinger Business stands out as the single best alternative with a score of 8.02 vs 6.89 and a rank for 5 vs 15 for an intro price of $3.69 per month. The price difference between the two hosts is $1.90 per month which translates to $68.40 over 3 years but you will get CDN included, 223 ms global TTFB, 54% stronger hardware and a stable performance trajectory of this price.
FastComet offers a low intro price of $1.79 per month but the renewal markup of 5x to $8.95 per month is surprisingly high and may shock many users. However, the host offers an unconditional 30 day money back guarantee, which makes things convenient for users.
This review is based on over 525,600 annual performance tests and our testing tools are Pingdom for TTFB and Uptime, Loader.io for load testing, SpeedVitals for global TTFB, and WPBenchmark for server hardware. Our data period is Q4 2025 and our historical monitoring data starts from 2020 to 2026. FasComet has been going through infrastructural transition with the data centers migrating to WorldHostGroup since late 2024. Q1 2026 full quarter data will provide us with more and complete clarity on FastComet’s post transition performance.
Methodology
We purchase all hosting accounts with our own funds and none of them are promotional, press or sponsored accounts. We use tools such as Pingdom for TTFB and Uptime monitoring every 60 minutes, 24/7, Loader.io for load testing with 0 to 100 concurrent users over 60 seconds, SpeedVitals for global TTFB in over 40 cities, and WPBenchmark for conducting 21 server hardware tests across 5 categories.
Our testing frequency consists of over 525,600 individual checks per provider per year with one every 60 seconds. Our testing period is Q4 2025, which is from Oct 1 to Dec 31, 2025 for current rankings. We used the historical data from 2020 onward till 2025 for this review. We tested a total of 34 providers in 2026. Our scoring method comprises 60% on Performance with 15% on TTFB , 15% on Uptime, 15% on Load Test, 10% on Global TTFB, and 5% on Hardware. The next 30% score depends on Features comprising CDN, Email, and Backup and the remaining 10% score depends on the intro price tier value.
Our Load test failure threshold is anything above 50%, leading to a score of 0 out of 10. Our tier classification comprises Elite for anything greater than or equal to 5.0, Strong for 4.5 to 4.99, Below Average for 3.5 to 3.99 and Poor for anything below 3.5.