We are back with our WordPress Hosting Benchmarks for 2026. The report is built on 365 days of continuous monitoring data collected from January 1 to December 31, 2025: 17 hosts with a full year of data, plus 13 providers added on October 1, 2025 with Q4 2025 data.
We purchase our own hosting accounts, set up identical WordPress sites, and monitor them 24/7 at 60-second intervals from 19 North American locations. That produces 525,600 TTFB and uptime checks per host per year, data that is not available anywhere else on the internet. For 2026 performance updates, see our Best WordPress hosting roundup, which we refresh every quarter.
- WP Engine is the fastest host at 365ms average TTFB, taking #1 from Rocket.net (373ms) for the first time since our monitoring began in 2020. It is also the most consistent, with a 244ms gap between its best and worst day.
- Nobody hit 100% uptime. Templ came closest at 99.9996% (2 minutes down, 1 outage). ChemiCloud was the only full-year host below the 99.9% line, at 99.7559% with 67 outages.
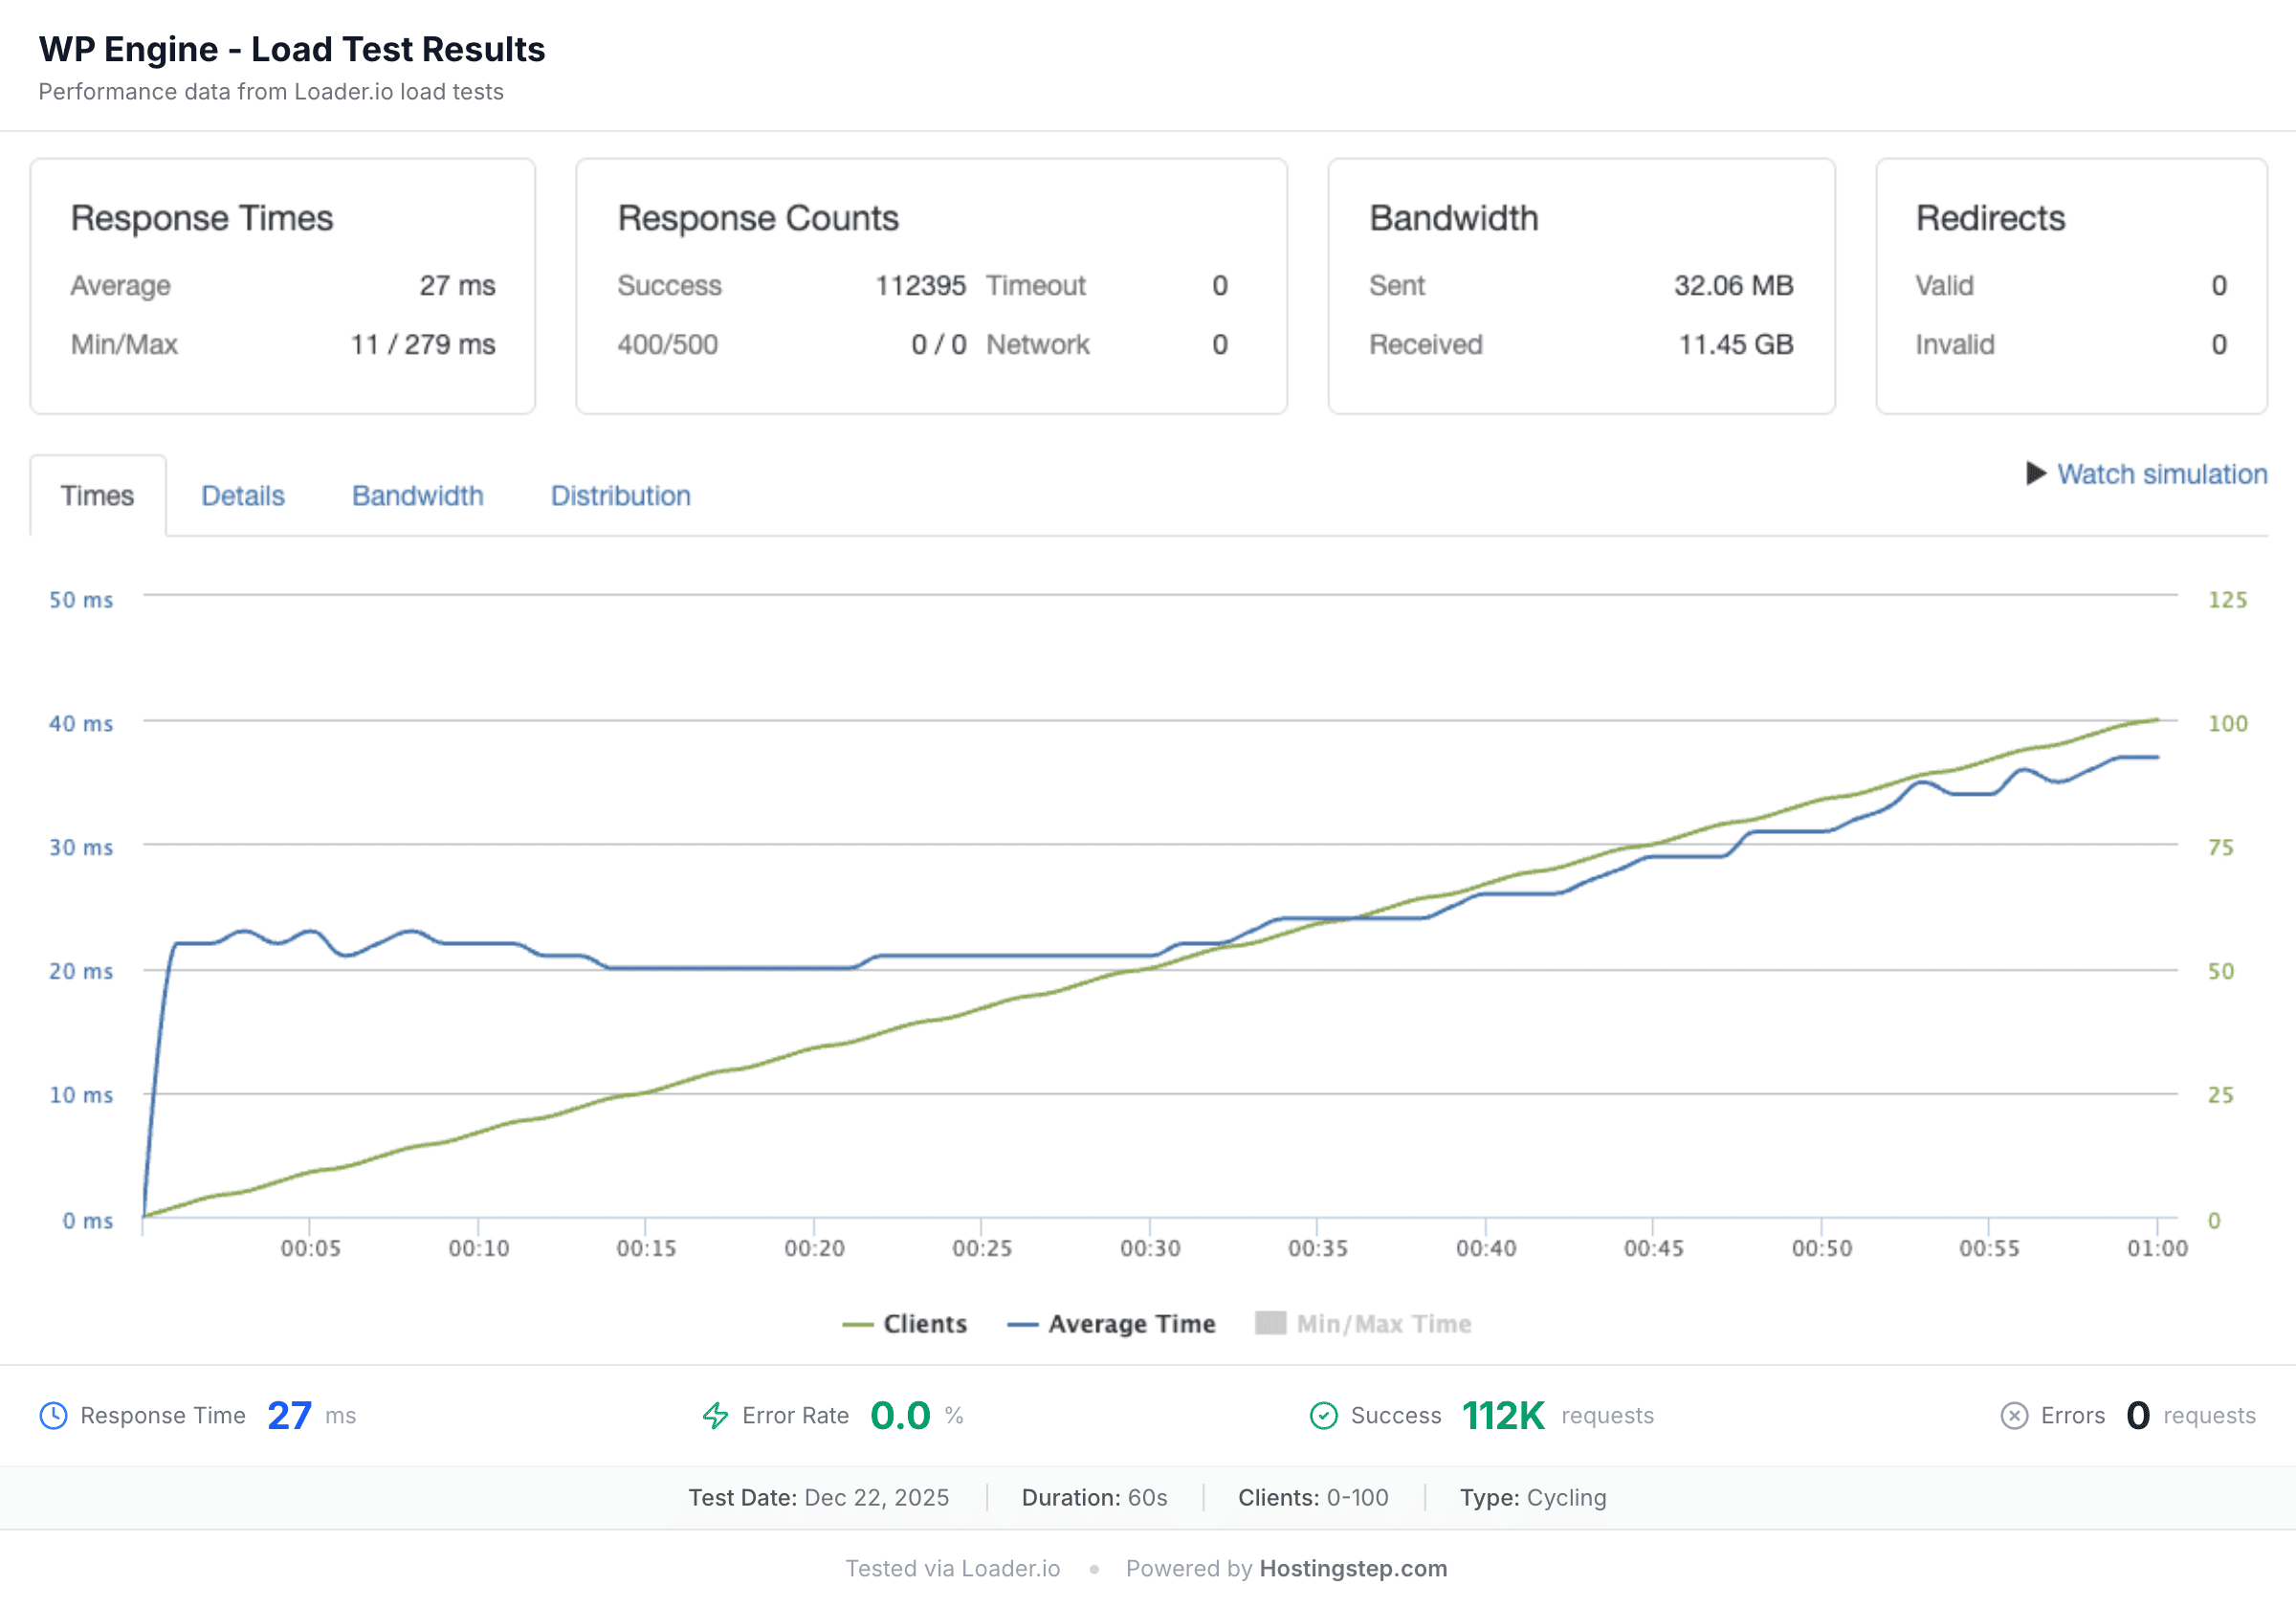
- GreenGeeks is the best shared host and one of three A+ overall grades alongside WP Engine and Templ. Its 26ms load-test response is the fastest shared result we have recorded in five years.
- Bluehost and HostGator jumped to 9.6/10 on WPBench (from 4.0 and 4.3) after their Oracle Cloud migration, the highest resource allocation in the pool.
- Edge-caching CDN hosts average 154ms global TTFB, 3x faster than static-CDN (532ms) or no-CDN hosts (478ms). A static-asset CDN is no faster globally than having no CDN at all.
- Managed WordPress is only 66ms faster than shared on TTFB, but shared hosts suffered 6x more outages (35 vs 5.9 a year). The premium buys reliability, not speed.
- Among the new entrants, Pressable and WordPress.com posted 100% Q4 uptime, 12ms and 16ms load-test results, and sub-75ms global TTFB, the strongest debut in our history.
Provider Report Card
Letter grades across all five benchmark tests, assigned by percentile rank within the pool: A+ (top 15%), A (top 30%), B+ (top 45%), B (top 60%), C (top 75%), D (top 88%), F (bottom). Overall is the average of the five grades, re-ranked on the same scale. Rocket.net has no overall grade because its load test could not run (security block).
Full-Year Report Card (17 hosts, 365 days of data)
 WP Engine
 Templ
Templ GreenGeeks
 Kinsta
 Liquid Web
 Hostinger
 Bluehost
 WPX Hosting
 Cloudways
 Hosting.com
 FastComet
 SiteGround
 DreamPress
 ChemiCloud
 NameHero
 HostGator
 Rocket.net
WP Engine, Templ and GreenGeeks earn an overall A+. None of the 17 hosts earned straight A grades, so every provider has at least one weakness. WP Engine comes closest: A+ in TTFB, load test and global TTFB, A in uptime, and only a B in WPBench holds it back.
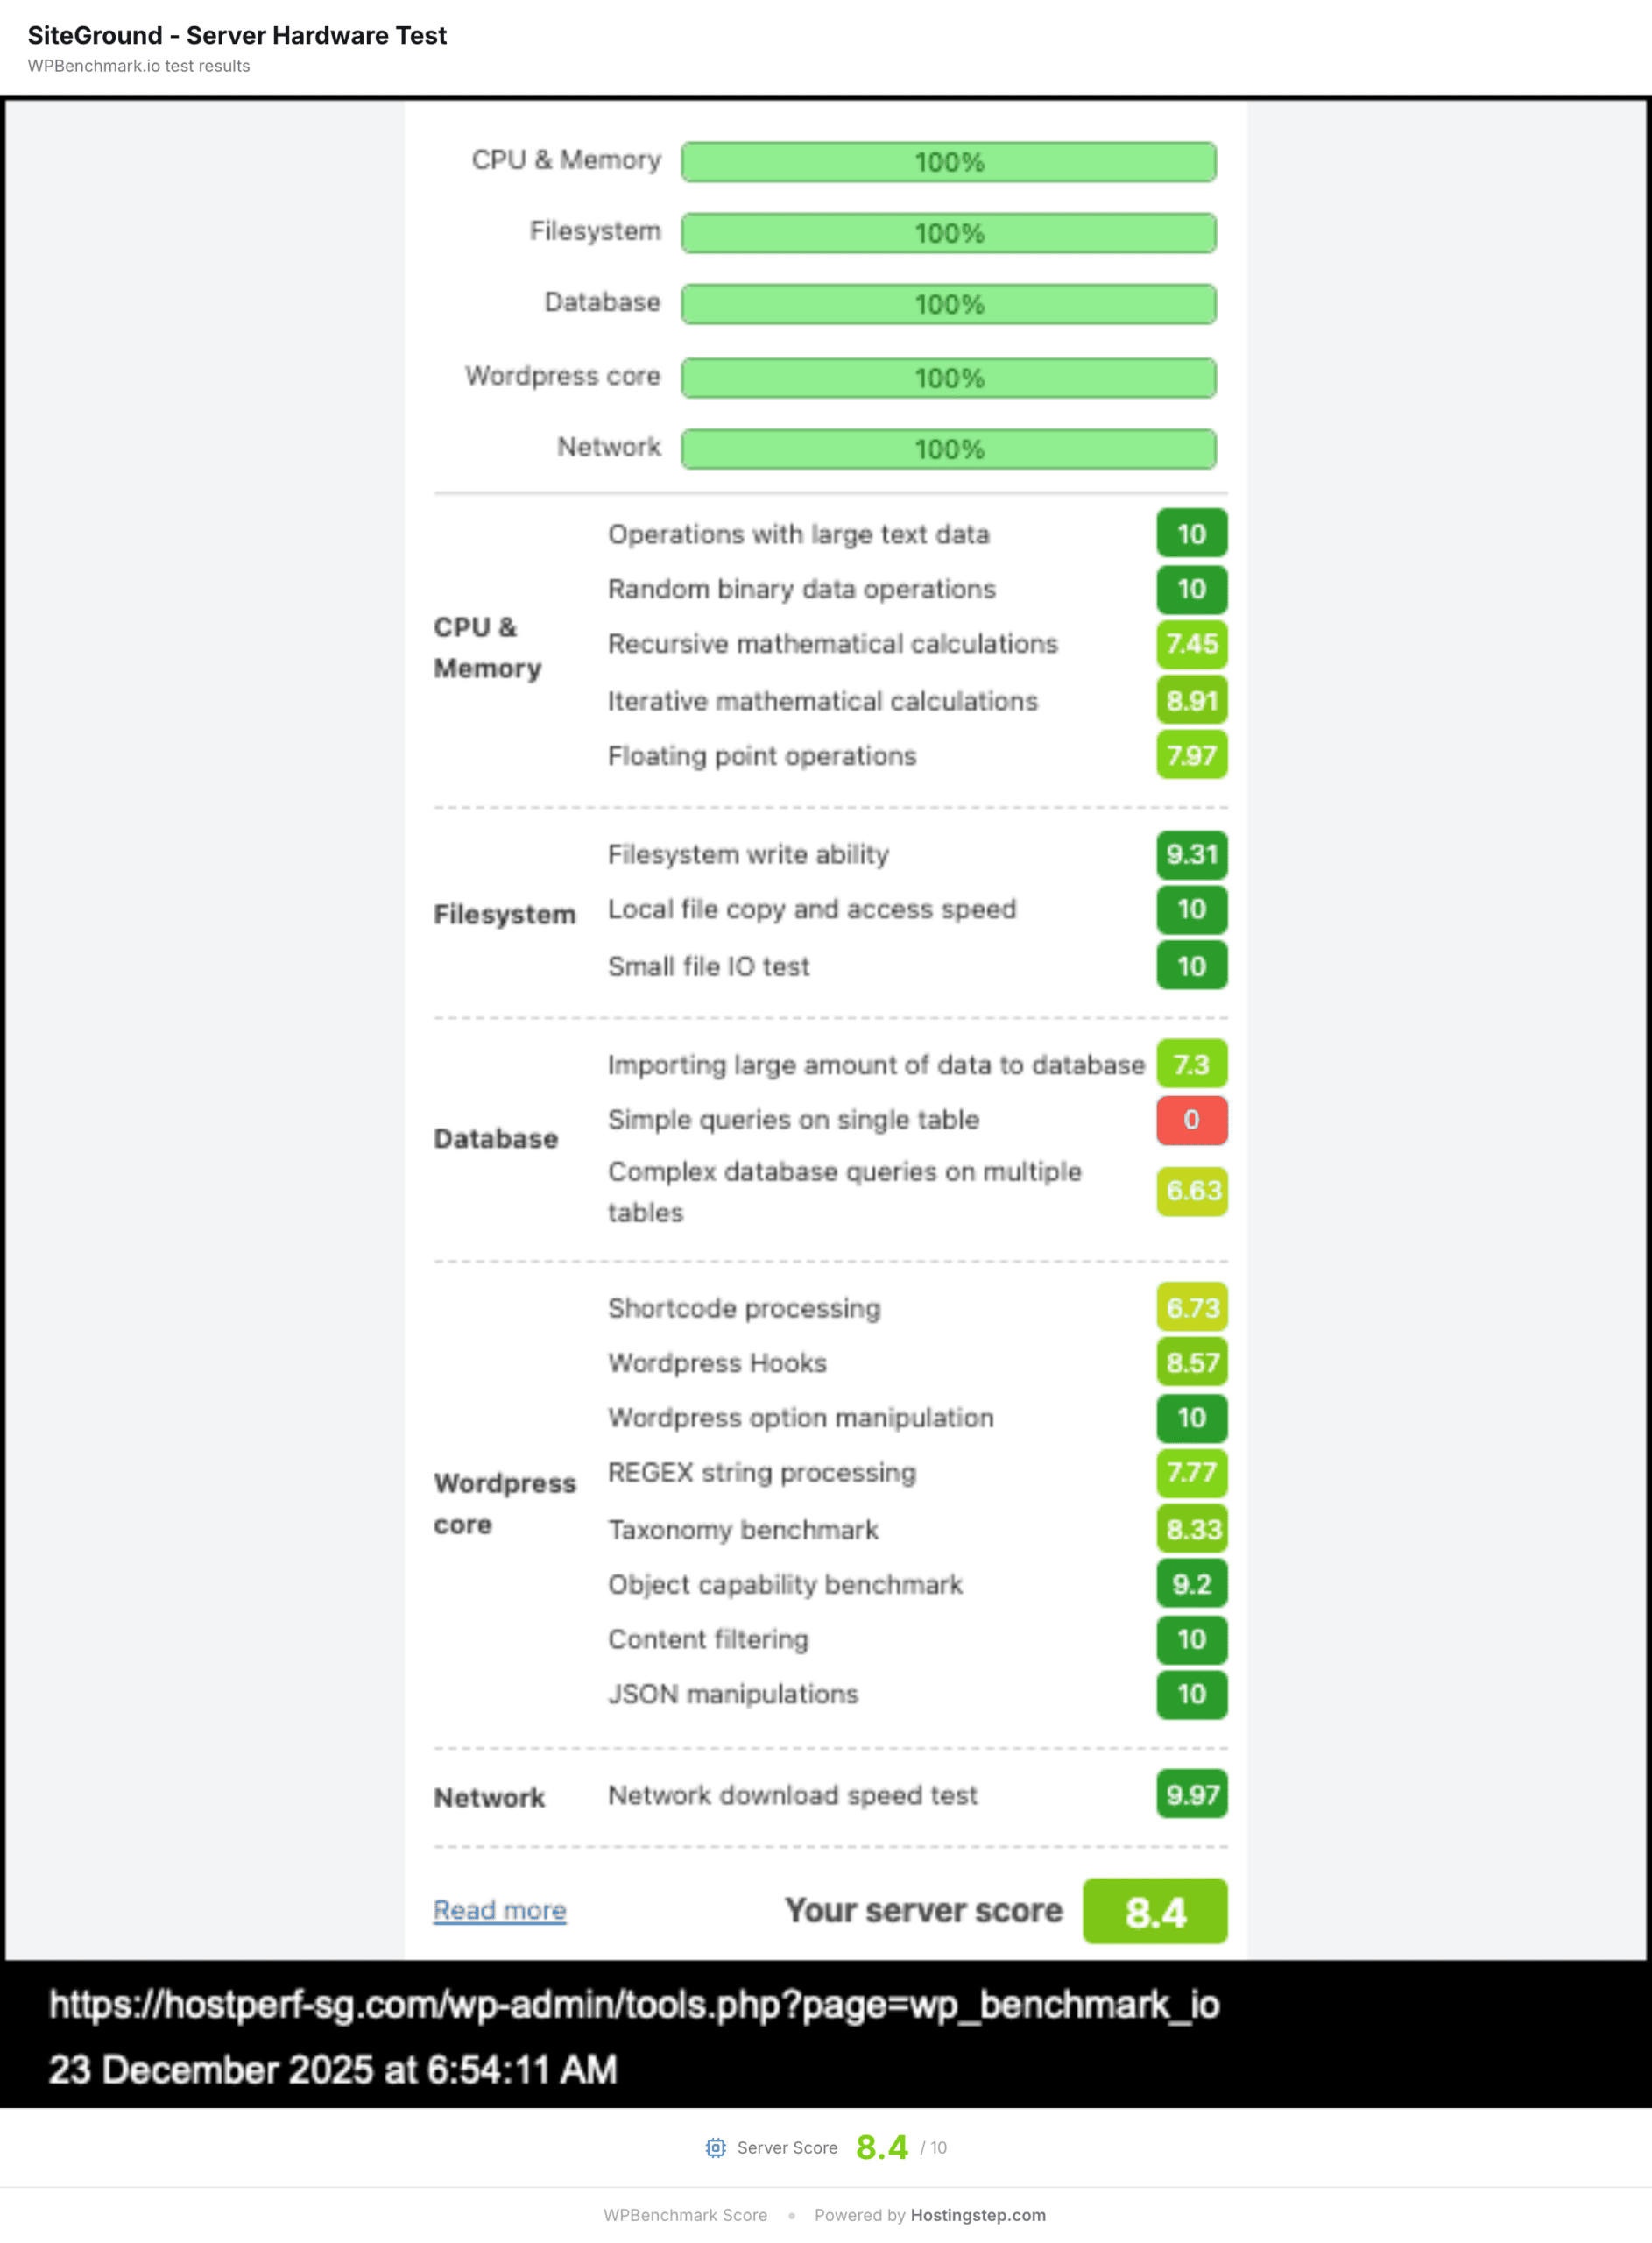
SiteGround is the most polarized host, with A+ in WPBench but F in both TTFB and global TTFB: high resource allocation, slow response times. Bluehost shows a similar split, D in TTFB against A+ in WPBench and A in global TTFB, where the CDN masks a slow origin. GreenGeeks is the best-balanced shared host, with A in TTFB, A+ in load test and no grade below B.
How We Tested
Test site: WordPress 6.9.4, Twenty Twenty-Four theme, PHP 8.4, with Akismet, Contact Form 7 and Rank Math active. Server-side caching on managed WordPress hosts; WP Fastest Cache on most shared hosts; a host’s own caching plugin where one is bundled (SG Optimizer, Breeze).
TTFB and uptime: Pingdom checks every 60 seconds from 19 North American locations (Atlanta, Chicago, Dallas, Denver, Las Vegas, Los Angeles, Matawan, New York, Phoenix, Portland, Salt Lake City, San Francisco, Seattle, St. Louis, Tampa, Washington, Montreal, Toronto, Vancouver) over HTTPS, with a 30-second timeout for downtime. 365 days for the main cohort (525,600 checks per host), 92 days for the Q4 2025 entrants (132,480 checks).
Load test, WPBench and global TTFB are single point-in-time runs, so read them as a snapshot rather than a year-long result. Loader.io sends 100 concurrent clients from AWS US-East for 60 seconds; WPBenchmark scores allocated CPU, memory, filesystem and database throughput from 0 to 10; SpeedVitals measures cached TTFB from 40 worldwide locations.
We tested the cheapest plan each host sells, bought with our own money, with each host’s own CDN and nothing else. If a plan includes a CDN, it was turned on; if not, we added nothing. Higher plans from the same company usually get more CPU and memory and will often be faster; nothing here describes them.
How to read the labels. Google treats TTFB at or under 800ms as good and only calls it poor above 1,800ms. Every full-year host is inside that band, so our labels (“Fastest tested”, “Mid-pack”, “Slower than most”) rank hosts against each other, not against a pass mark. Google’s 800ms line and the 99.9% uptime SLA line are drawn on every chart where they apply. Our figures come from monitoring probes on an identical install, not from Google’s field data on real visitors; the two are related but not the same number.
WordPress Benchmark Test Bench
Plan, monthly price at the time we purchased it, primary datacenter, CDN and benchmark start date for every host in this report.
| Type | Hosting | Plan | Price (mo) | Datacenter | CDN | Benchmark Start |
|---|---|---|---|---|---|---|
| Shared | Bluehost | Starter | $1.99 | North Virginia | Cloudflare | Nov 16, 2022 |
| Shared | ChemiCloud | Starter | $2.95 | Dallas | No | Aug 25, 2020 |
| Managed WP | Cloudways | Cloudways DigitalOcean Standard | $11 | New York | No | Aug 25, 2020 |
| Shared | DreamHost Shared hosting | Shared Starter | $2.95 | Ashburn, VA | No | Oct 1, 2025 |
| Managed WP | DreamPress | DreamPress | $16.95 | Ashburn, Virginia | BunnyCDN | Jan 30, 2021 |
| Managed WP | EasyWP | Starter | $3.88 | Phoenix, Arizona | BunnyCDN | Oct 1, 2025 |
| Shared | FastComet | Starter | $2.95 | Newark, USA | No | Aug 25, 2020 |
| Shared | GoDaddy Shared hosting | Economy | $5.99 | North America | No | Oct 1, 2025 |
| Managed WP | GoDaddy Managed WordPress | Basic | $10.99 | North America | Cloudflare | Oct 1, 2025 |
| Shared | GreenGeeks | Lite | $2.95 | Chicago, US | No | Sep 1, 2020 |
| Shared | HostArmada | Start Dock | $2.49 | Dallas | No | Oct 1, 2025 |
| Shared | HostGator | Hatchling | $3.75 | North Virginia | Cloudflare | Nov 16, 2022 |
| Shared | Hosting.com formerly A2 Hosting | Startup | $2.99 | Michigan (US East) | No | Sep 1, 2020 |
| Shared | Hostinger | Premium | $2.99 | North Carolina | No | Nov 30, 2020 |
| Shared | Hostinger Business | Business | $3.69 | Virginia | Hostinger CDN | Oct 1, 2025 |
| Shared | InMotion Hosting | Core | $2.99 | Los Angeles | No | Oct 1, 2025 |
| Shared | InterServer | Standard Web Hosting | $2.50 | Secaucus, NJ | No | Oct 1, 2025 |
| Shared | IONOS | Essential | $4.00 | Lenexa, KS | No | Oct 1, 2025 |
| Managed WP | Kinsta | Starter | $35 | Iowa, Google Cloud 2025 test site; moved to Oracle Cloud in 2026 | Cloudflare | Sep 1, 2020 |
| Managed WP | Liquid Web formerly Nexcess | Spark Thrive | $10 | Southfield, Michigan | Cloudflare Enterprise | Sep 1, 2020 |
| Shared | Namecheap | Stellar | $1.98 | Phoenix, Arizona | No | Oct 1, 2025 |
| Shared | NameHero | Starter Cloud | $2.91 | Los Angeles | No | Apr 1, 2023 |
| Managed WP | Pressable | Starter (1-site) | $25 | Dallas, TX | In-house CDN | Oct 1, 2025 |
| Managed WP | Rocket.net | Starter | $30 | Ashburn | Cloudflare Enterprise | Oct 12, 2020 |
| Shared | ScalaHosting | Mini | $2.95 | Dallas | Cloudflare | Oct 1, 2025 |
| Shared | SiteGround | Startup | $3.99 | Iowa | SiteGround CDN | Aug 26, 2020 |
| Managed WP | Templ | Micro | $15 | North Virginia, Google Cloud | Google Cloud CDN | Feb 3, 2021 |
| Managed WP | WordPress.com | Personal | $2.95 | Dallas, TX | In-house CDN | Oct 1, 2025 |
| Managed WP | WP Engine | Startup | $27 | North America | Cloudflare | Sep 1, 2020 |
| Managed WP | WPX Hosting | Business | $24.99 | Chicago | WPX XDN | Mar 26, 2021 |
Benchmark Test 1: TTFB (Time to First Byte)
TTFB is the time the server takes to start responding to a request, averaged across 19 North American locations at 60-second intervals: 43,800 tests per month and 525,600 per year, per provider.
WP EngineRocket.netTemplWPX HostingGreenGeeksCloudwaysKinstaHosting.comNameHeroHostingerLiquid WebFastCometChemiCloudBluehostHostGatorSiteGroundDreamPress| # | Hosting | Average TTFB | vs pool median (476ms) |
|---|---|---|---|
| 1 | WP Engine | 365ms | −23% |
| 2 | Rocket.net | 373ms | −22% |
| 3 | Templ | 386ms | −19% |
| 4 | WPX Hosting | 411ms | −14% |
| 5 | GreenGeeks | 422ms | −11% |
| 6 | Cloudways | 449ms | −6% |
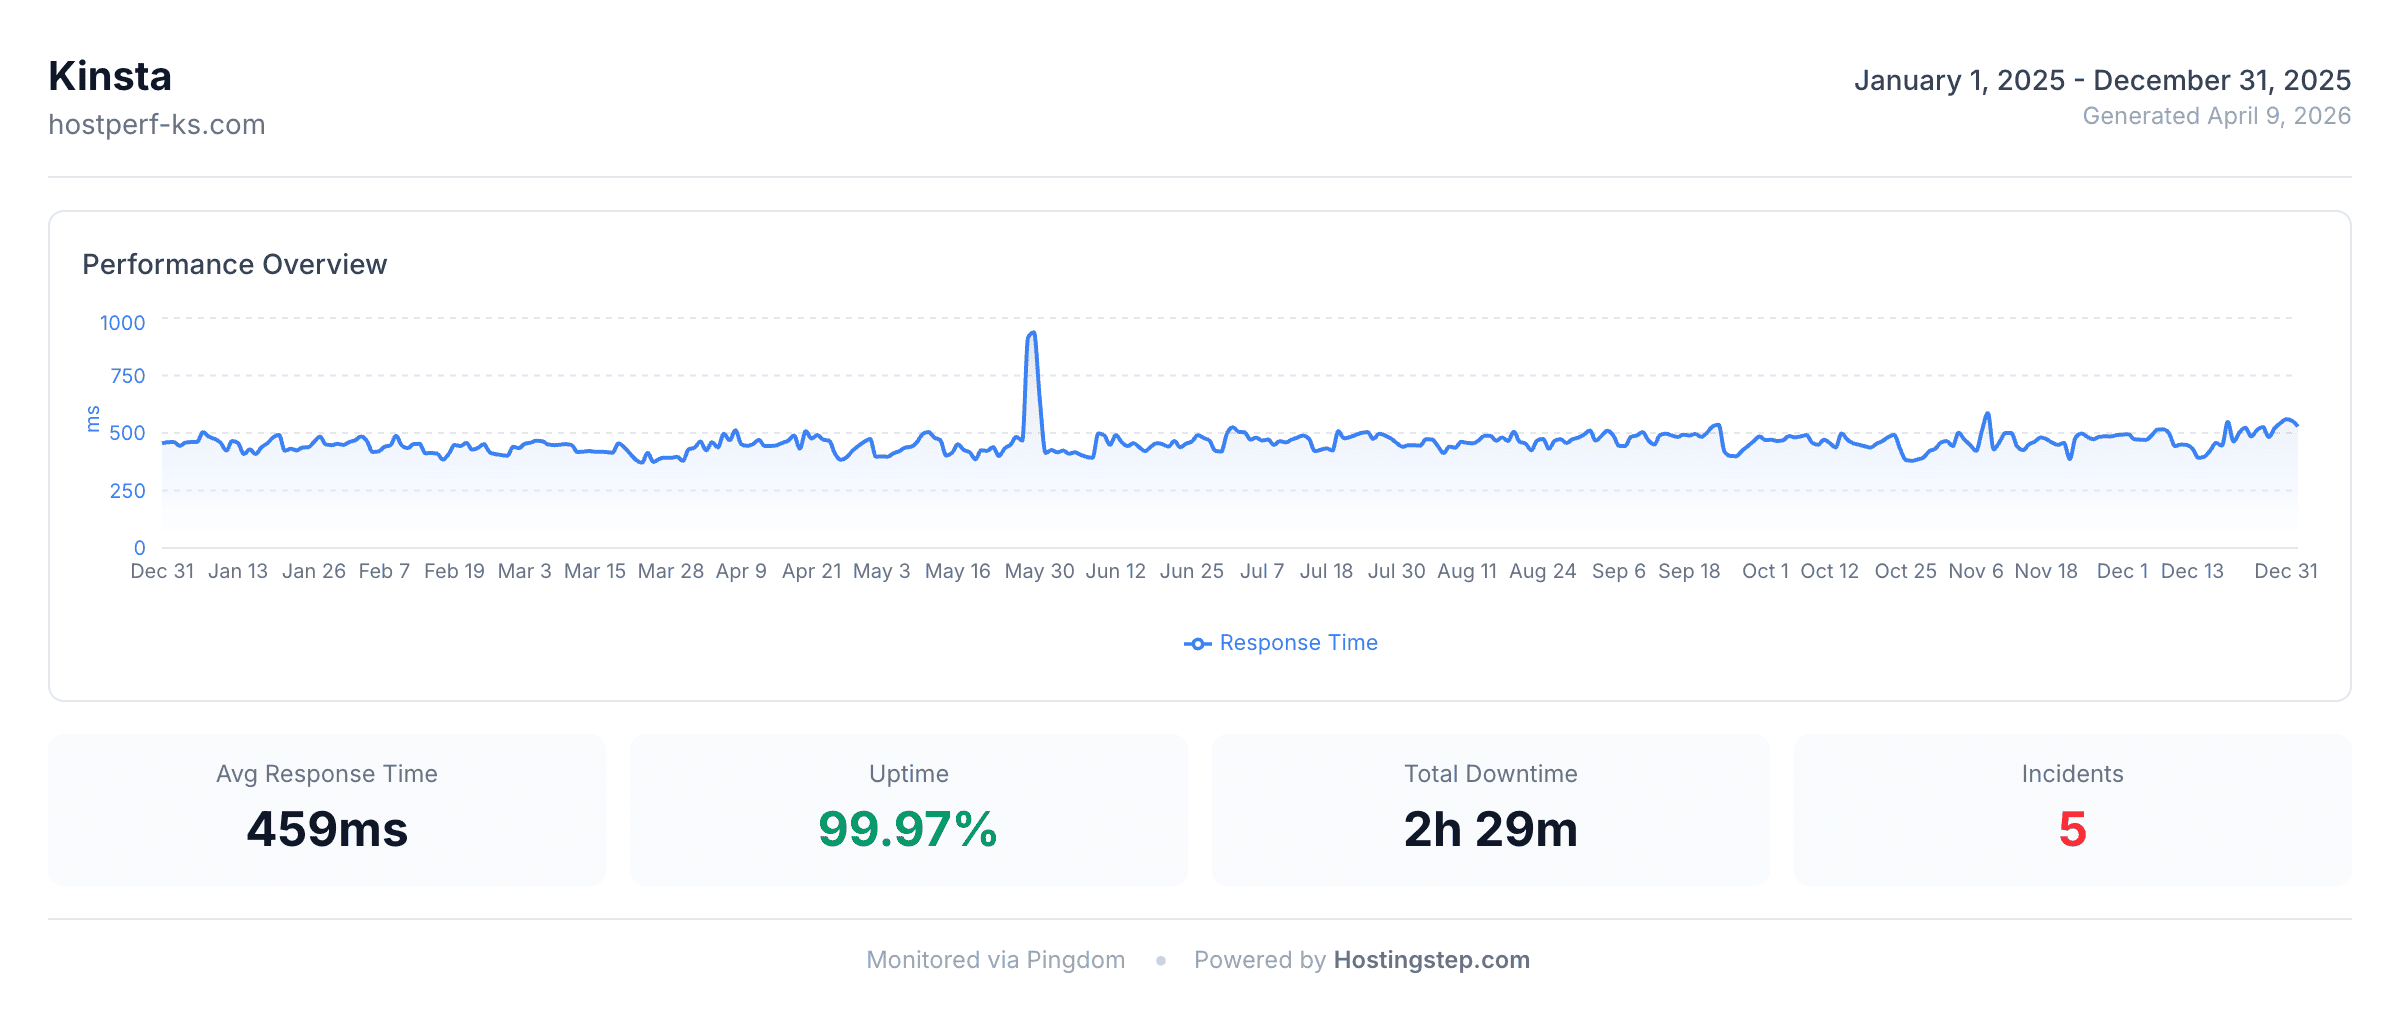
| 7 | Kinsta | 459ms | −4% |
| 8 | Hosting.com | 470ms | −1% |
| 9 | NameHero | 476ms | 0% |
| 10 | Hostinger | 483ms | +1% |
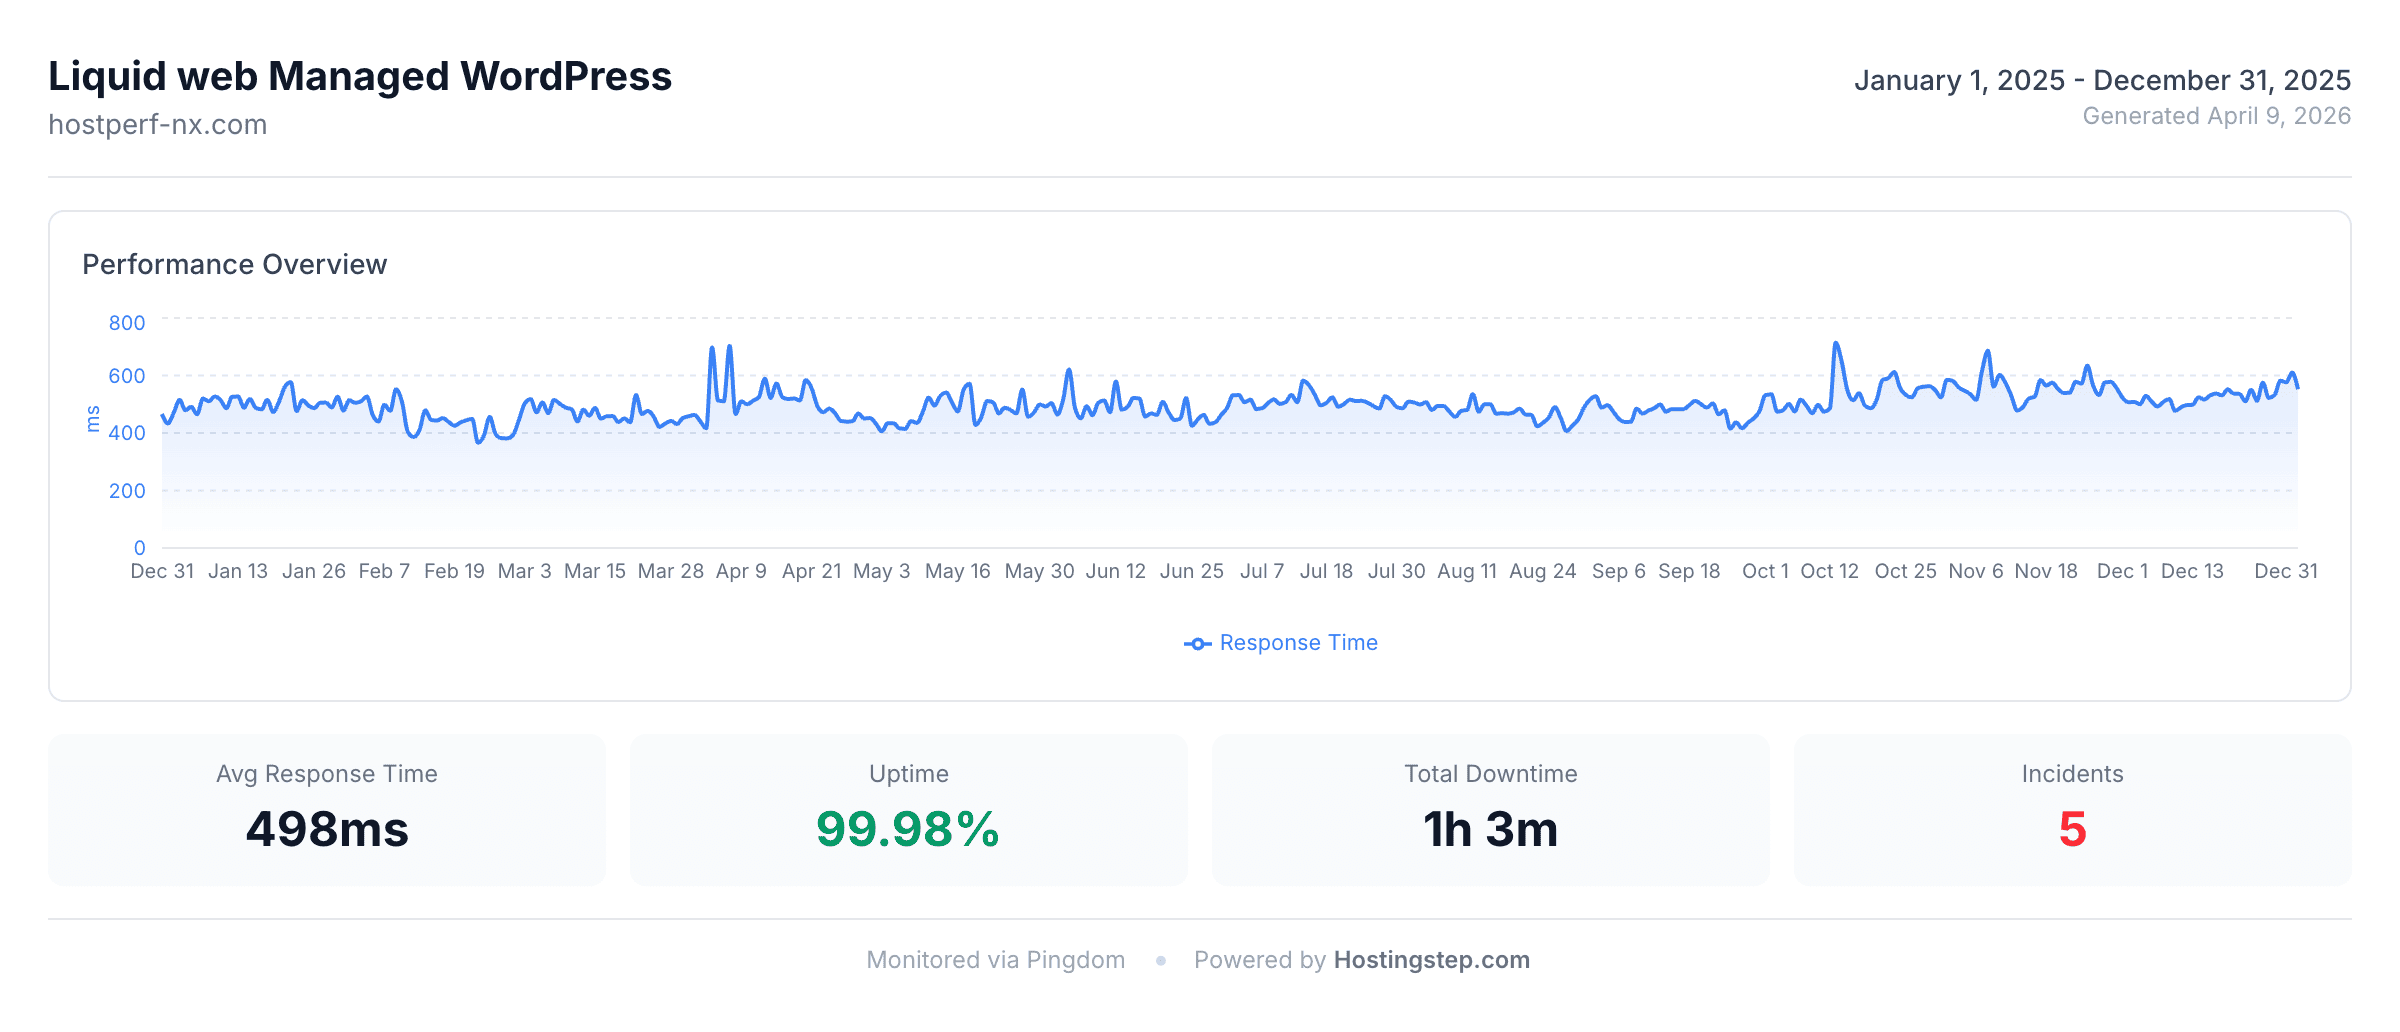
| 11 | Liquid Web | 497ms | +4% |
| 12 | FastComet | 521ms | +9% |
| 13 | ChemiCloud | 528ms | +11% |
| 14 | Bluehost | 532ms | +12% |
| 15 | HostGator | 580ms | +22% |
| 16 | SiteGround | 632ms | +33% |
| 17 | DreamPress | 663ms | +39% |
WP Engine takes #1 in TTFB for the first time since our monitoring began in 2020, at 365ms. Rocket.net drops to #2 at 373ms after four consecutive years on top (2021–2024). Templ holds #3 at 386ms. All three sit under 400ms, and the gap between them is 21ms, so the top of the pool is closer than it has been in any previous year.
The gap between the fastest and slowest host is 298ms, so hosting choice alone accounts for nearly a 2x difference in server response time.
GreenGeeks (422ms) is the fastest shared host and beats five managed WordPress providers costing 5–10x more, including Kinsta and Liquid Web. Liquid Web crosses under 500ms for the first time in our testing at 497ms. Bluehost’s 532ms is a blend of old infrastructure and its Q4 2025 Oracle Cloud migration; the Q1 2026 figures in our Bluehost review show where it has settled.
At the bottom, DreamPress (663ms) is the slowest full-year host even after we enabled the CDN it added in 2025, and it has regressed from 437ms in 2024. SiteGround (632ms) has slipped every year since 2022 (403ms → 632ms). HostGator (580ms) is the only host in the bottom three that improved, down 26.5% from 789ms after its Oracle Cloud migration.
 WP Engine
 Rocket.net
 Templ
Templ WPX
WPX GreenGeeks
 Cloudways
 Kinsta
 Hosting.com
 NameHero
 Hostinger
 Liquid Web
 FastComet
 ChemiCloud
 Bluehost
 HostGator
 SiteGround
 DreamPress
Benchmark Test 2: Uptime
Uptime is measured by the same Pingdom checks from 19 North American locations with a 30-second timeout. If the site does not respond within the threshold, downtime is recorded. The bar shows total downtime in minutes; the percentage, minutes and outage count print beside it because two hosts at 99.99% can have very different years.
TemplCloudwaysWPX HostingWP EngineRocket.netHostingerLiquid WebBluehostGreenGeeksKinstaSiteGroundDreamPressHosting.comNameHeroFastCometHostGatorChemiCloud| # | Hosting | Uptime | Downtime | Total outages |
|---|---|---|---|---|
| 1 | Templ | 99.9996% | 2 min | 1 |
| 2 | Cloudways | 99.9977% | 12 min | 8 |
| 3 | WPX Hosting | 99.9969% | 16 min | 9 |
| 4 | WP Engine | 99.9952% | 25 min | 1 |
| 5 | Rocket.net | 99.9943% | 30 min | 2 |
| 6 | Hostinger | 99.9937% | 33 min | 11 |
| 7 | Liquid Web | 99.9880% | 1h 3m | 5 |
| 8 | Bluehost | 99.9744% | 2h 14m | 14 |
| 9 | GreenGeeks | 99.9737% | 2h 18m | 21 |
| 10 | Kinsta | 99.9714% | 2h 29m | 5 |
| 11 | SiteGround | 99.9629% | 3h 13m | 44 |
| 12 | DreamPress | 99.9557% | 3h 53m | 16 |
| 13 | Hosting.com | 99.9425% | 5h 1m | 49 |
| 14 | NameHero | 99.9385% | 5h 22m | 51 |
| 15 | FastComet | 99.9233% | 6h 43m | 39 |
| 16 | HostGator | 99.9104% | 7h 50m | 19 |
| 17 | ChemiCloud | 99.7559% | 21h 22m | 67 |
Zero hosts achieved 100% uptime in 2025. Templ came closest at 99.9996% with just 2 minutes of total downtime and a single outage. WP Engine’s only outage was a scheduled 25-minute maintenance window during its infrastructure upgrade; without it, WP Engine would have posted 100%.
The percentage hides the differences. Six hosts sit at 99.99%+, but their downtime ranges from 2 minutes (Templ) to 33 minutes (Hostinger) and their outage counts from 1 to 11. Hostinger’s 33 minutes is still the best result of any shared host in the pool.
Kinsta’s 149 minutes came from just 5 outages, most of them the 2025 Cloudflare incidents that sit in its infrastructure stack; it recorded 99.995% in 2023 and 99.999% in 2024. NameHero (51 outages), Hosting.com (49) and SiteGround (44) had the most frequent interruptions among hosts that still cleared the 99.9% line.
ChemiCloud is the only full-year host below the 99.9% line, and below its own 99.99% SLA: 67 outages, 1,282 minutes of downtime and a worst single day at 57.73% uptime, nearly 10 hours offline. HostGator’s worst day was 79.38% and FastComet’s 82.29%, roughly 5 and 4 hours down in a single day.
 Templ
Templ Cloudways
 WPX
WPX WP Engine
 Rocket.net
 Hostinger
 Liquid Web
 Bluehost
 GreenGeeks
 Kinsta
 SiteGround
 DreamPress
 Hosting.com
 NameHero
 FastComet
 HostGator
 ChemiCloud
Benchmark Test 3: Load Testing
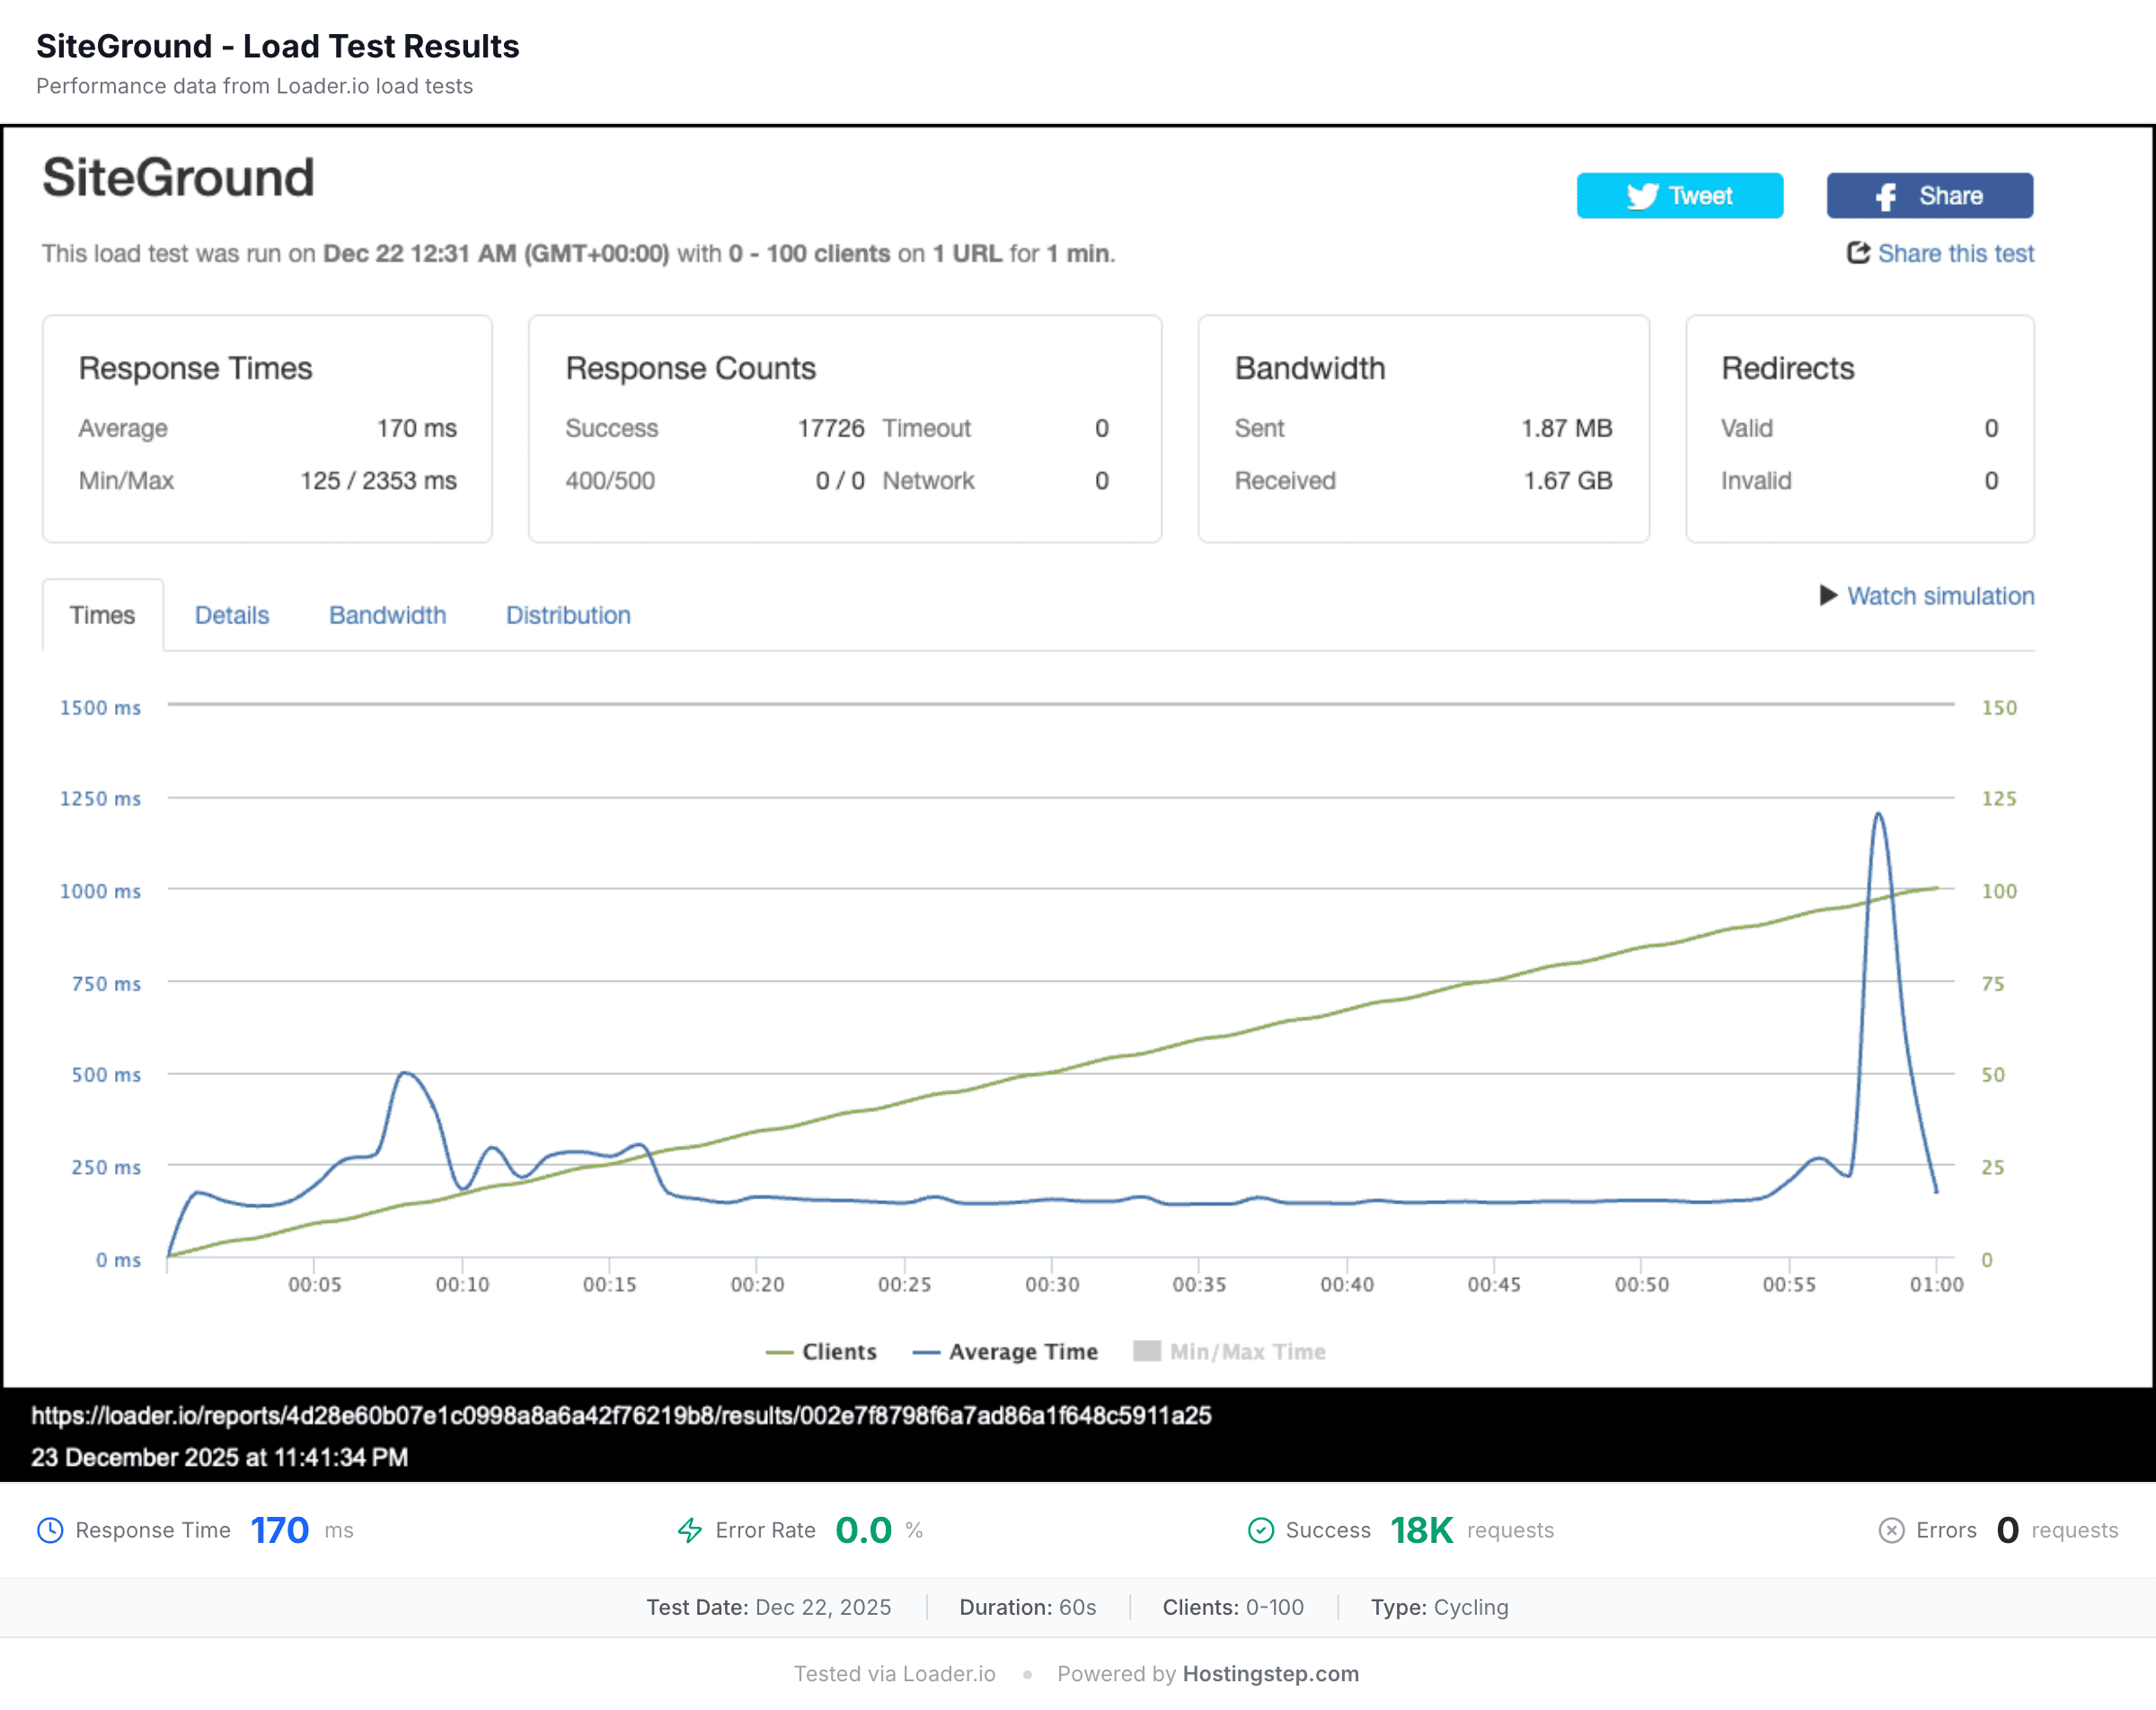
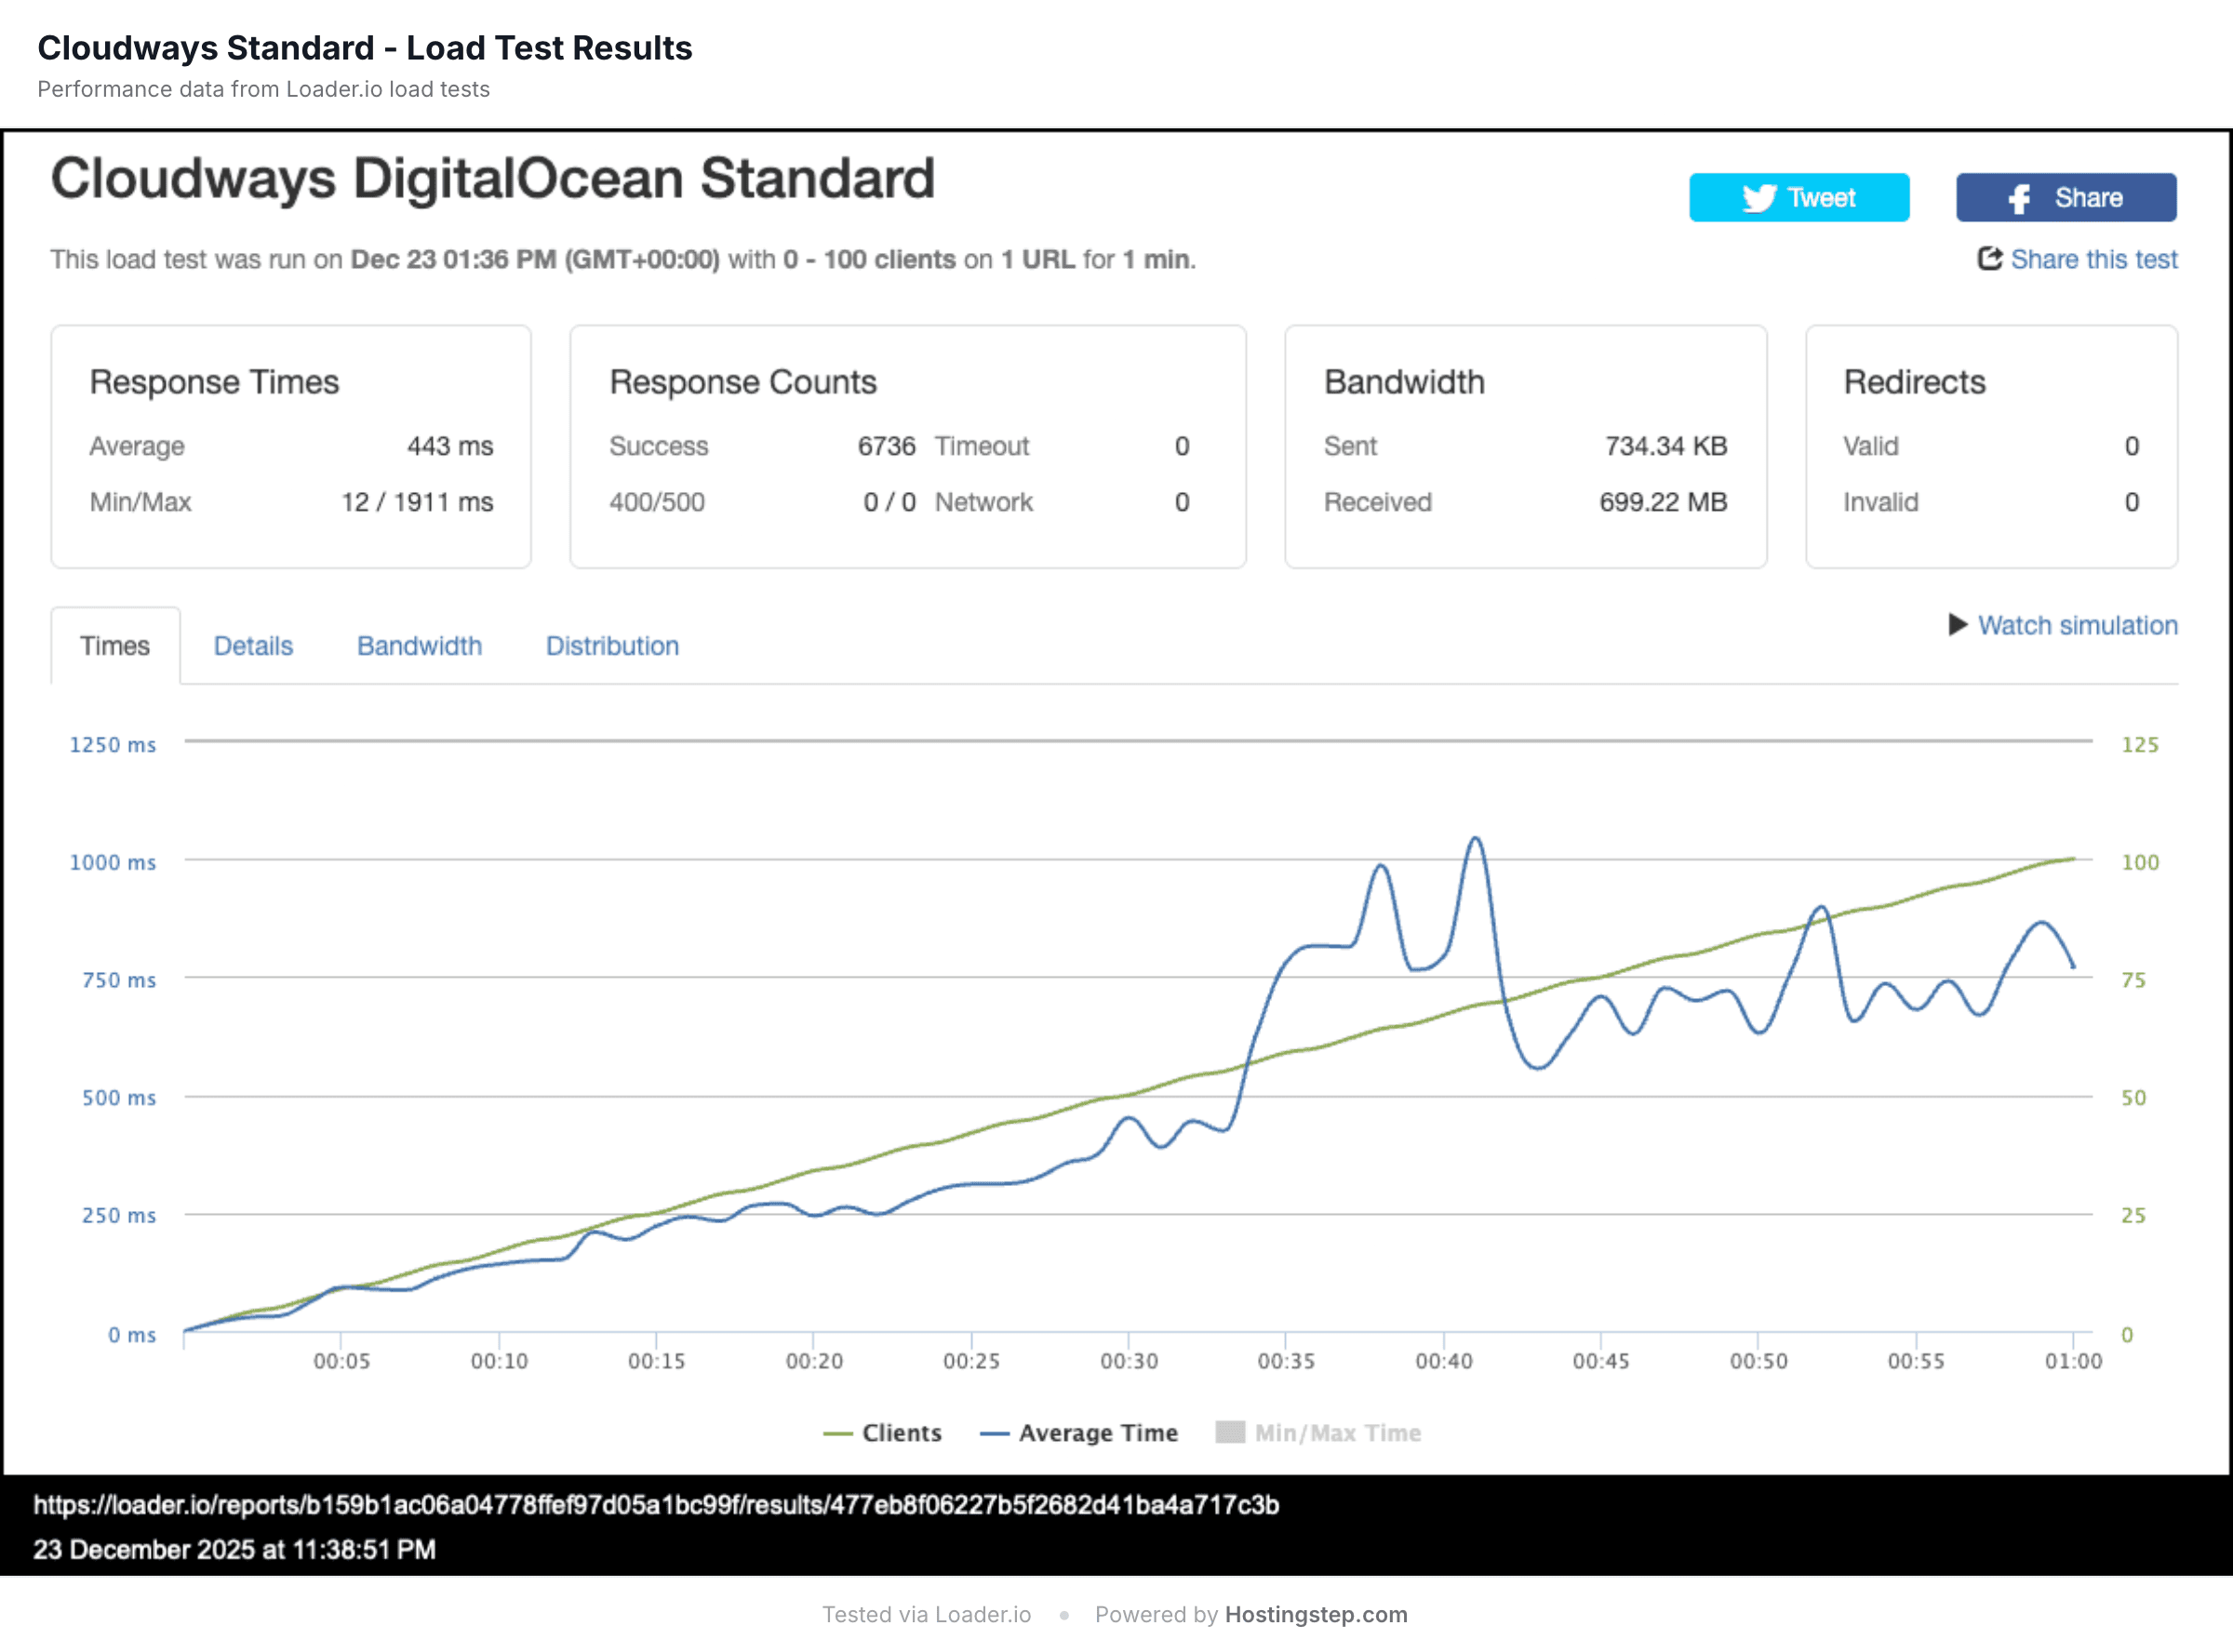
The load test measures how each host handles sustained concurrent traffic. Loader.io sends 100 simultaneous clients to the entry-plan test site from AWS US-East for 60 seconds and records the average response time and error rate. It is a synthetic test run once under identical conditions, not a measurement of real visitor experience.
 Pressable
 WordPress.comGreenGeeksWP EngineHostinger Business
 InMotionHosting
 HostArmada
 GoDaddy Managed WPKinstaBluehostHosting.comWPX Hosting
 ScalaHostingTemplLiquid WebFastCometInterserver
 EasyWPDreamHost (Shared)NameCheapSiteGroundHostGatorDreamPressHostingerNameHeroCloudwaysChemiCloud
 IonosGoDaddy (Shared)Rocket.net
| # | Hosting | Avg response time | Error rate |
|---|---|---|---|
| 1 | Pressable | 12ms | 0% |
| 2 | WordPress.com | 16ms | 0% |
| 3 | GreenGeeks | 26ms | 0% |
| 4 | WP Engine | 27ms | 0% |
| 5 | Hostinger Business | 31ms | 0% |
| 6 | InMotionHosting | 31ms | 0% |
| 7 | HostArmada | 32ms | 0% |
| 8 | GoDaddy Managed WP | 35ms | 0% |
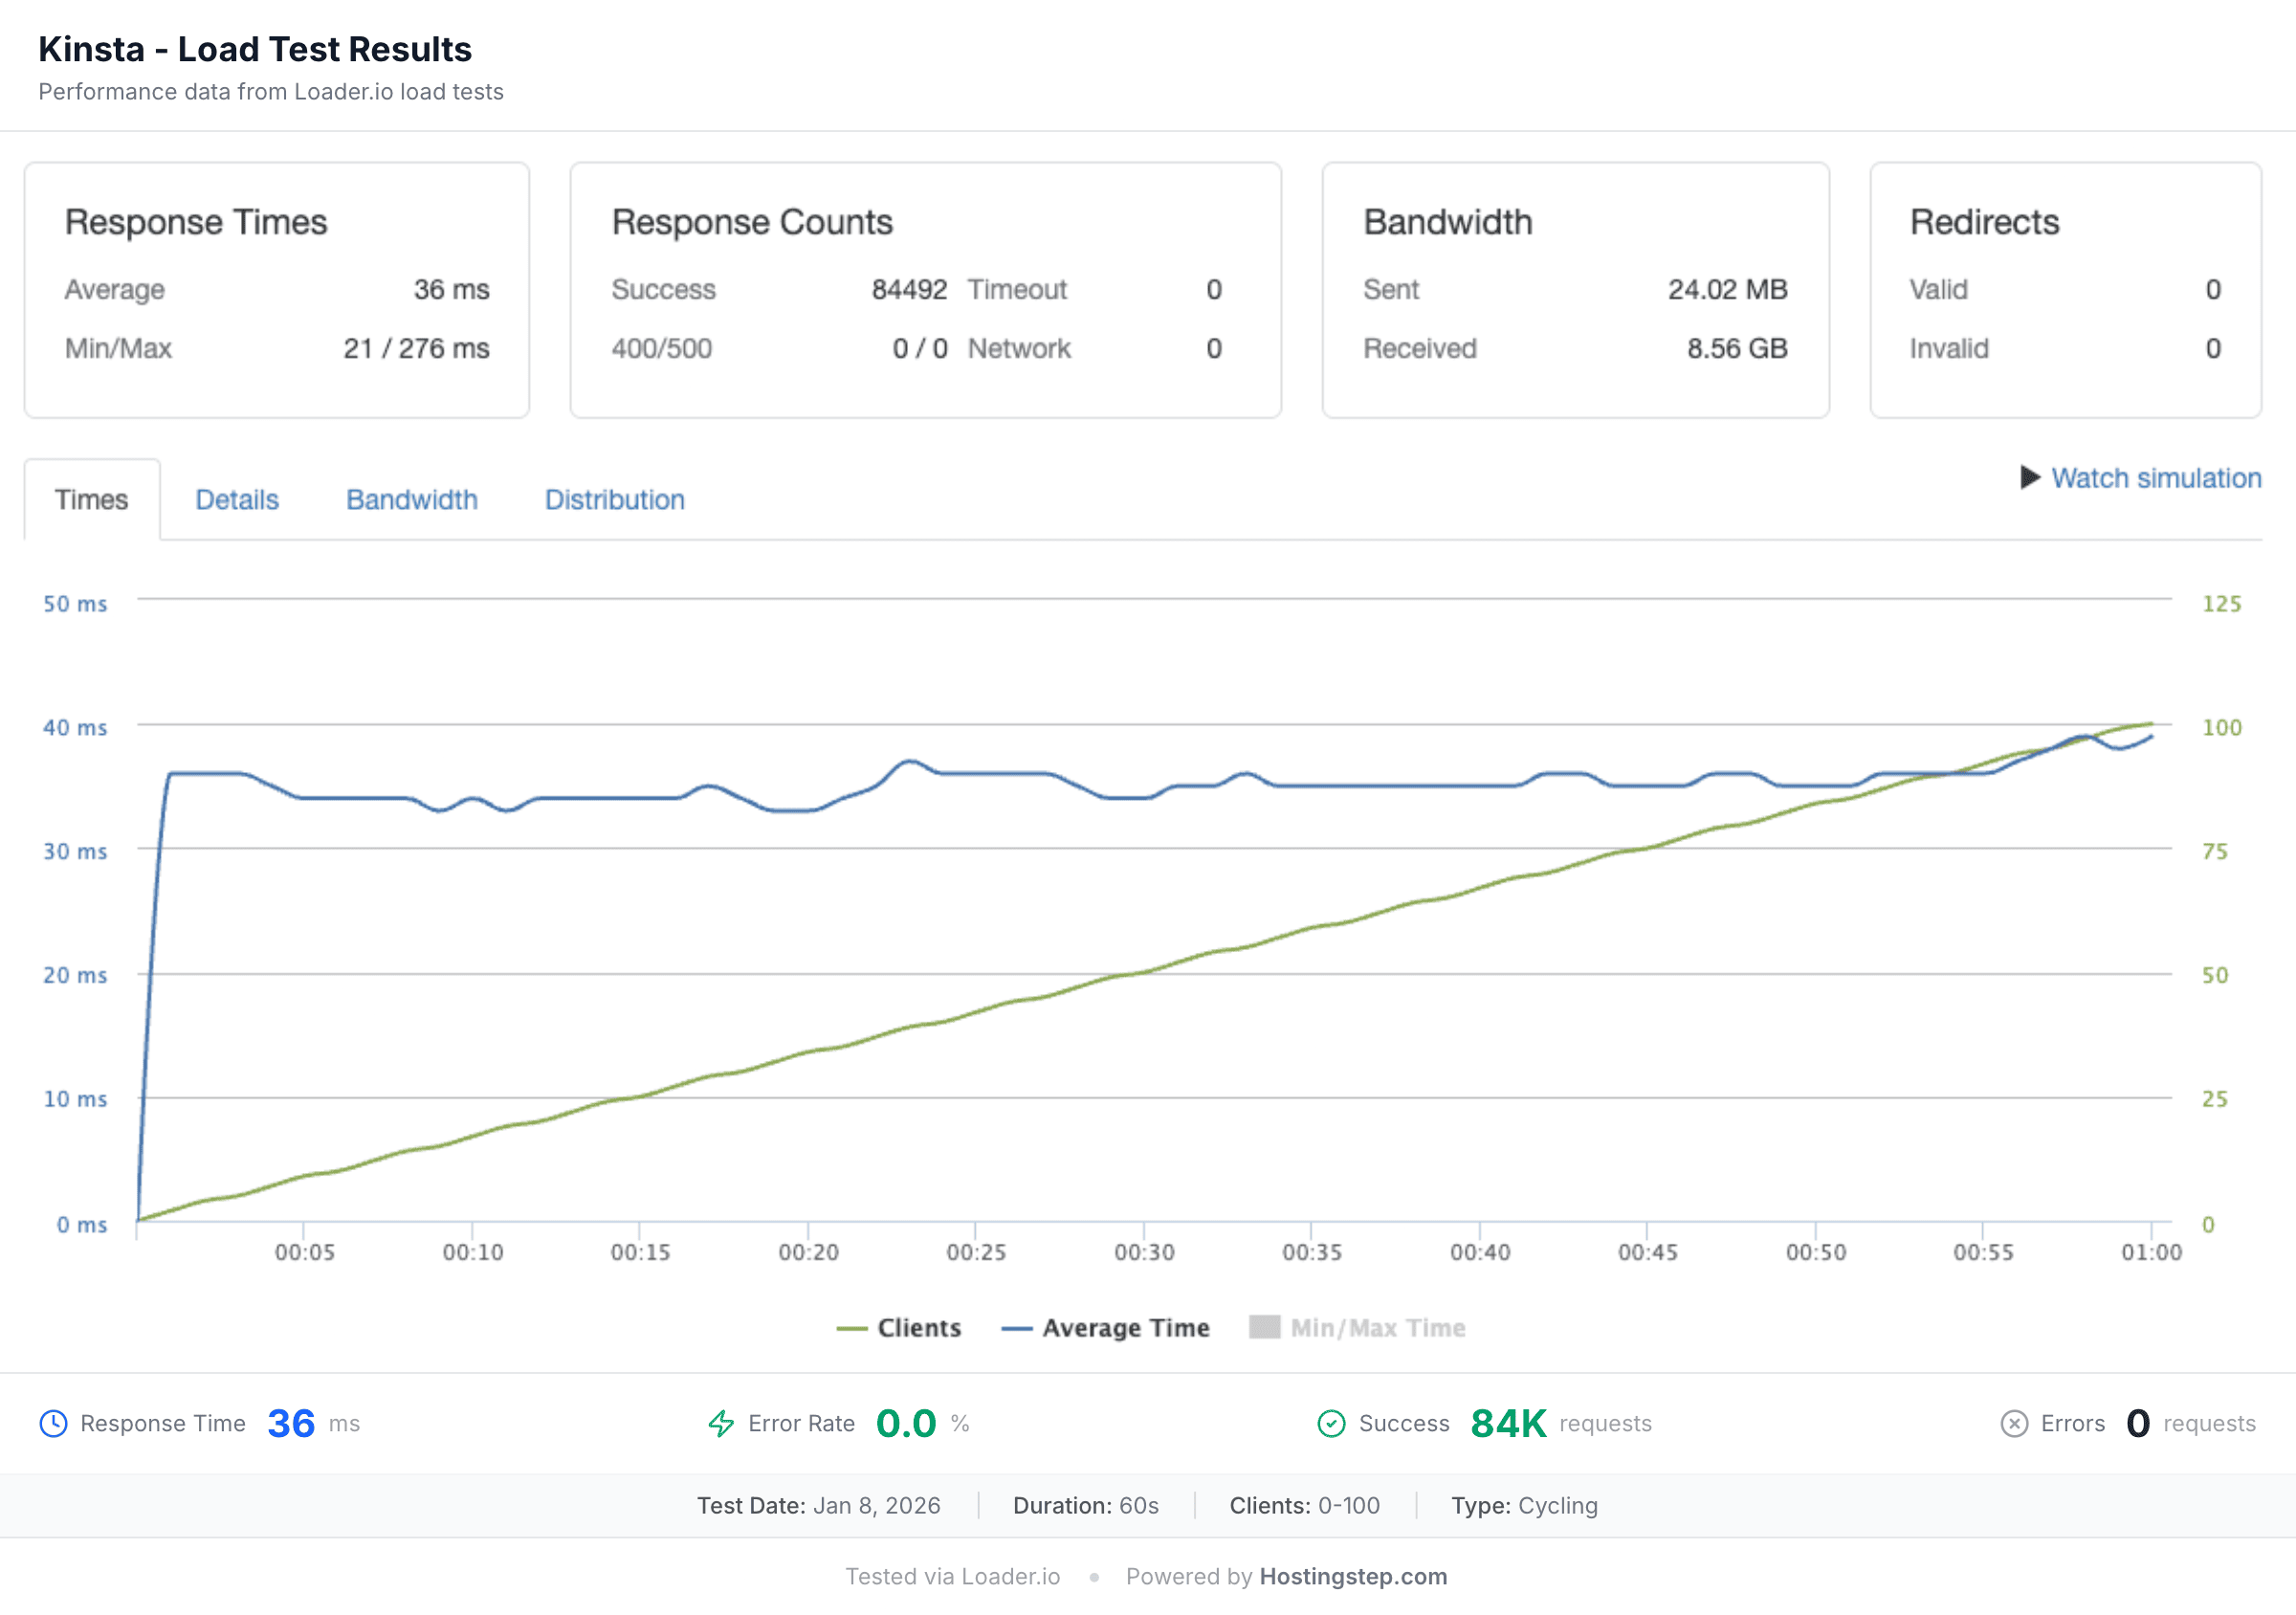
| 9 | Kinsta | 40ms | 0% |
| 10 | Bluehost | 41ms | 0% |
| 11 | Hosting.com | 43ms | 0% |
| 12 | WPX Hosting | 45ms | 0% |
| 13 | ScalaHosting | 48ms | 0% |
| 14 | Templ | 58ms | 0% |
| 15 | Liquid Web | 60ms | 0% |
| 16 | FastComet | 78ms | 0% |
| 17 | Interserver | 80ms | 0% |
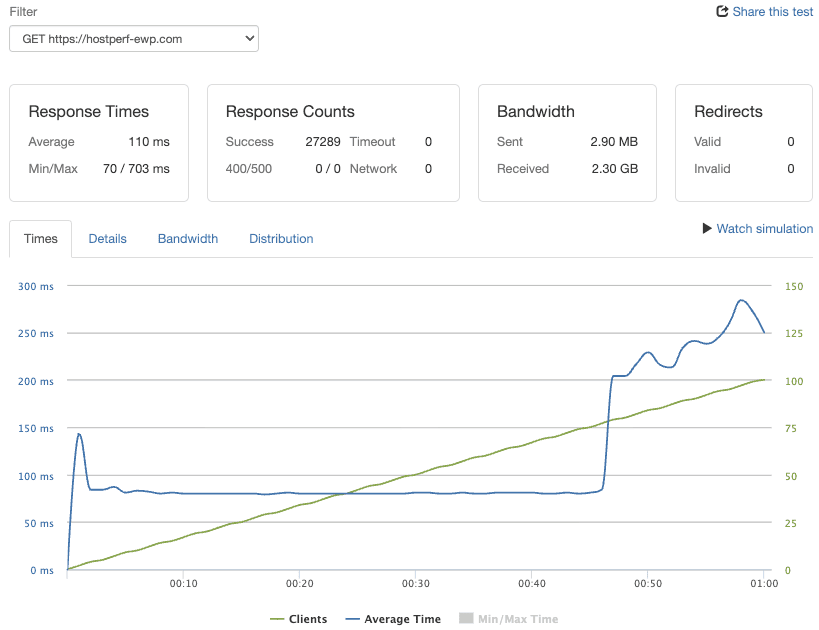
| 18 | EasyWP | 110ms | 0% |
| 19 | DreamHost (Shared) | 147ms | 0% |
| 20 | NameCheap | 150ms | 0% |
| 21 | SiteGround | 170ms | 0% |
| 22 | HostGator | 213ms | 2.0% |
| 23 | DreamPress | 221ms | 0.1% |
| 24 | Hostinger | 245ms | 0% |
| 25 | NameHero | 257ms | 56% · connection ceiling at ~80 concurrent users |
| 26 | Cloudways | 282ms | 2% |
| 27 | ChemiCloud | 1,068ms | 4.2% |
| – | Ionos | Did not complete | 65.4% · stopped in first 30s |
| – | GoDaddy (Shared) | Did not complete | 68.8% · stopped in first 30s |
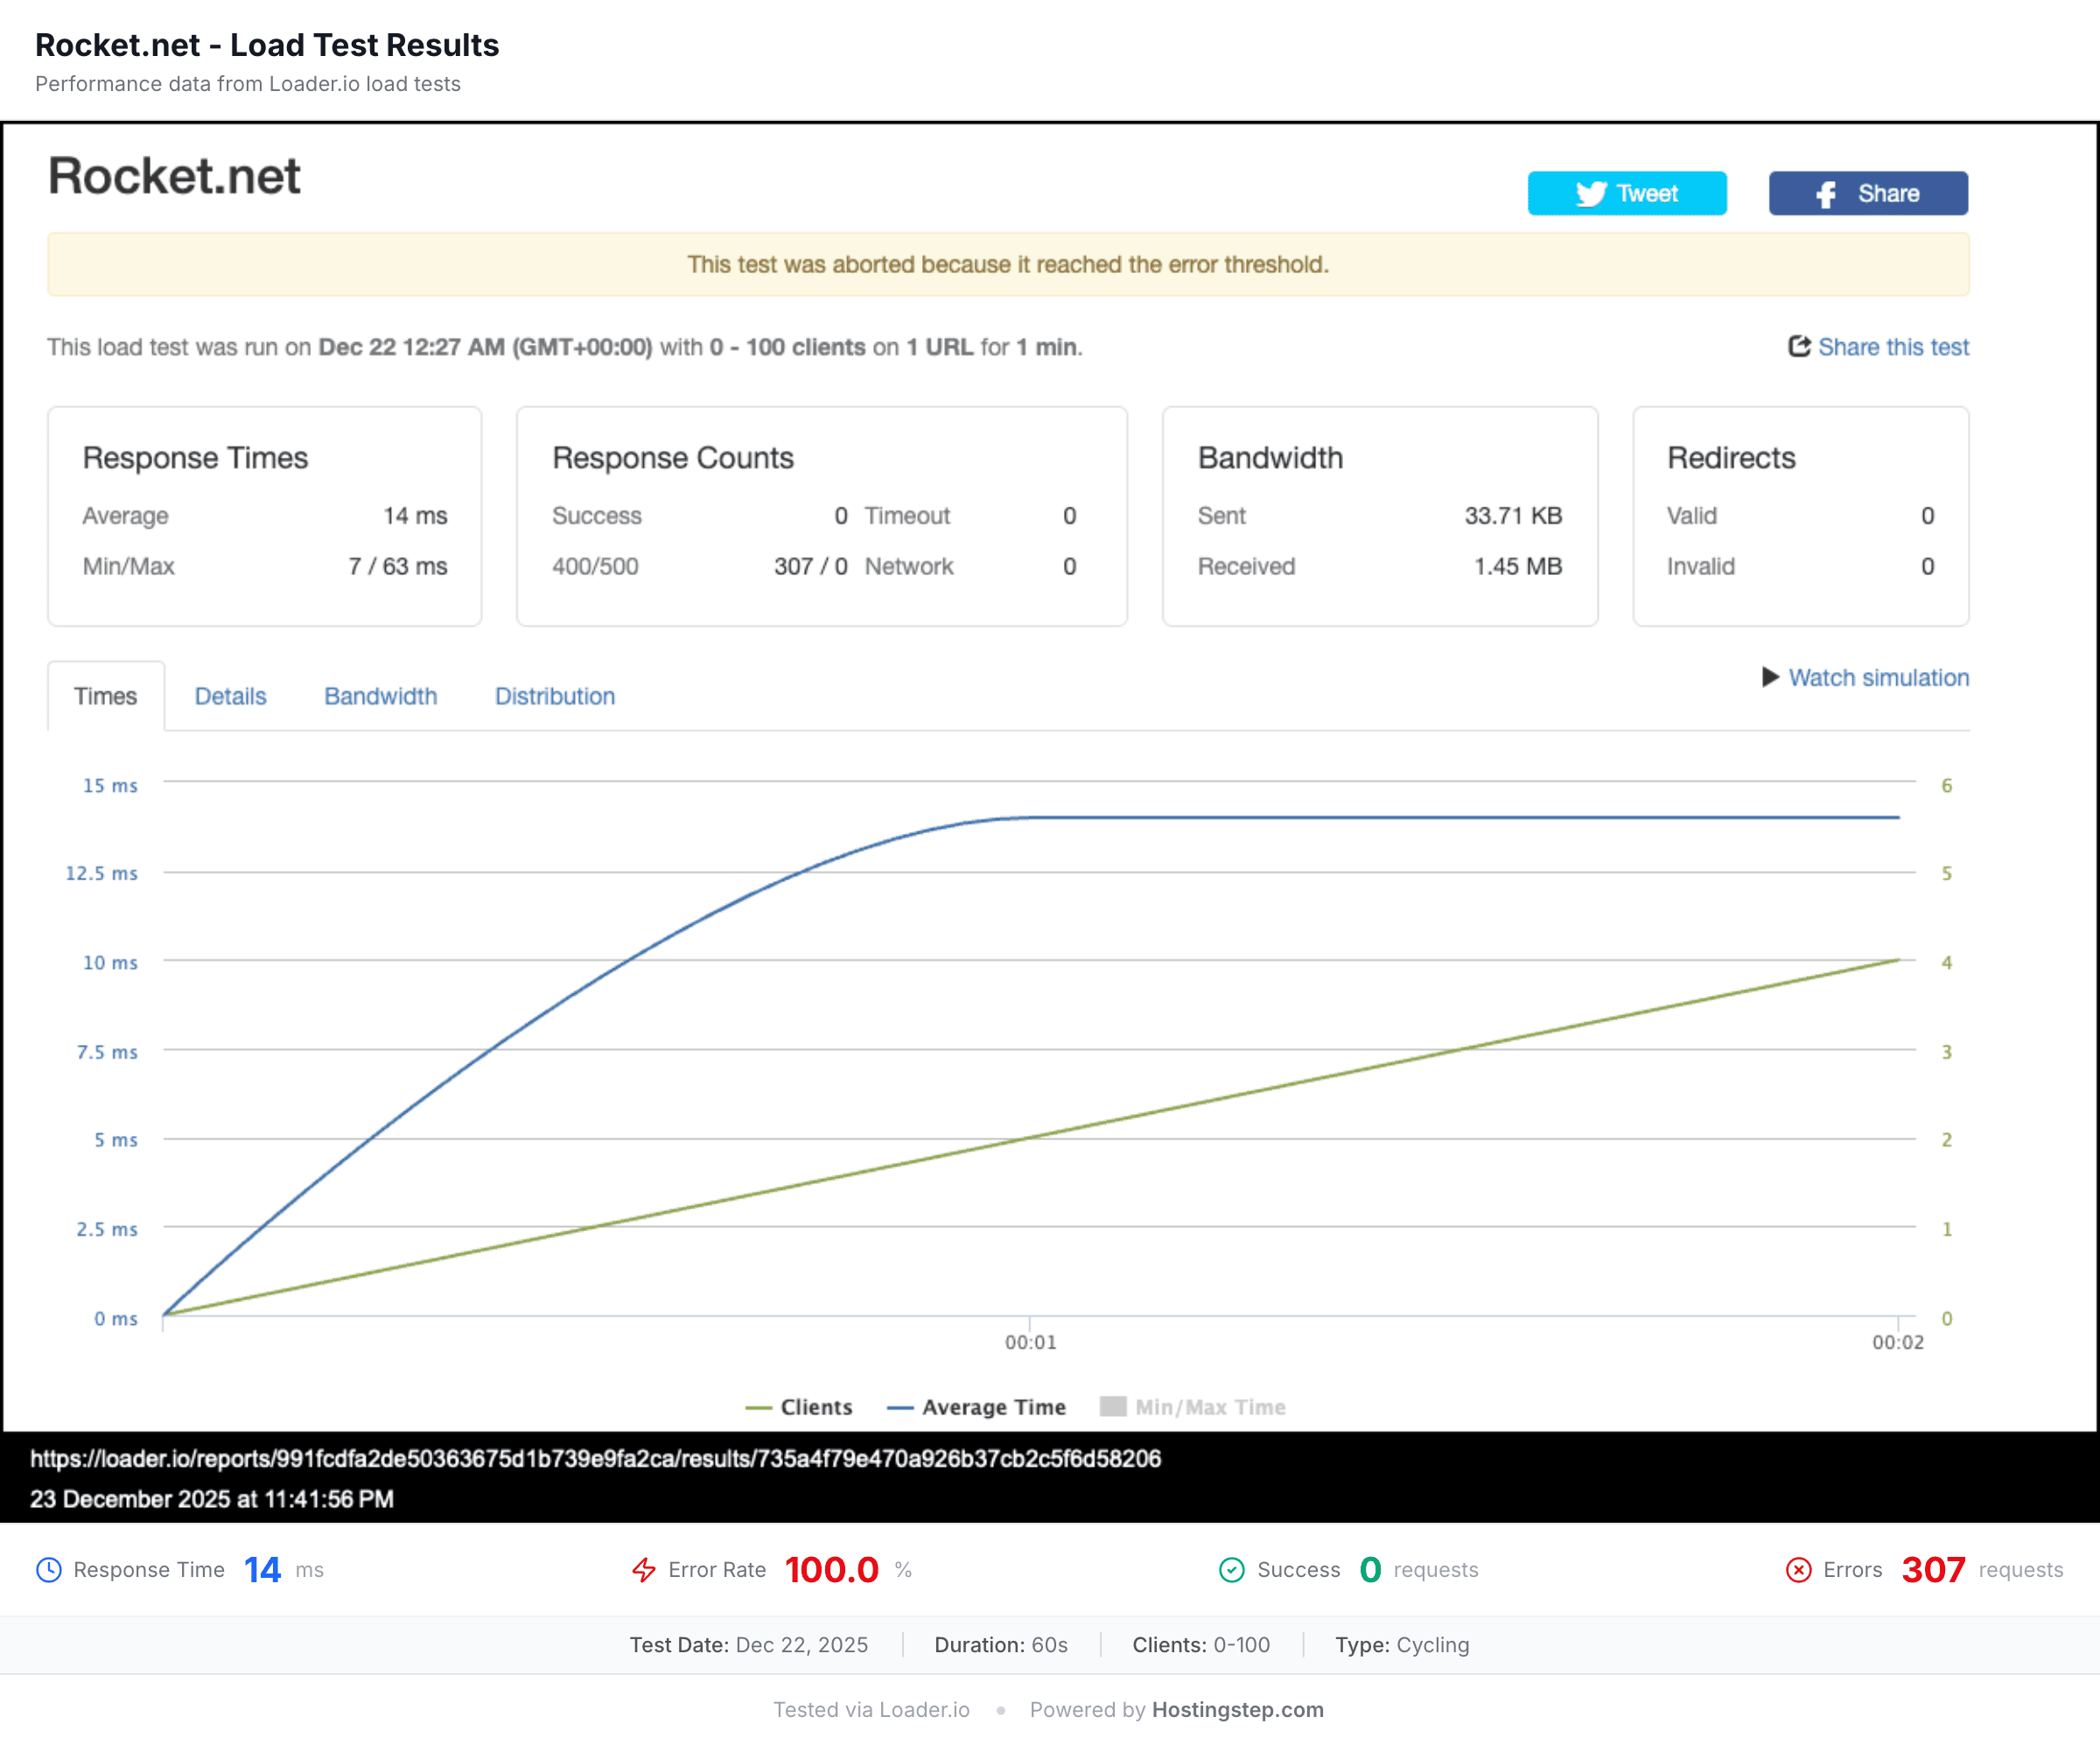
| – | Rocket.net | Not testable | Security block · no result recorded |
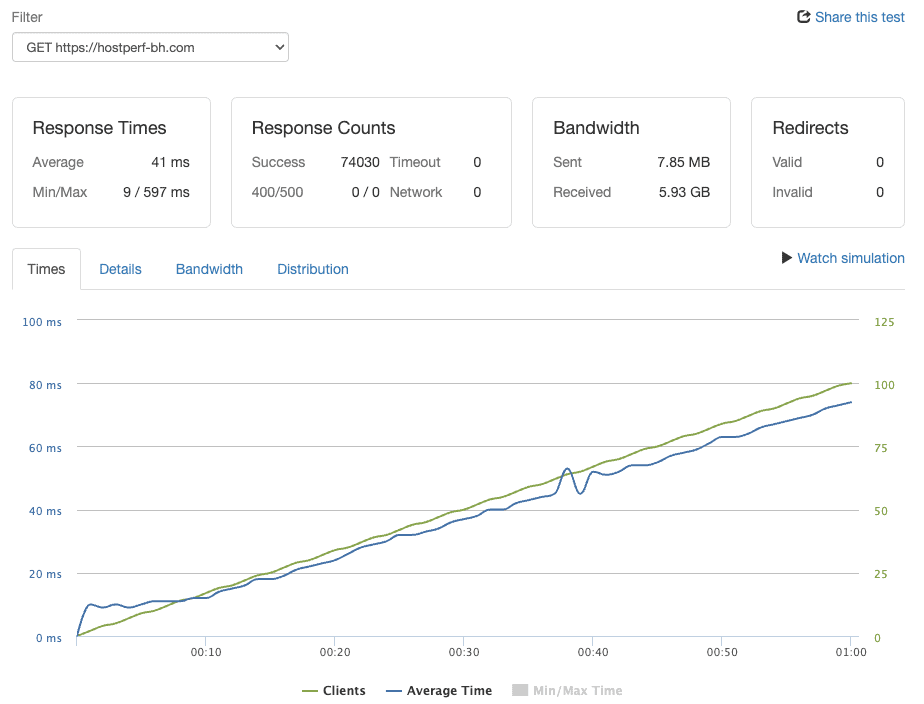
Pressable (12ms) and WordPress.com (16ms) record the fastest load-test responses of any host in our five years of testing. GreenGeeks at 26ms is the fastest shared host and is consistent year over year. Thirteen hosts finished under 50ms with zero errors, including three new entrants: InMotionHosting (31ms), HostArmada (32ms) and GoDaddy Managed WordPress (35ms).
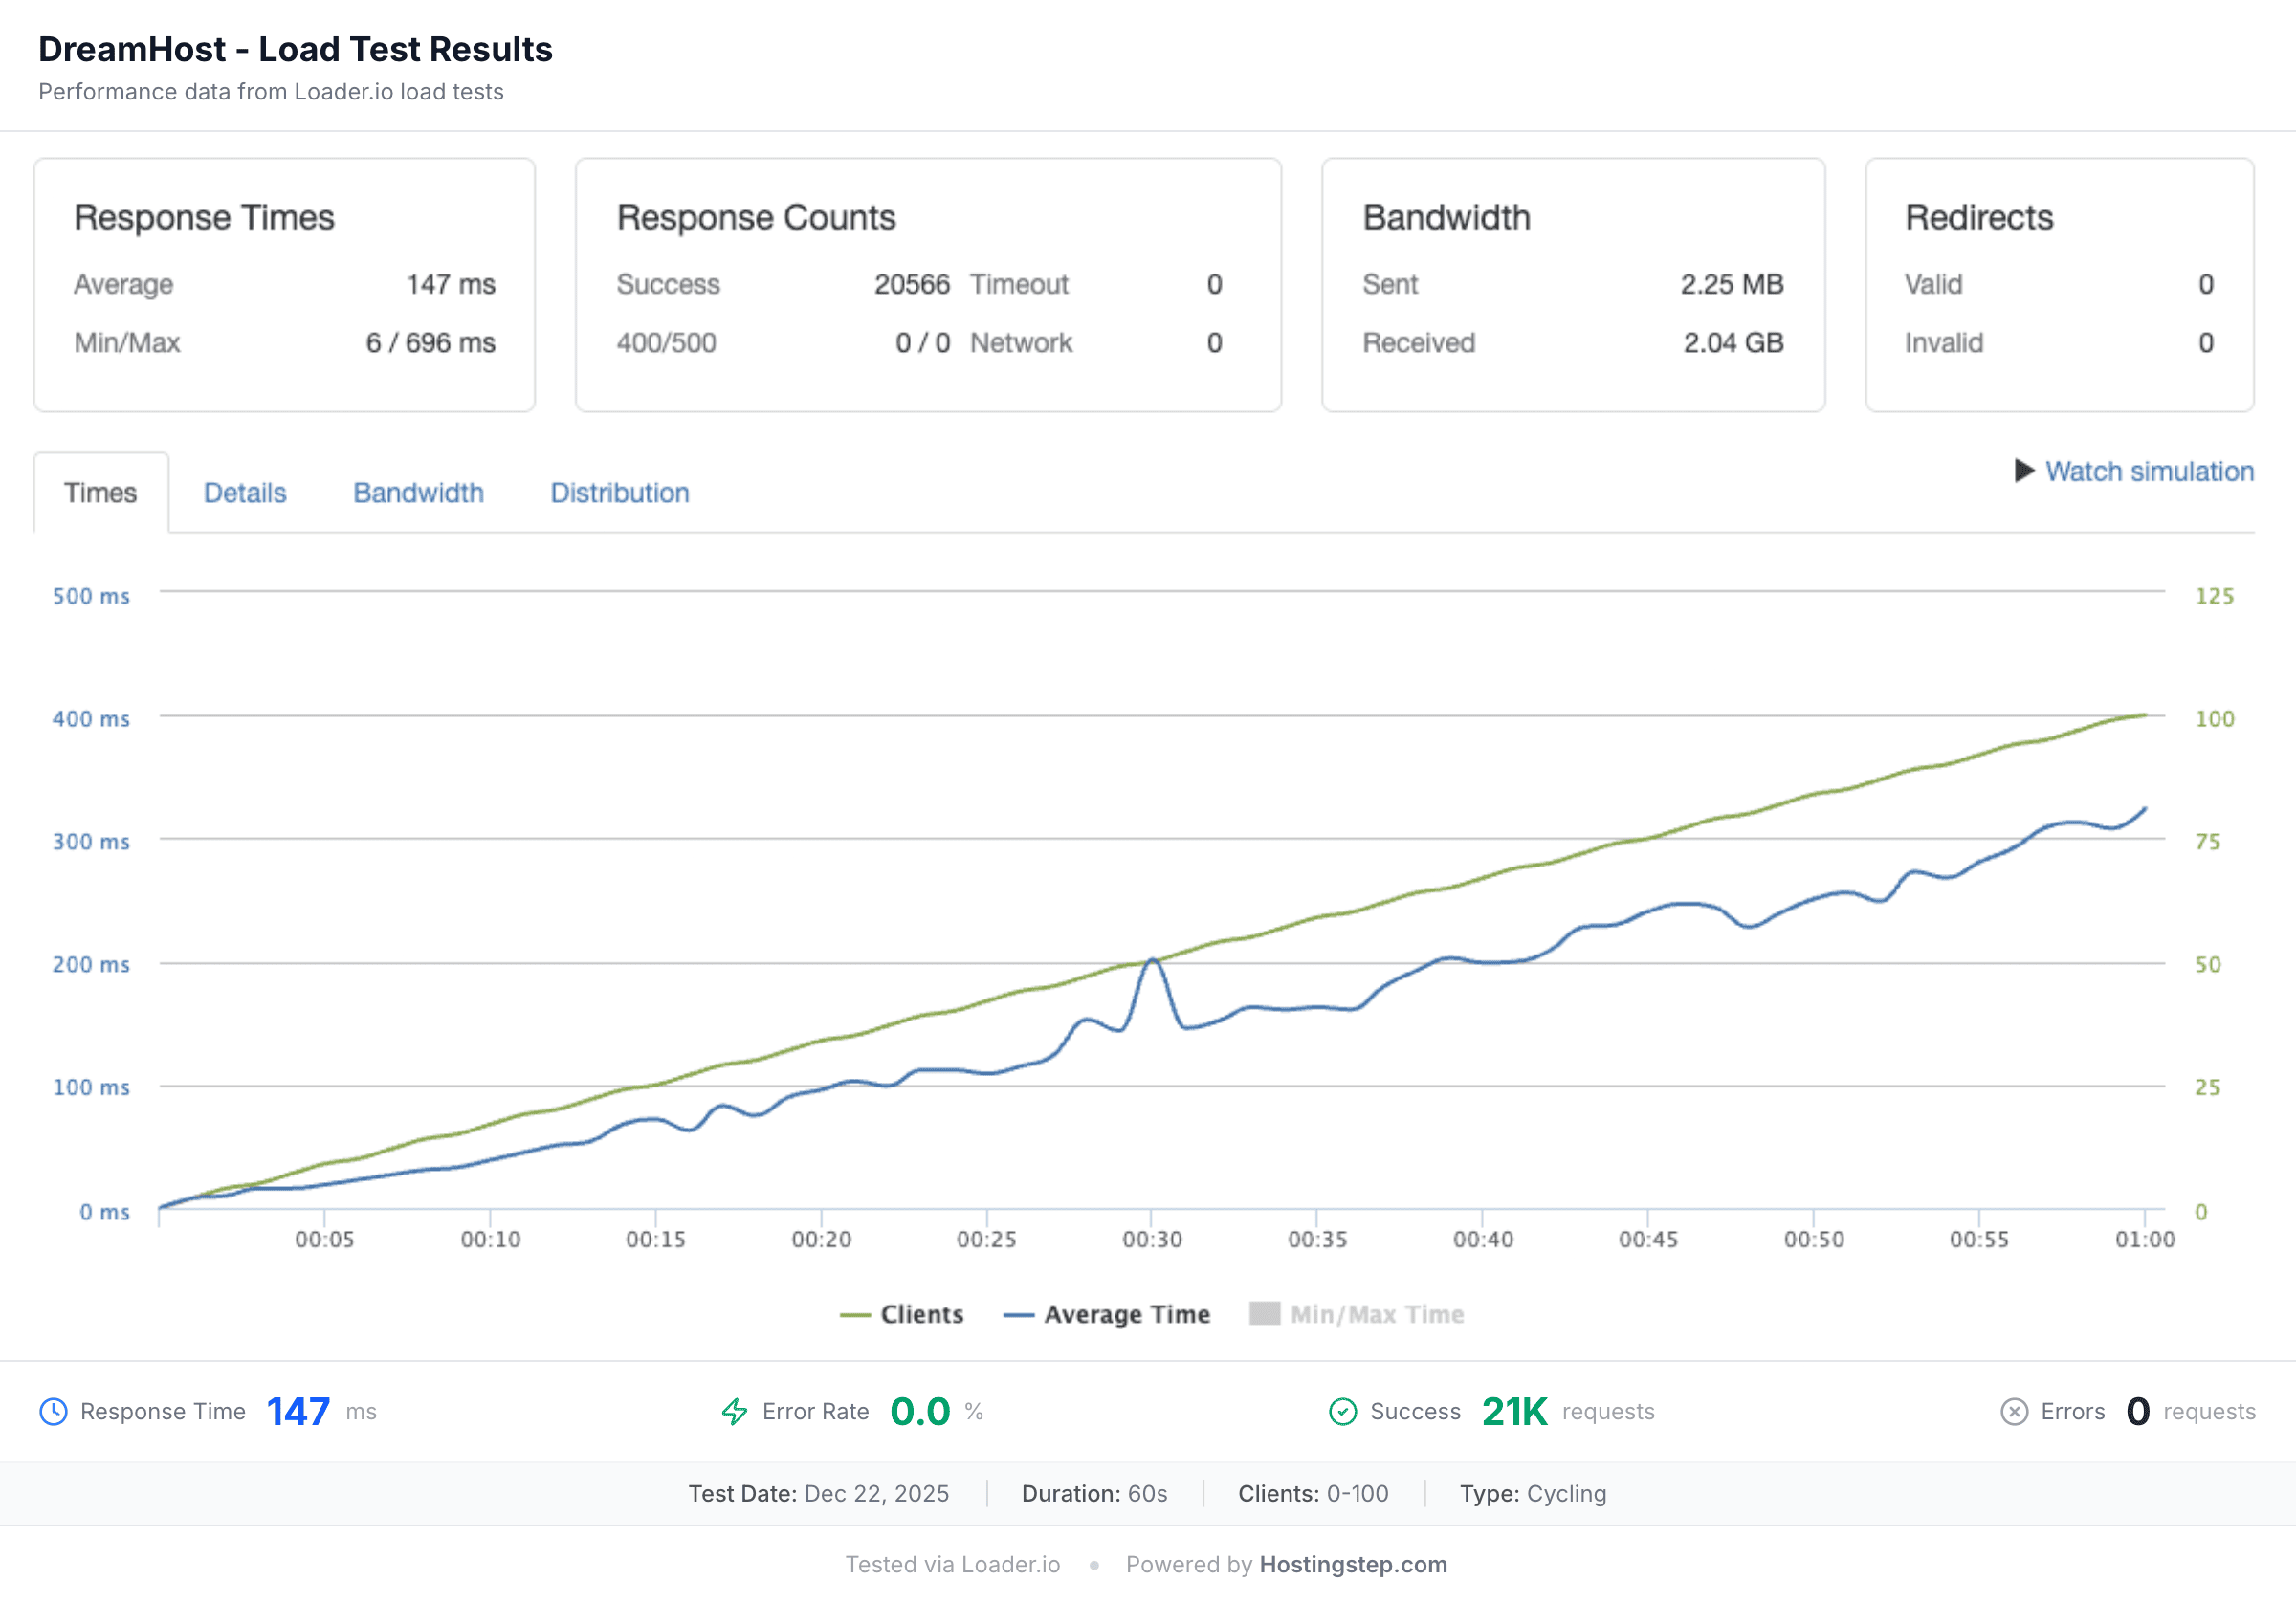
Hostinger shows the CDN effect inside one brand: the Premium plan, tested without a CDN, averaged 245ms, while Hostinger Business with Hostinger CDN averaged 31ms on the same test. Cloudways at 282ms is a decline from previous years. ChemiCloud averaged 1,068ms with a 4.2% error rate, the only completed run over one second.
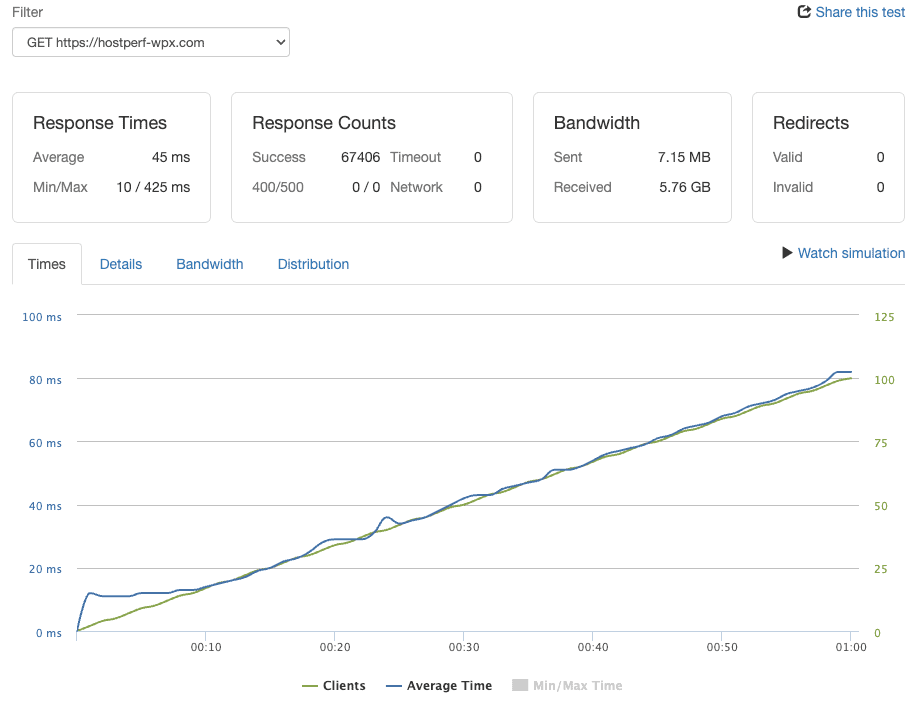
Three results carry a note. Bluehost’s December 2025 run was blocked by the security layer on its new Oracle Cloud and Cloudflare stack; a July 9, 2026 retest completed at 41ms with 0% errors and is the figure used throughout this report. WPX Hosting’s first run was blocked by WPX security; a July 8, 2026 retest completed at 45ms with 0% errors. Rocket.net’s Cloudflare Enterprise layer blocked the test client, so no result is recorded.
NameHero completed the full 60-second run at a 257ms average for served requests, but reached a connection ceiling at around 80 concurrent clients: 4,791 requests were served, while 6,076 network-level errors and 20 timeouts produced a 56% error rate, with no 4xx or 5xx responses. Ionos (65.4% errors) and GoDaddy Shared (68.8%) stopped in the first 30 seconds, so neither produced a usable average.
 Pressable
 WordPress.com
 GreenGeeks
 WP Engine
 Hostinger Business
 InMotion Hosting
 HostArmada
 GoDaddy Managed WP
 Kinsta
 Bluehost
 Hosting.com
 ScalaHosting
 WPX
WPX Templ
Templ Liquid Web
 FastComet
 InterServer
 DreamHost
 NameCheap
 EasyWP
 SiteGround
 HostGator
 DreamPress
 Hostinger
 Cloudways
 ChemiCloud
 Rocket.net
 NameHero
 Ionos
Ionos GoDaddy
Benchmark Test 4: Server Hardware (WPBench)
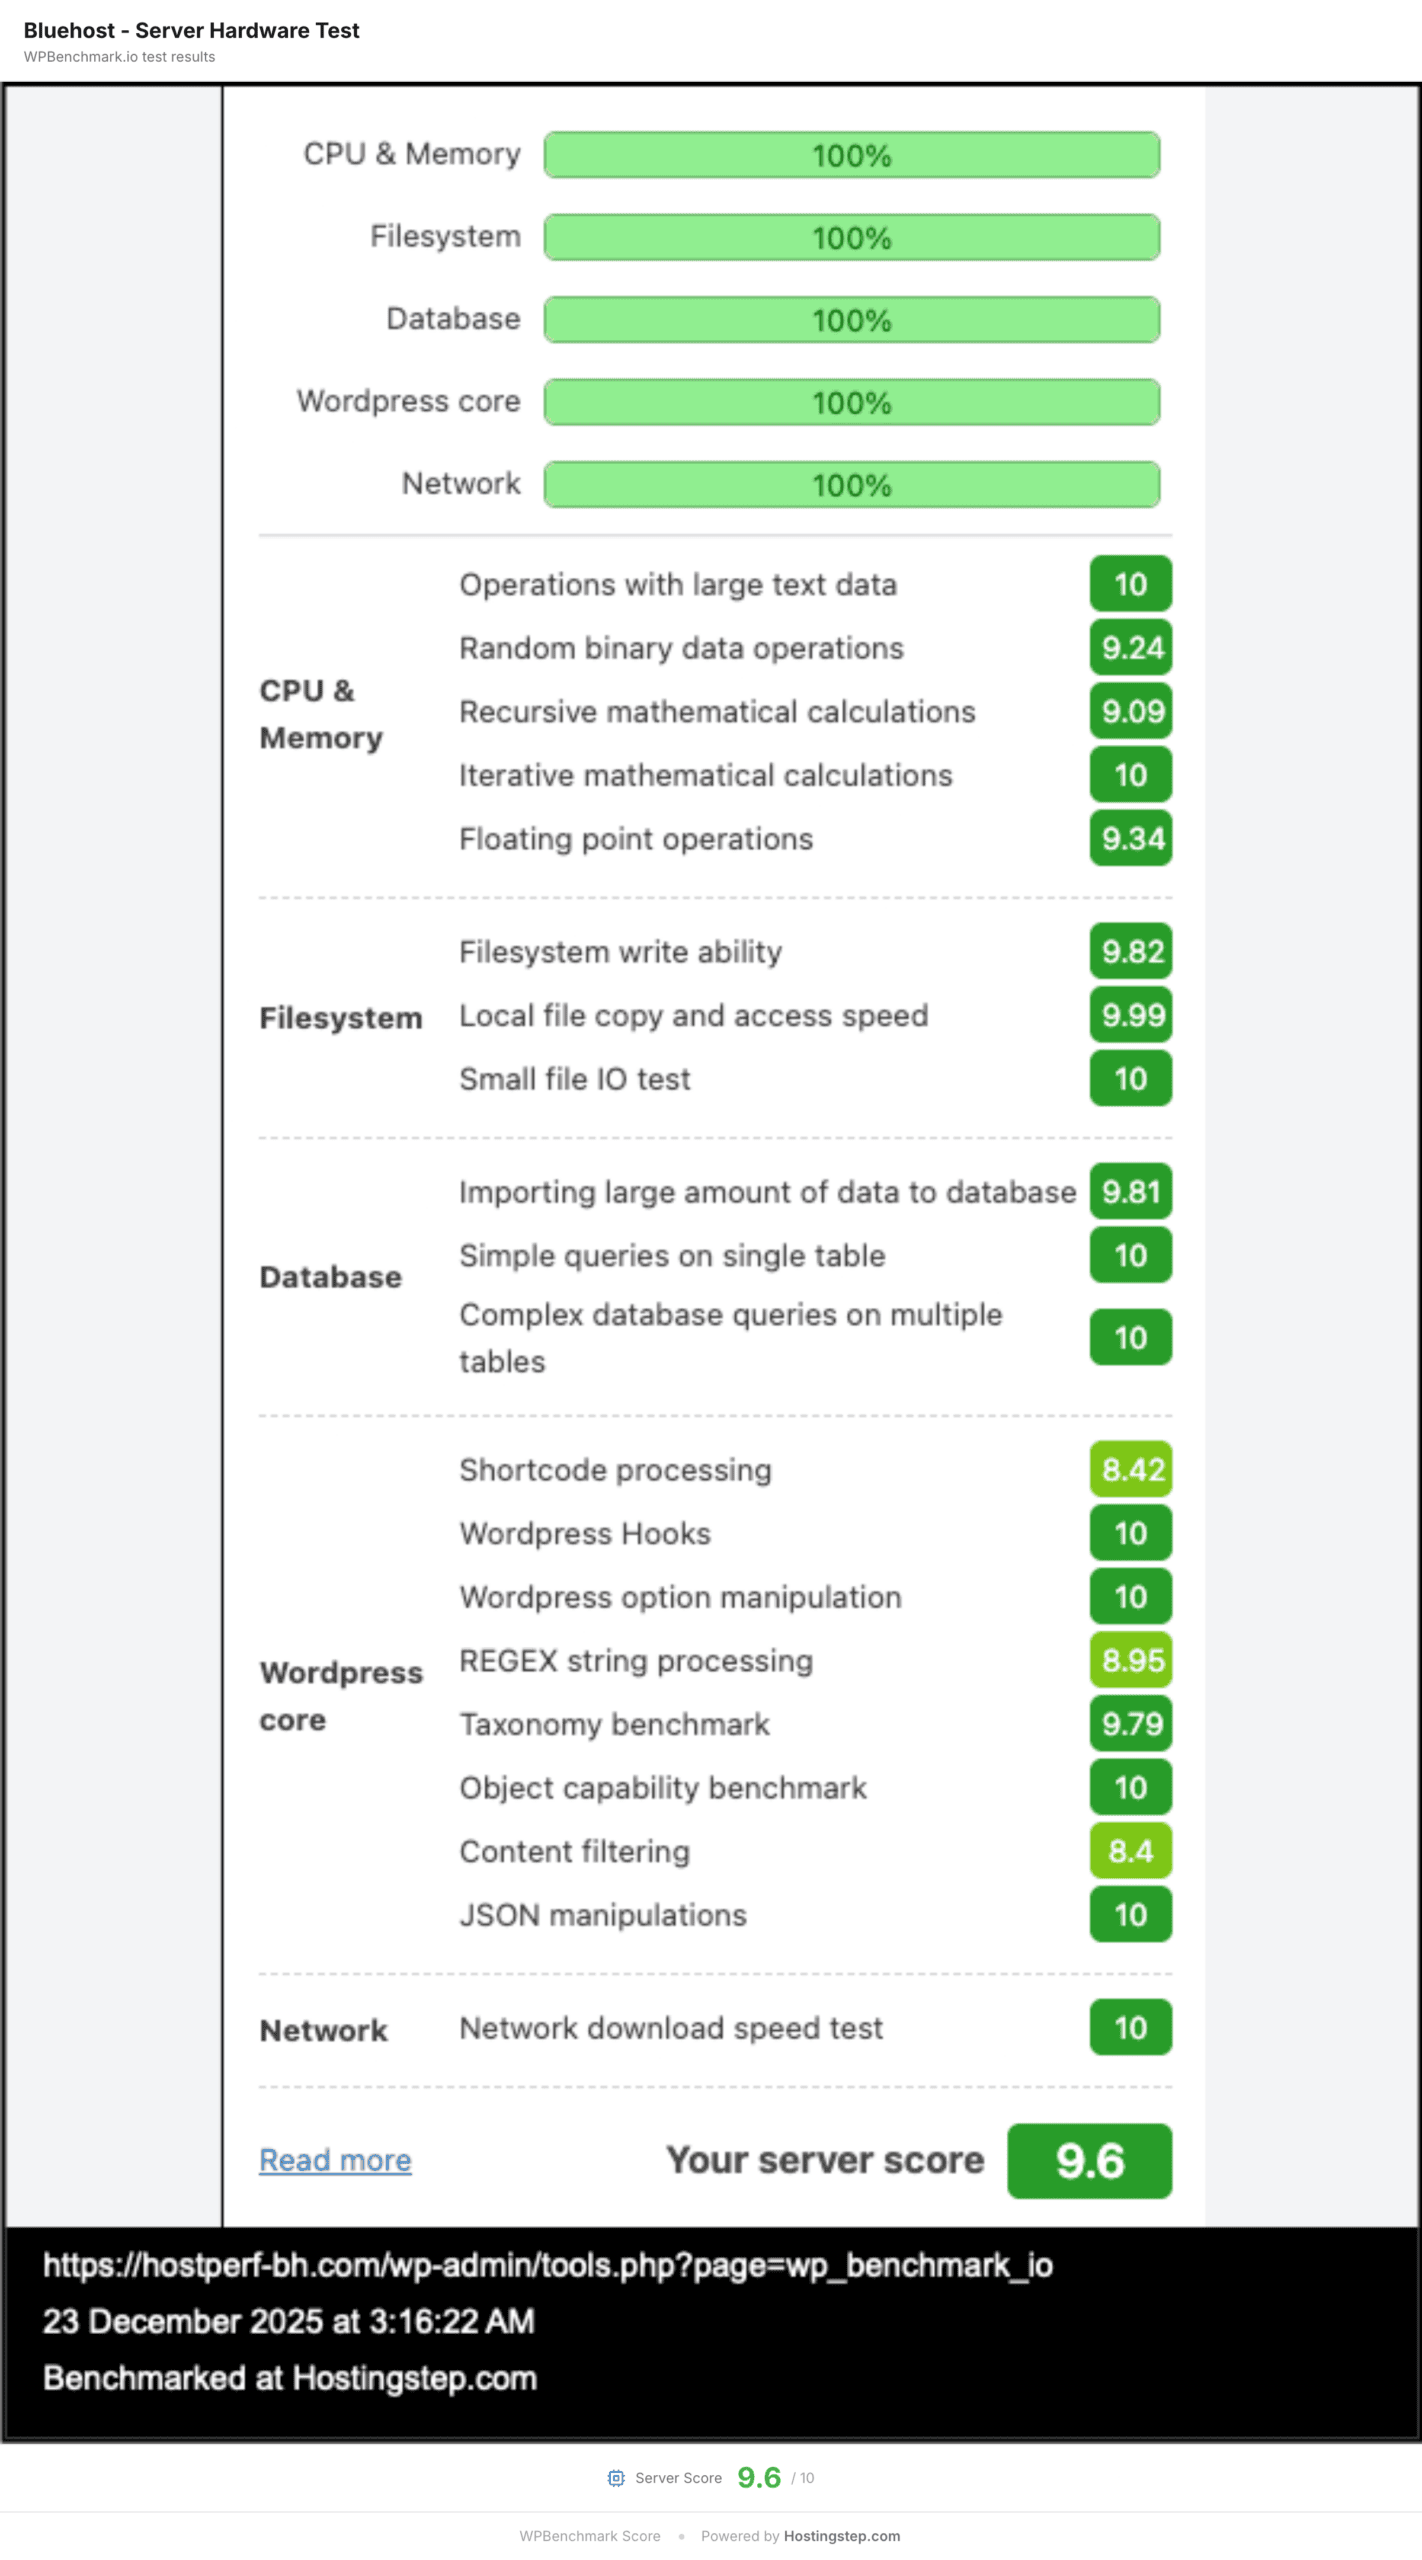
The Hosting Benchmark Tool runs CPU, memory, filesystem and database tests on the server and produces a composite score from 0 to 10. It measures how much computing power a provider allocates to the plan we bought. A low score means the provider caps resources on the entry plan; it says nothing about the quality of their technology or the web server they run, and higher plans from the same provider may score differently.
BluehostHostGatorScalaHostingKinstaSiteGroundTemplRocket.netHostinger BusinessInMotionHostingHostingerLiquid WebIonosWordPress.comPressableEasyWPWP EngineWPX HostingDreamHost (Shared)DreamPressChemiCloudHosting.comInterserverHostArmadaGreenGeeksNameCheapFastCometCloudwaysGoDaddy Managed WPGoDaddy (Shared)NameHero| # | Hosting | WPBench score |
|---|---|---|
| 1 | Bluehost | 9.6/10 |
| 2 | HostGator | 9.6/10 |
| 3 | ScalaHosting | 8.8/10 |
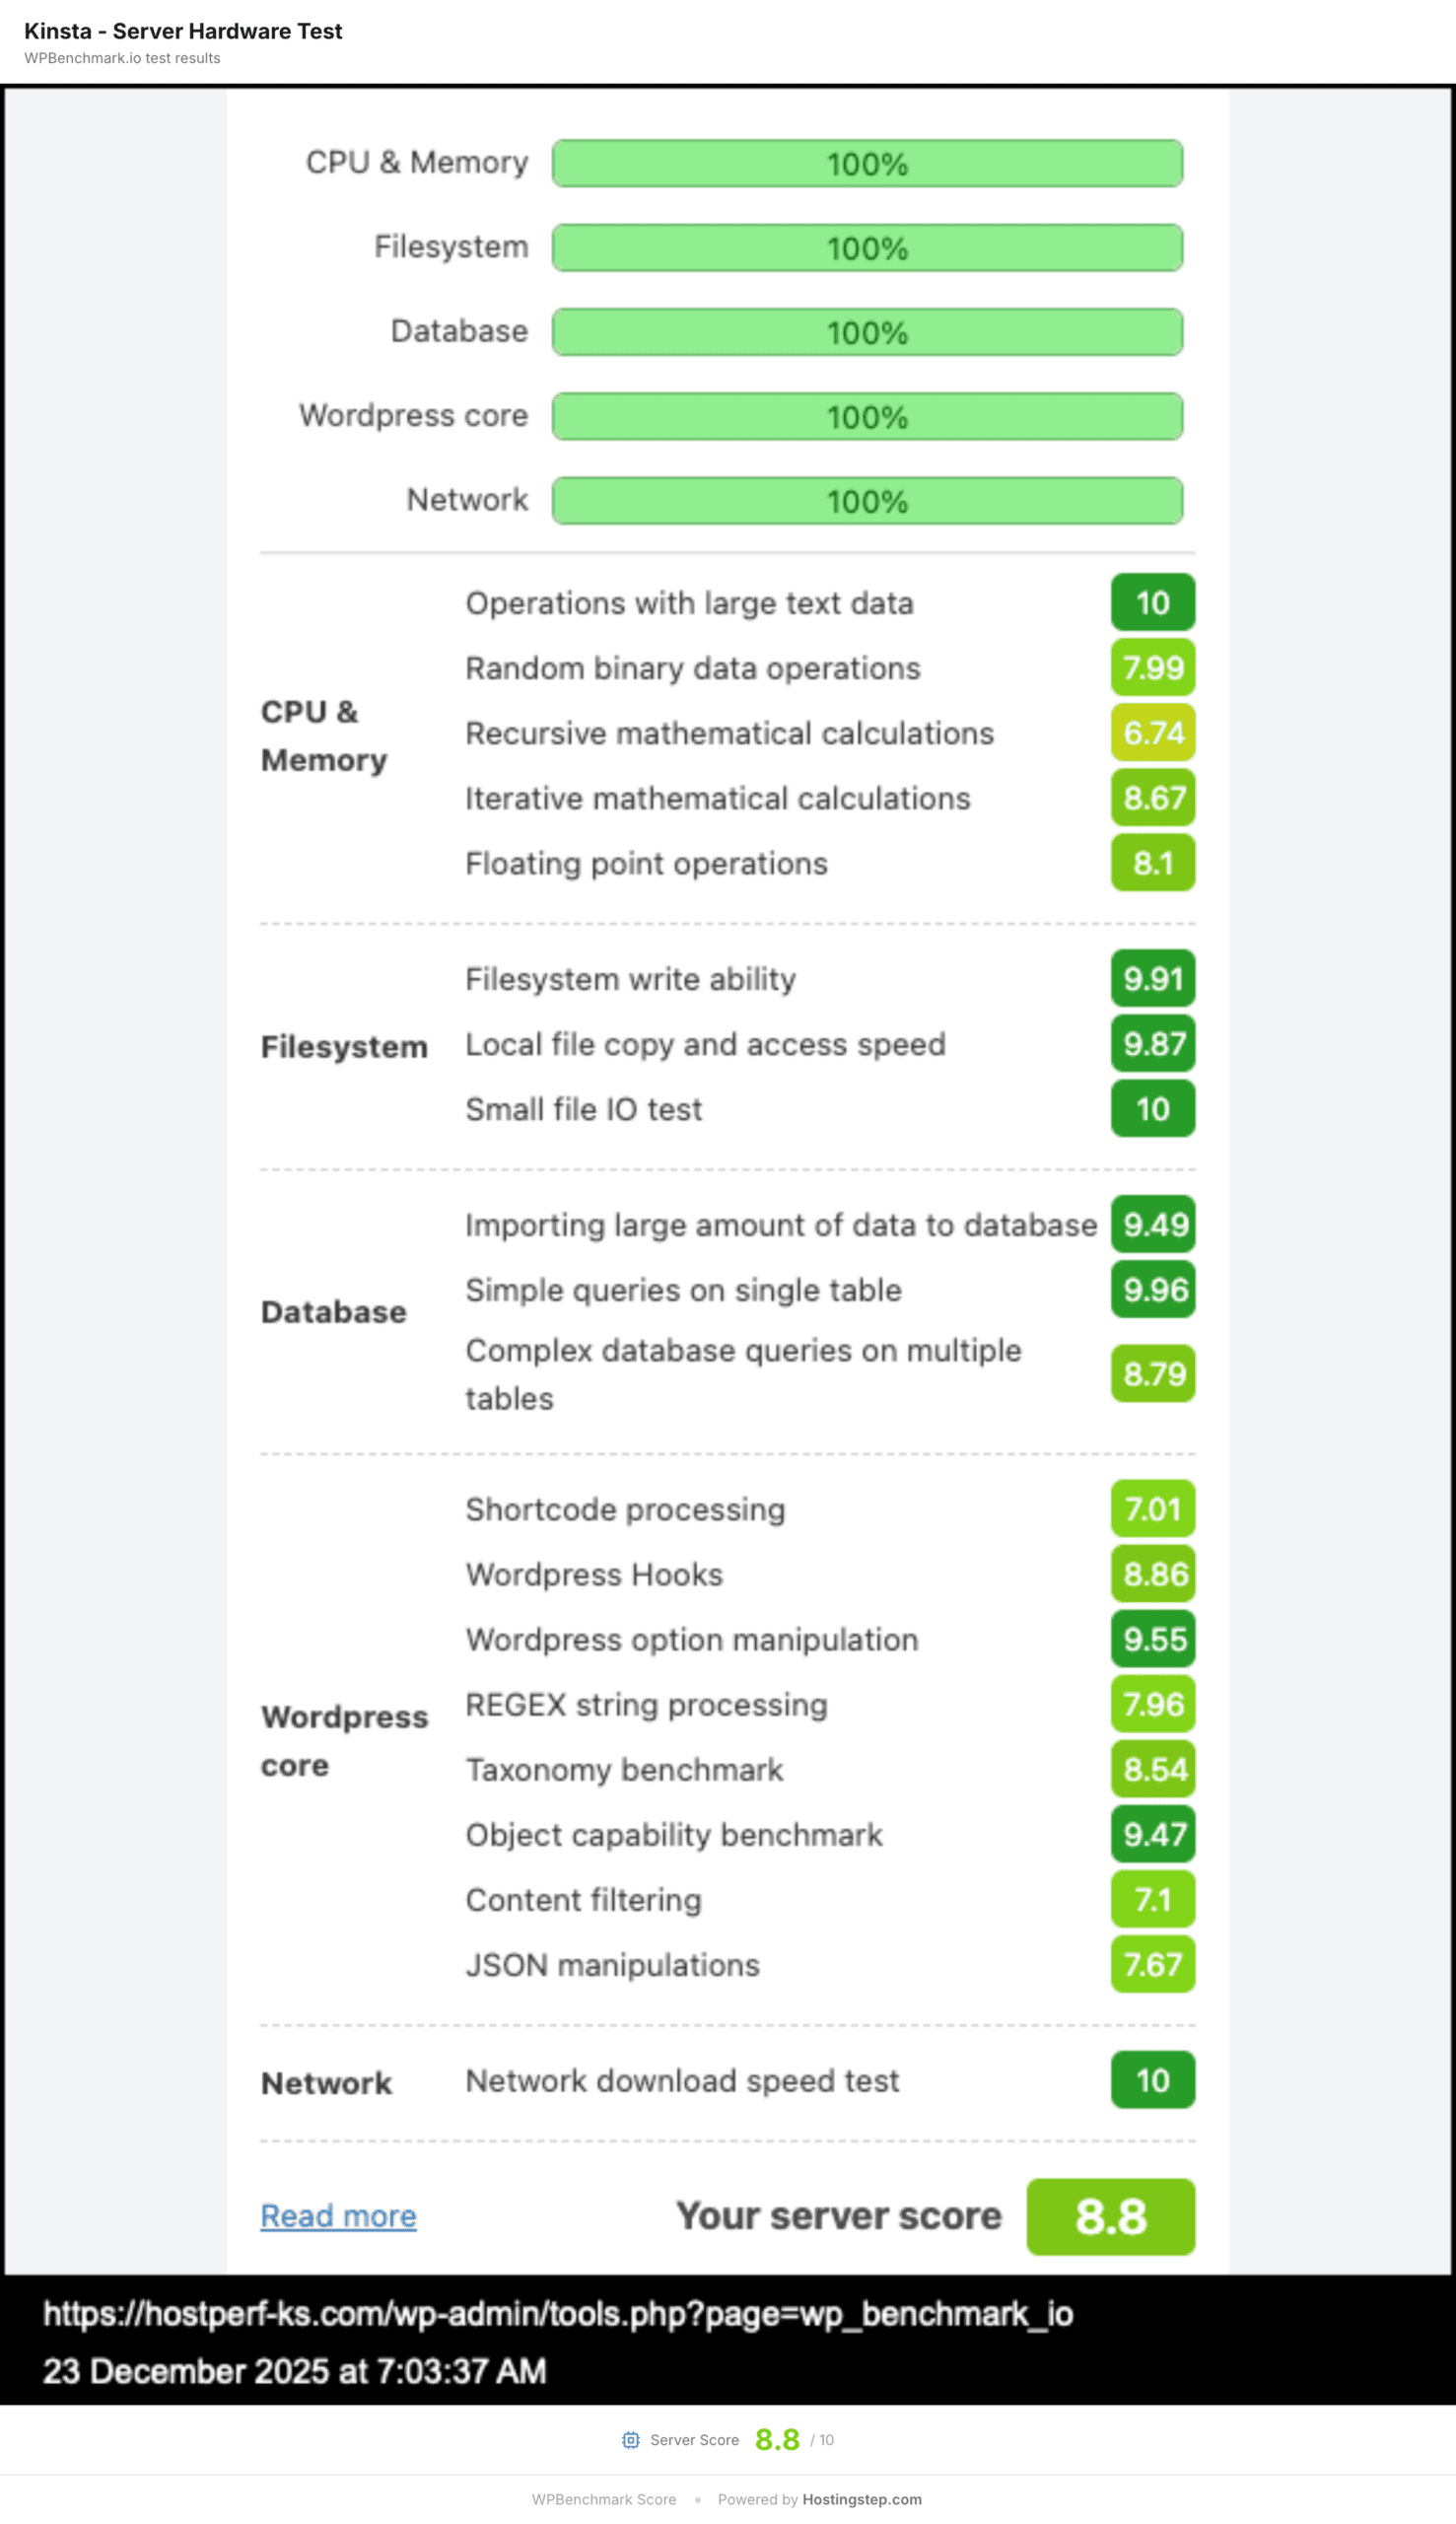
| 4 | Kinsta | 8.8/10 |
| 5 | SiteGround | 8.4/10 |
| 6 | Templ | 7.5/10 |
| 7 | Rocket.net | 7.5/10 |
| 8 | Hostinger Business | 7.4/10 |
| 9 | InMotionHosting | 7.4/10 |
| 10 | Hostinger | 7.4/10 |
| 11 | Liquid Web | 7.2/10 |
| 12 | Ionos | 7.2/10 |
| 13 | WordPress.com | 6.8/10 |
| 14 | Pressable | 6.7/10 |
| 15 | EasyWP | 6.7/10 |
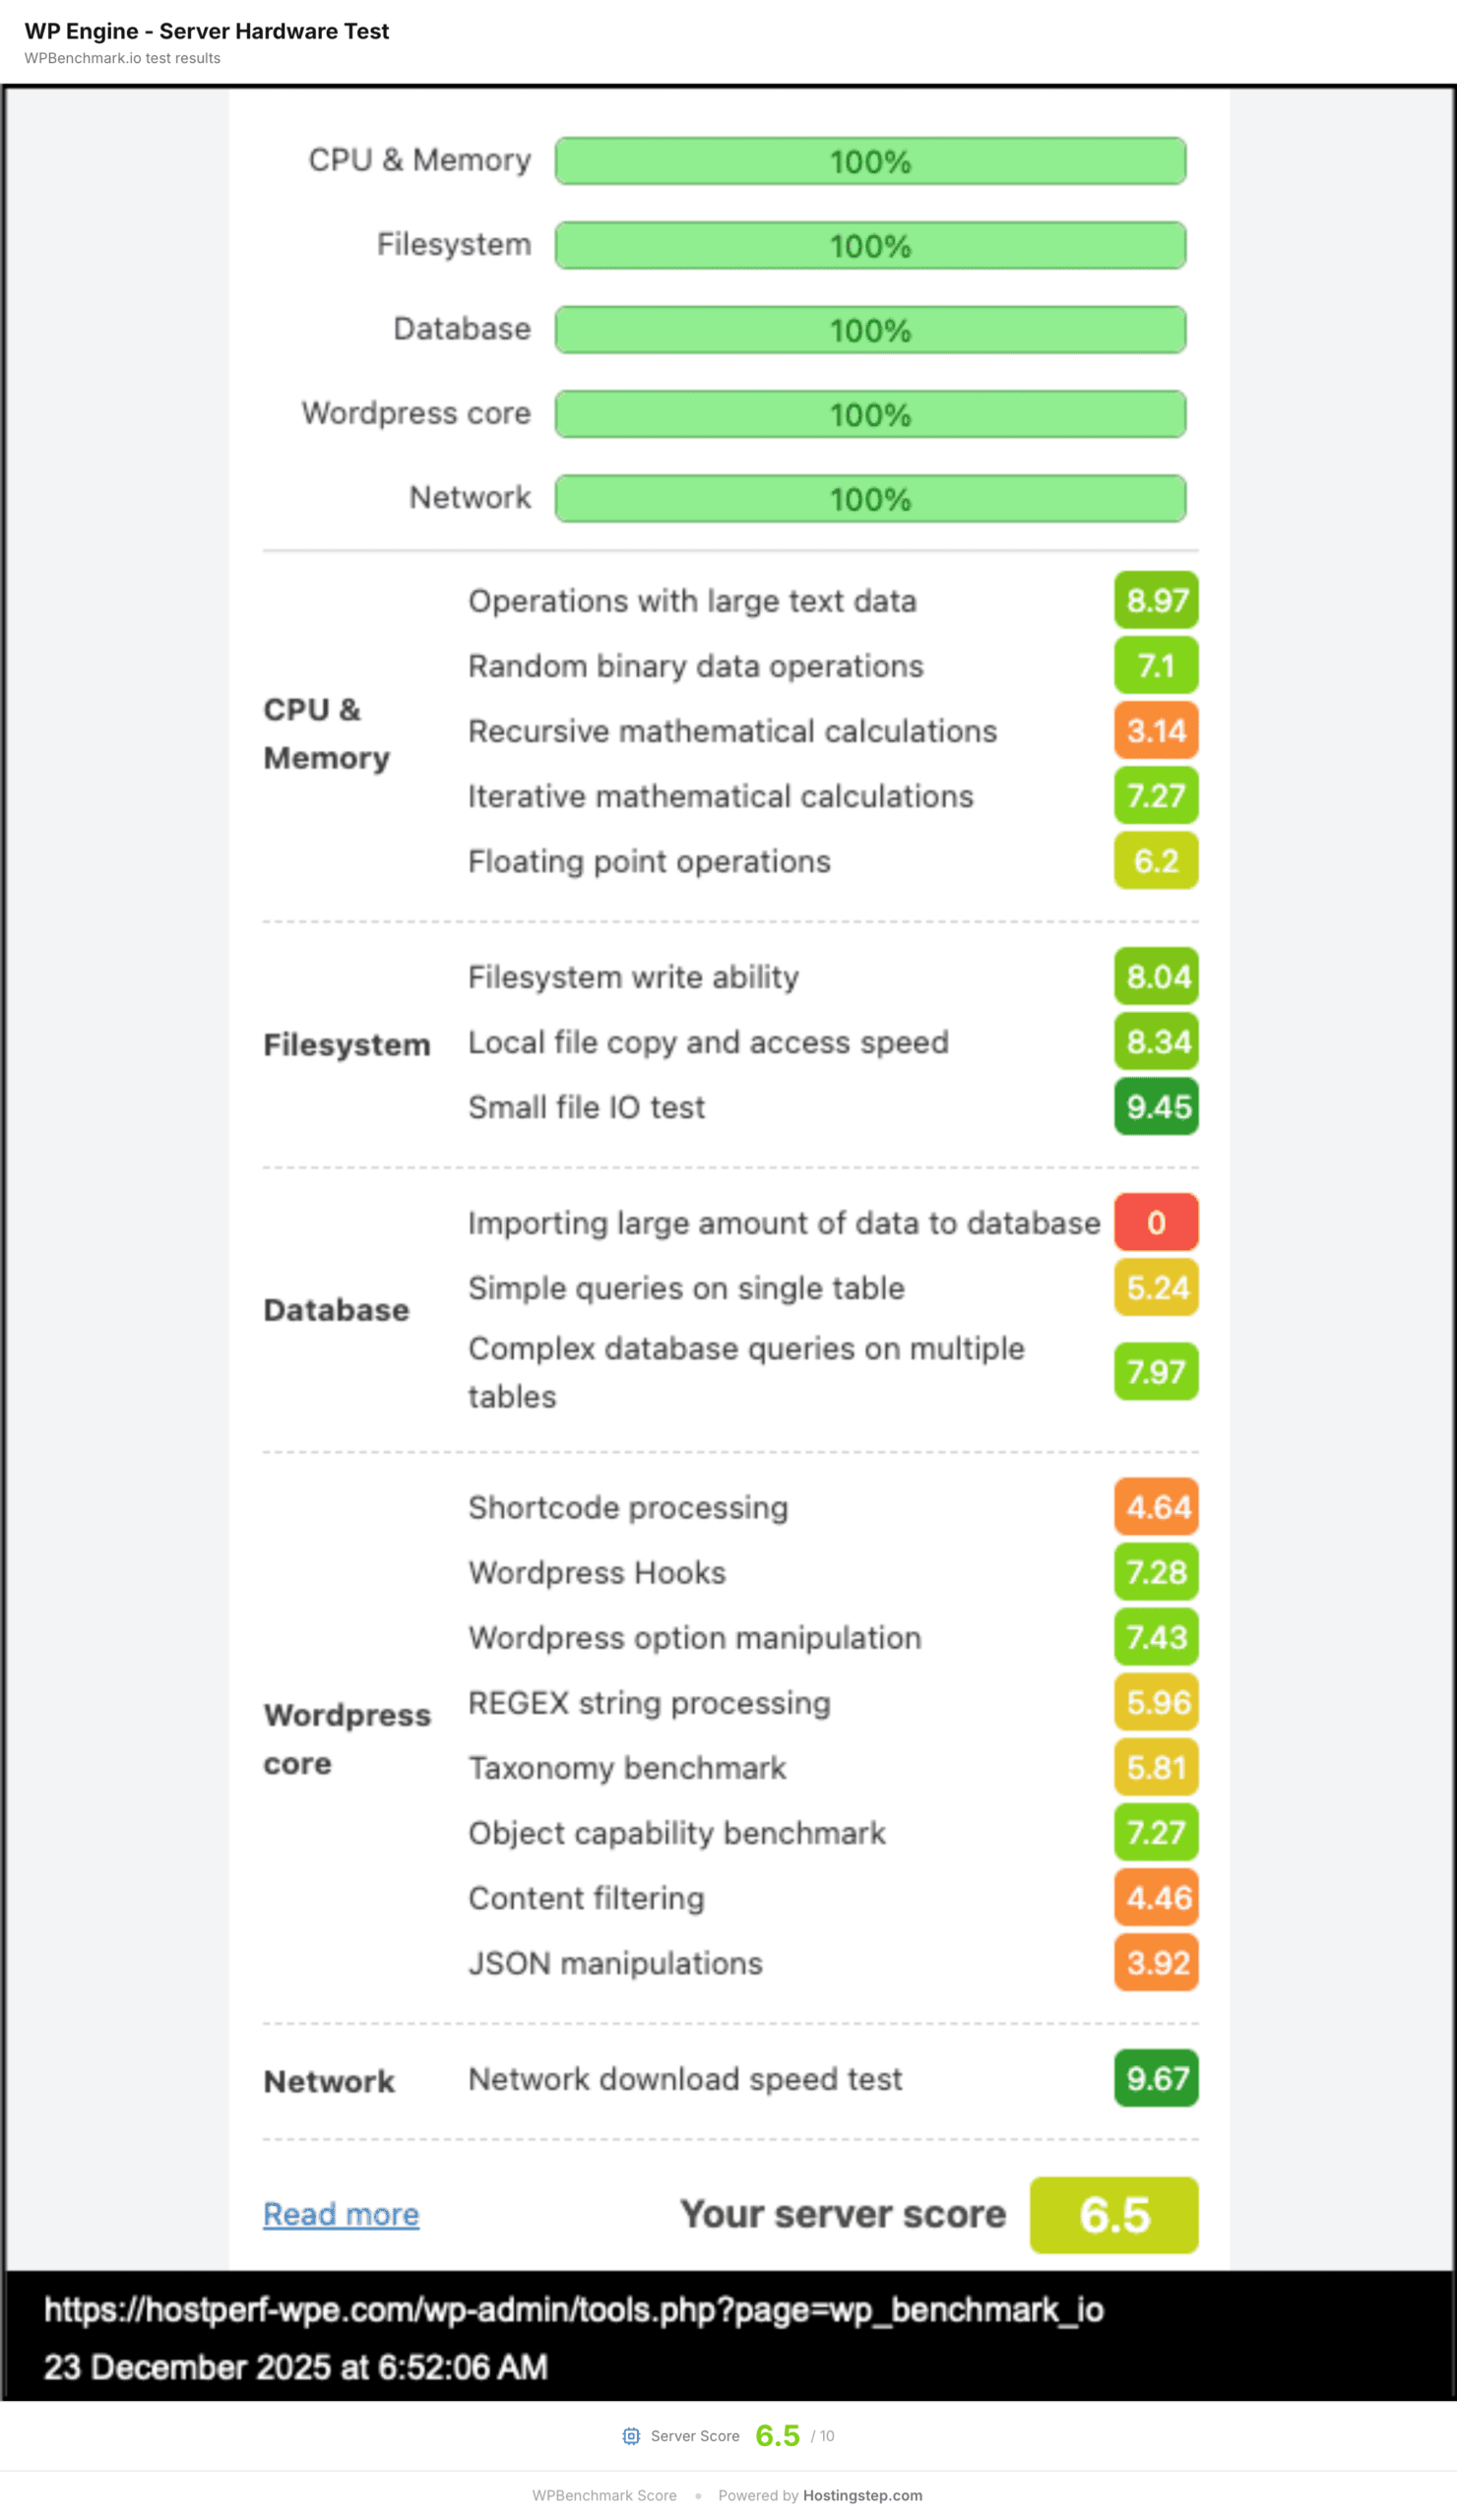
| 16 | WP Engine | 6.5/10 |
| 17 | WPX Hosting | 6.5/10 |
| 18 | DreamHost (Shared) | 6.1/10 |
| 19 | DreamPress | 6.1/10 |
| 20 | ChemiCloud | 6.1/10 |
| 21 | Hosting.com | 5.5/10 |
| 22 | Interserver | 5.3/10 |
| 23 | HostArmada | 5.1/10 |
| 24 | GreenGeeks | 5.0/10 |
| 25 | NameCheap | 5.0/10 |
| 26 | FastComet | 4.8/10 |
| 27 | Cloudways | 4.7/10 |
| 28 | GoDaddy Managed WP | 3.8/10 |
| 29 | GoDaddy (Shared) | 3.8/10 |
| 30 | NameHero | 3.7/10 |
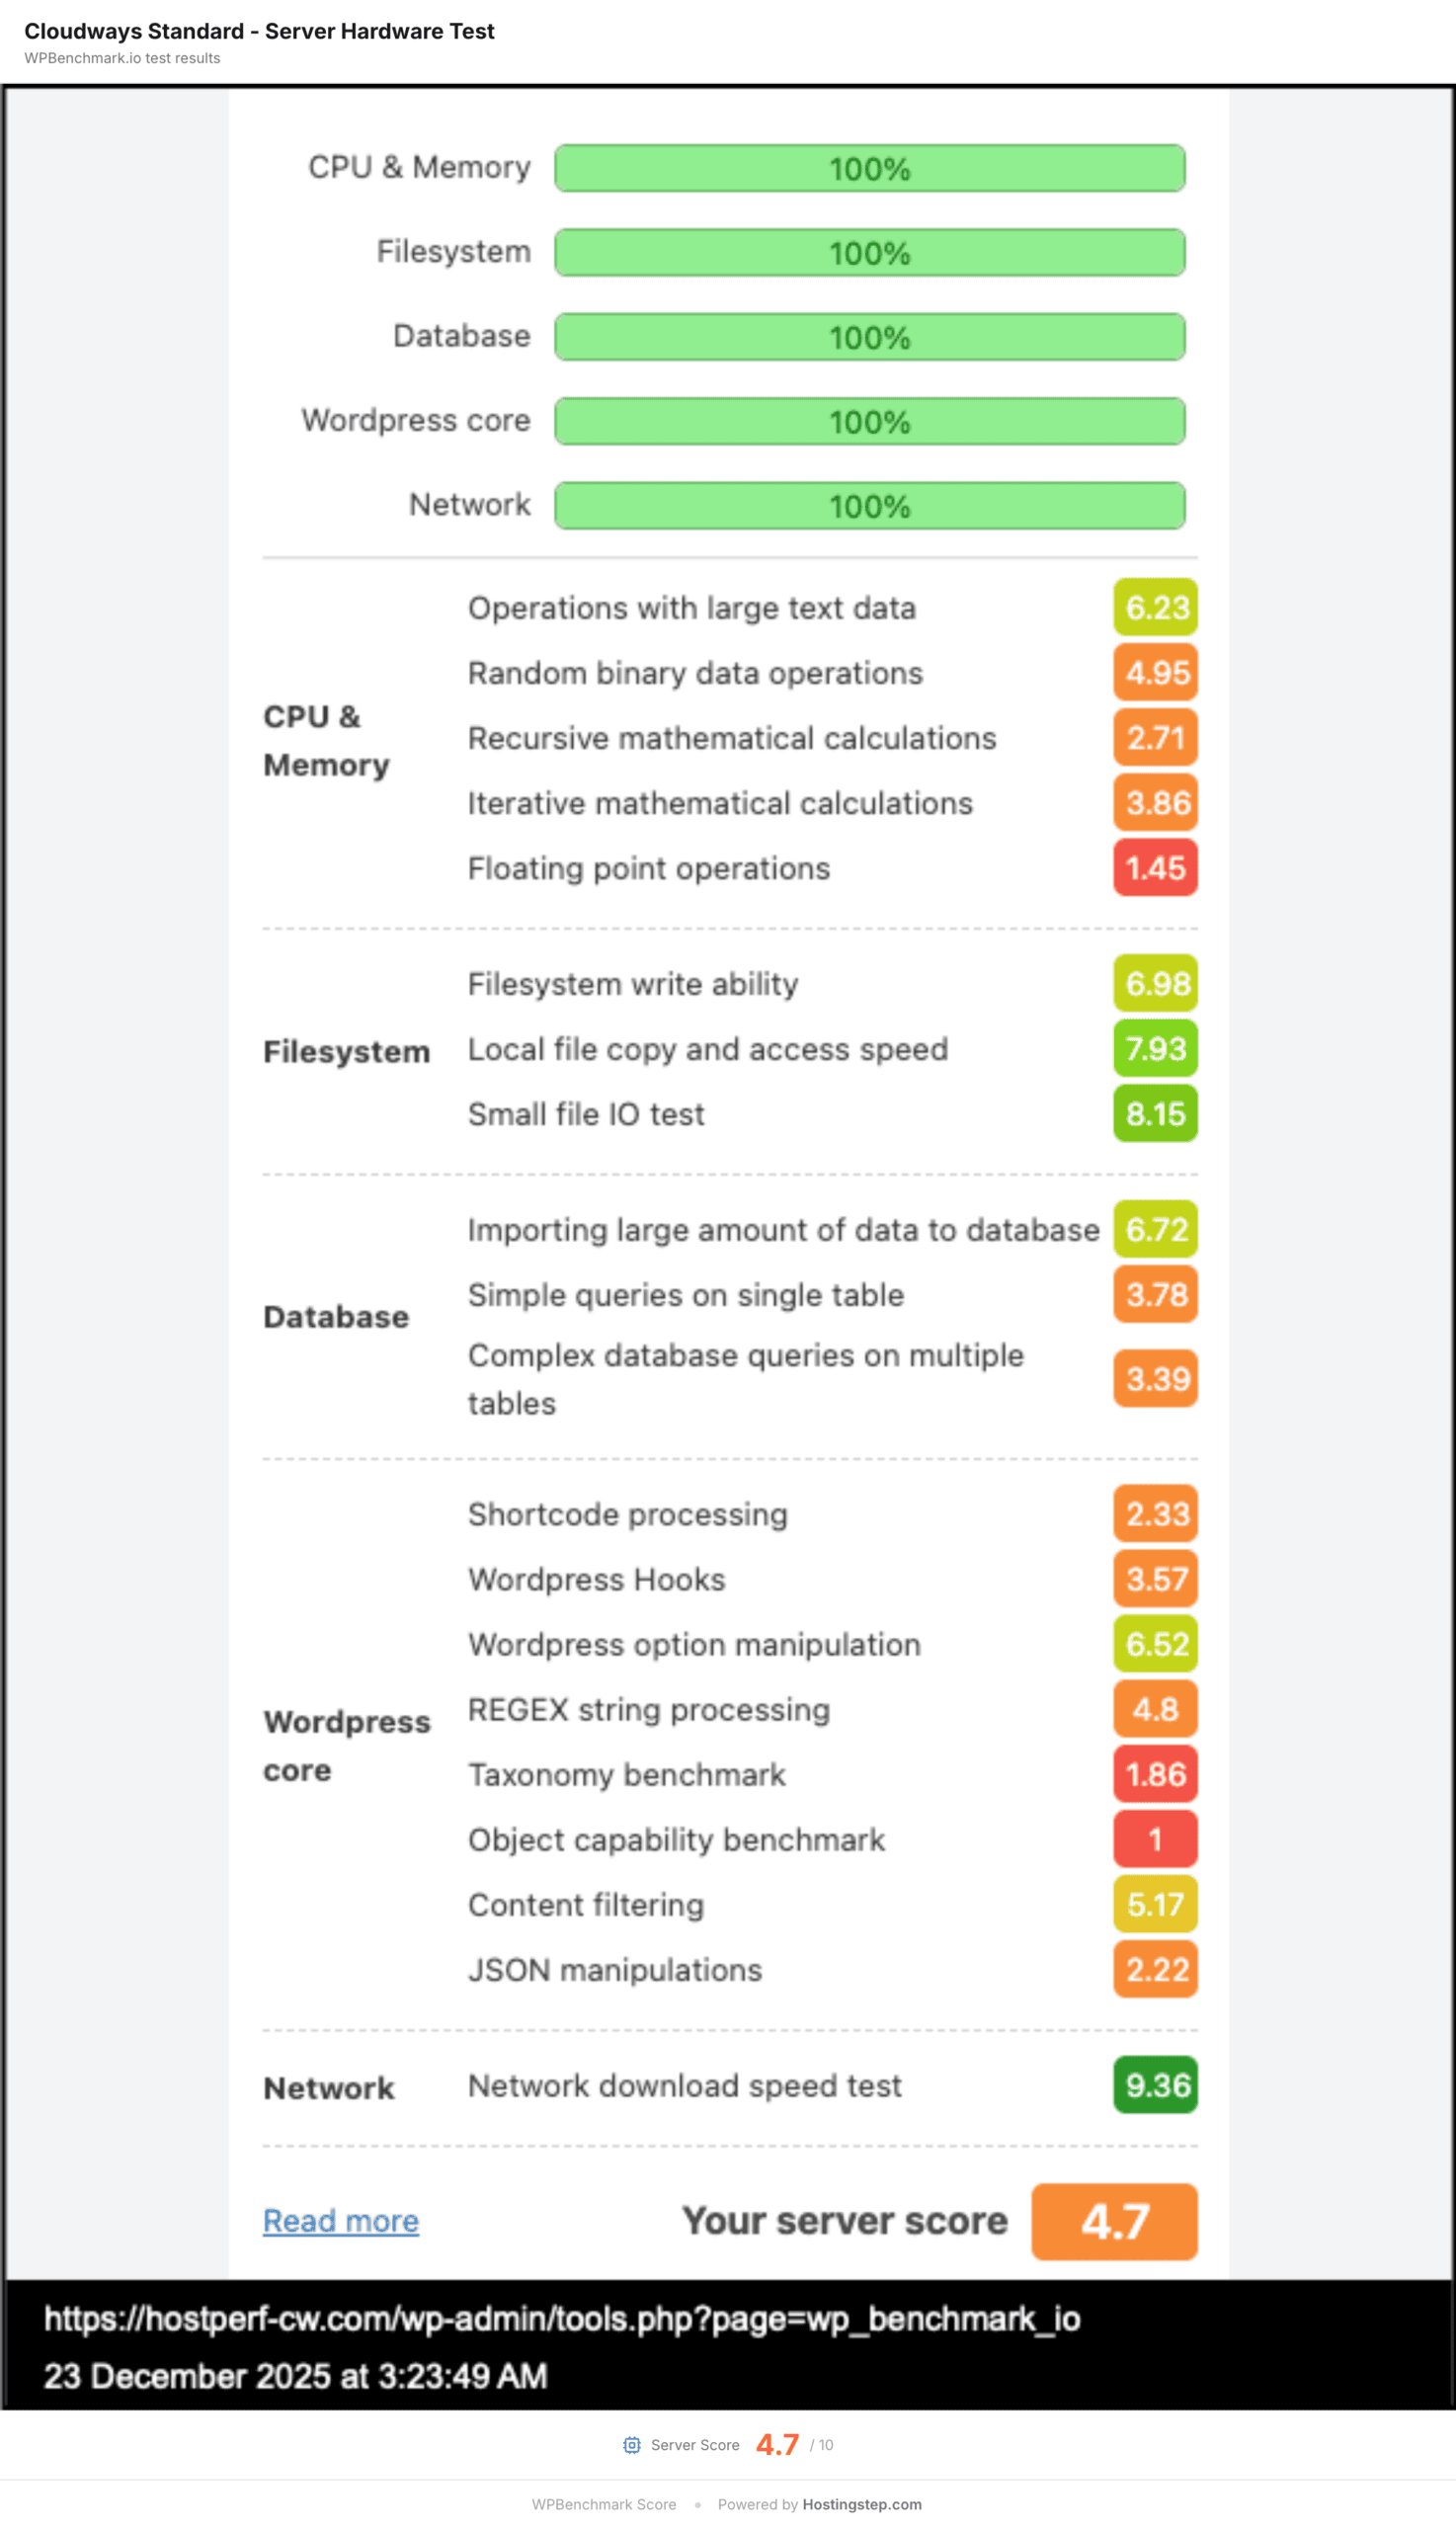
Bluehost and HostGator jumped to 9.6 from 4.0 and 4.3 respectively, the largest year-over-year change in the pool, and it tracks their Oracle Cloud migration. Kinsta at 8.8 is consistent year over year and remains the only managed WordPress host allocating this much computing power for its price. ScalaHosting debuts at 8.8.
Rocket.net dropped below 8 for the first time, at 7.5. Hostinger Premium and Hostinger Business score the same 7.4, so the cheaper plan is not getting fewer resources. WordPress.com (6.8), Pressable (6.7), WP Engine (6.5) and WPX Hosting (6.5) all sit mid-pack; these hosts get their speed from caching architecture rather than raw allocation.
GoDaddy Managed WordPress scores 3.8 despite fast results in every other test, which points to a limited allocation masked by its edge-caching CDN. NameHero at 3.7 is the lowest in the pool.
 Bluehost
 HostGator
 ScalaHosting
 Kinsta
 SiteGround
 Templ
Templ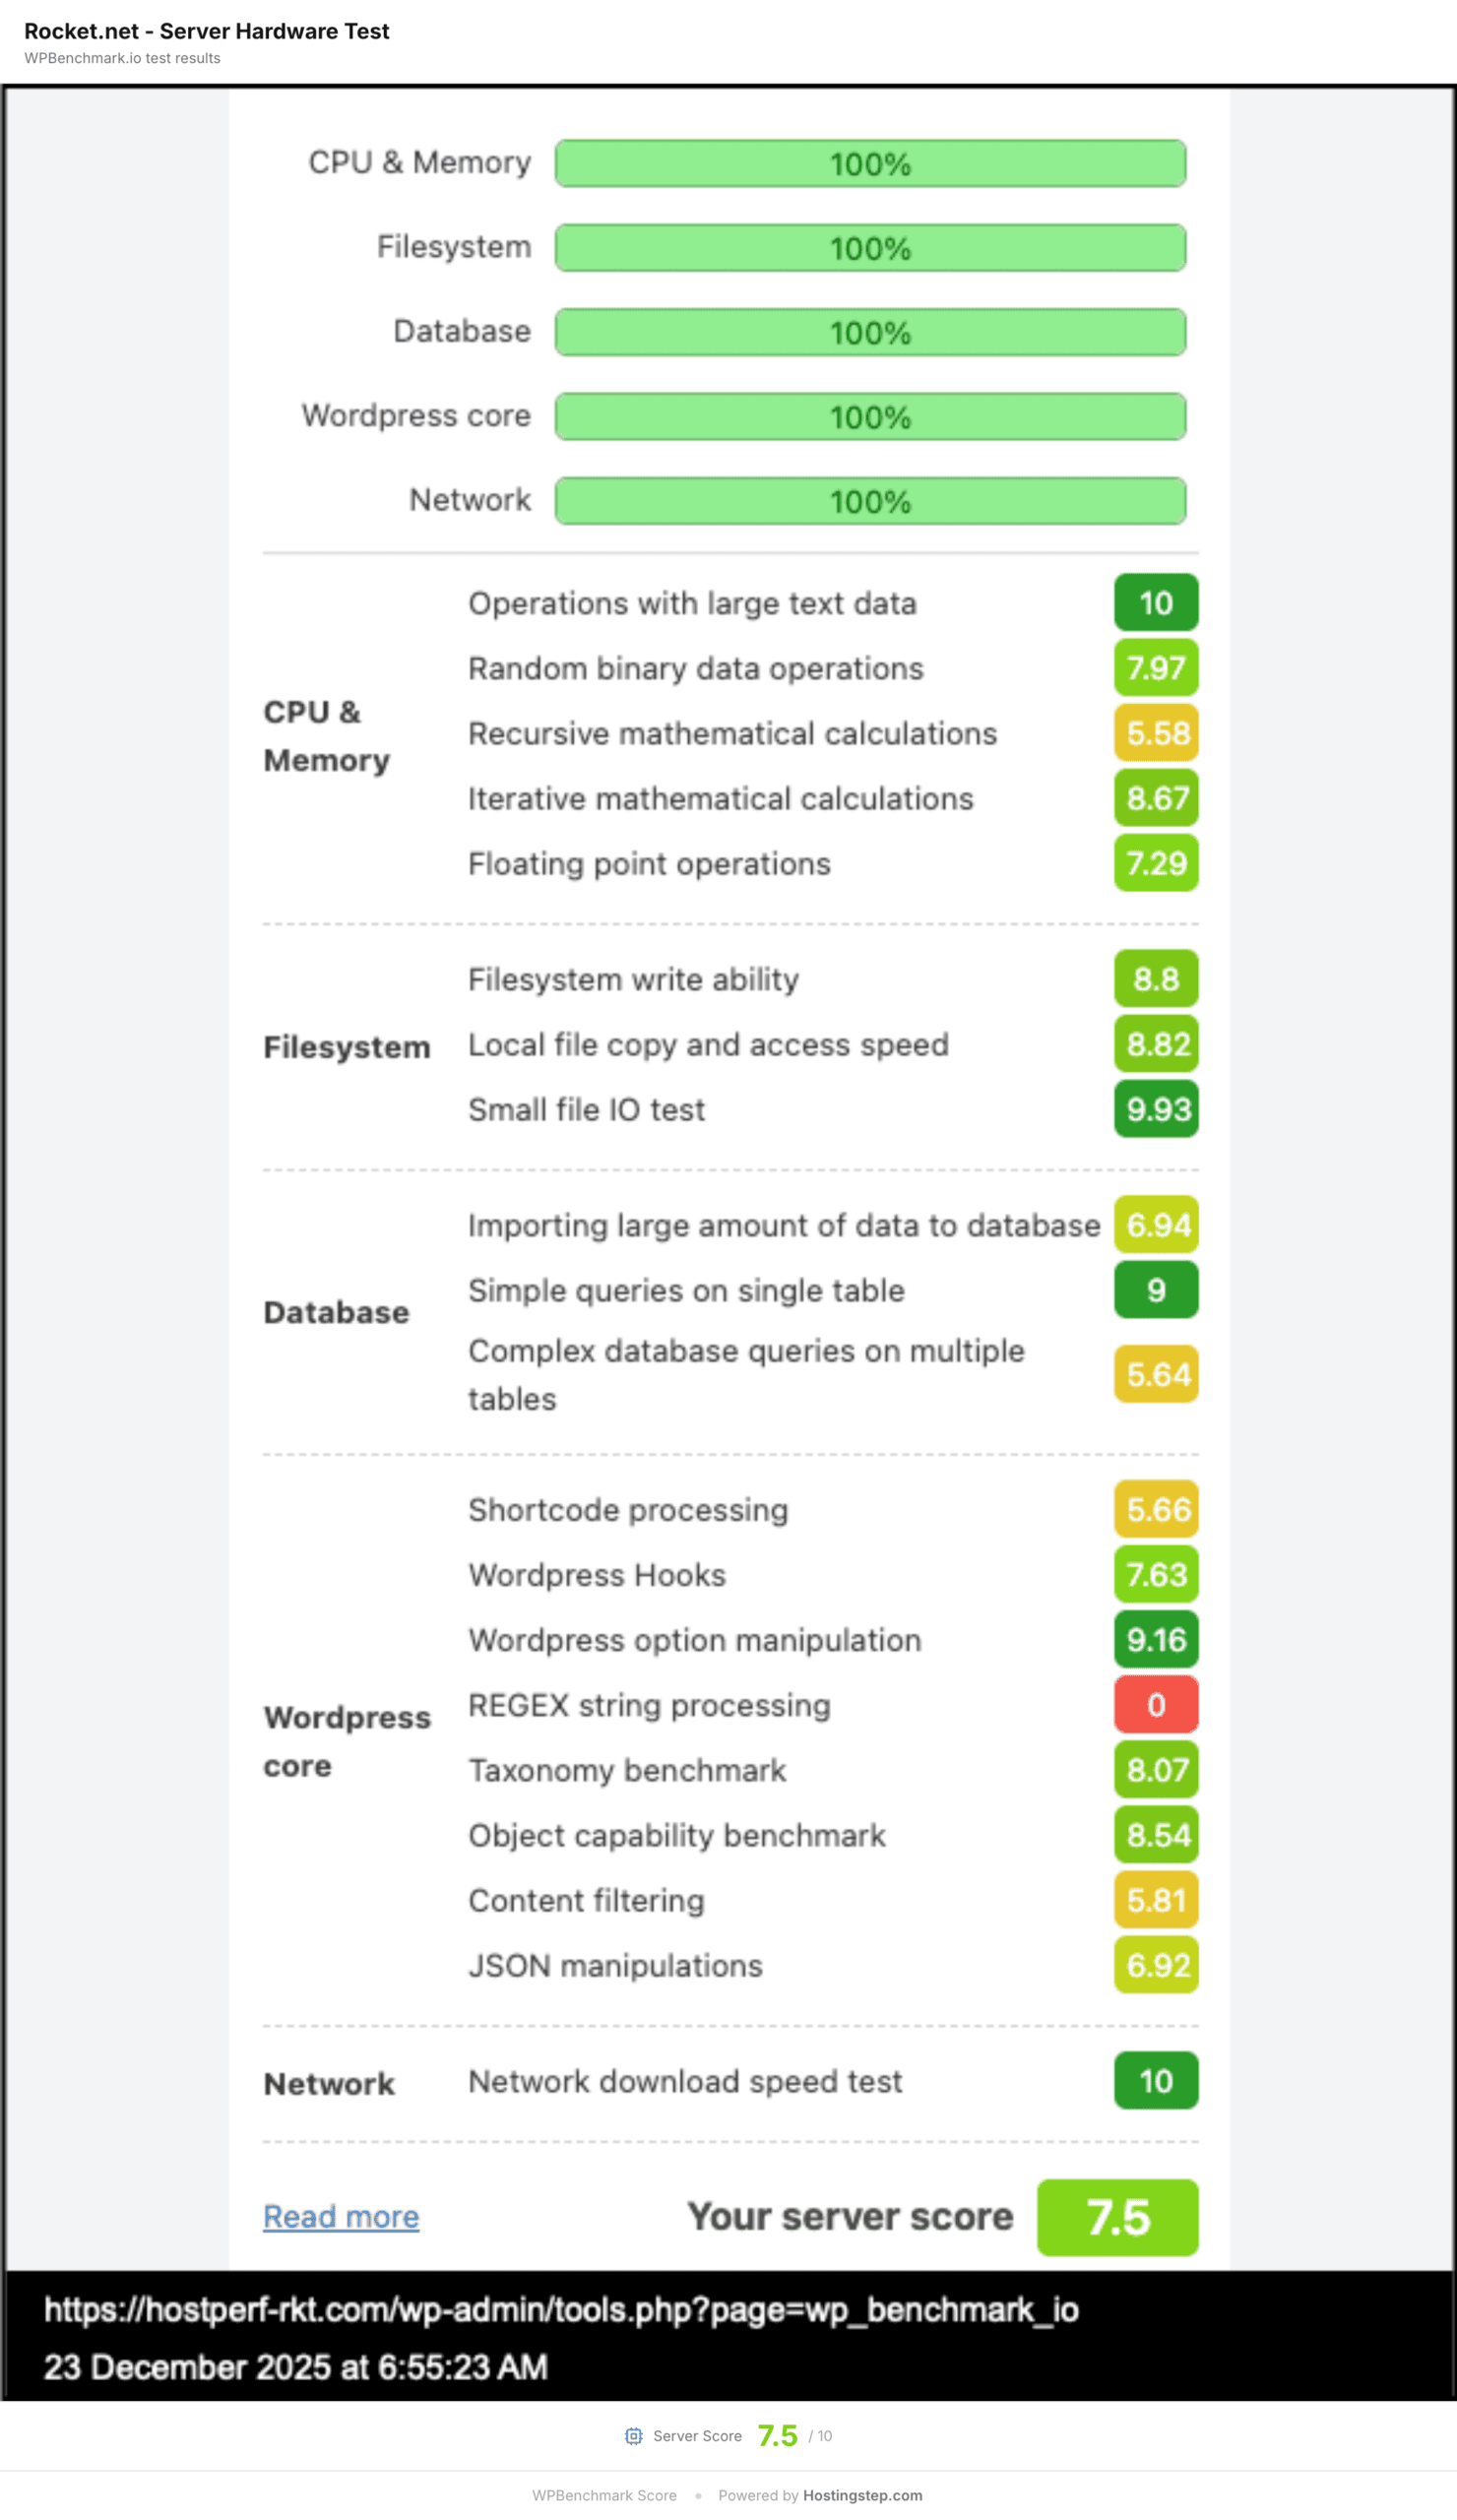 Rocket.net
 Hostinger Business
 InMotion Hosting
 Hostinger
 Liquid Web
 Ionos
Ionos WordPress.com
 Pressable
 EasyWP
 WP Engine
 WPX
WPX DreamHost
 DreamPress
 ChemiCloud
 Hosting.com
 InterServer
 HostArmada
 GreenGeeks
 NameCheap
 FastComet
 Cloudways
 GoDaddy Managed WP
 GoDaddy
 NameHero
Benchmark Test 5: Global TTFB
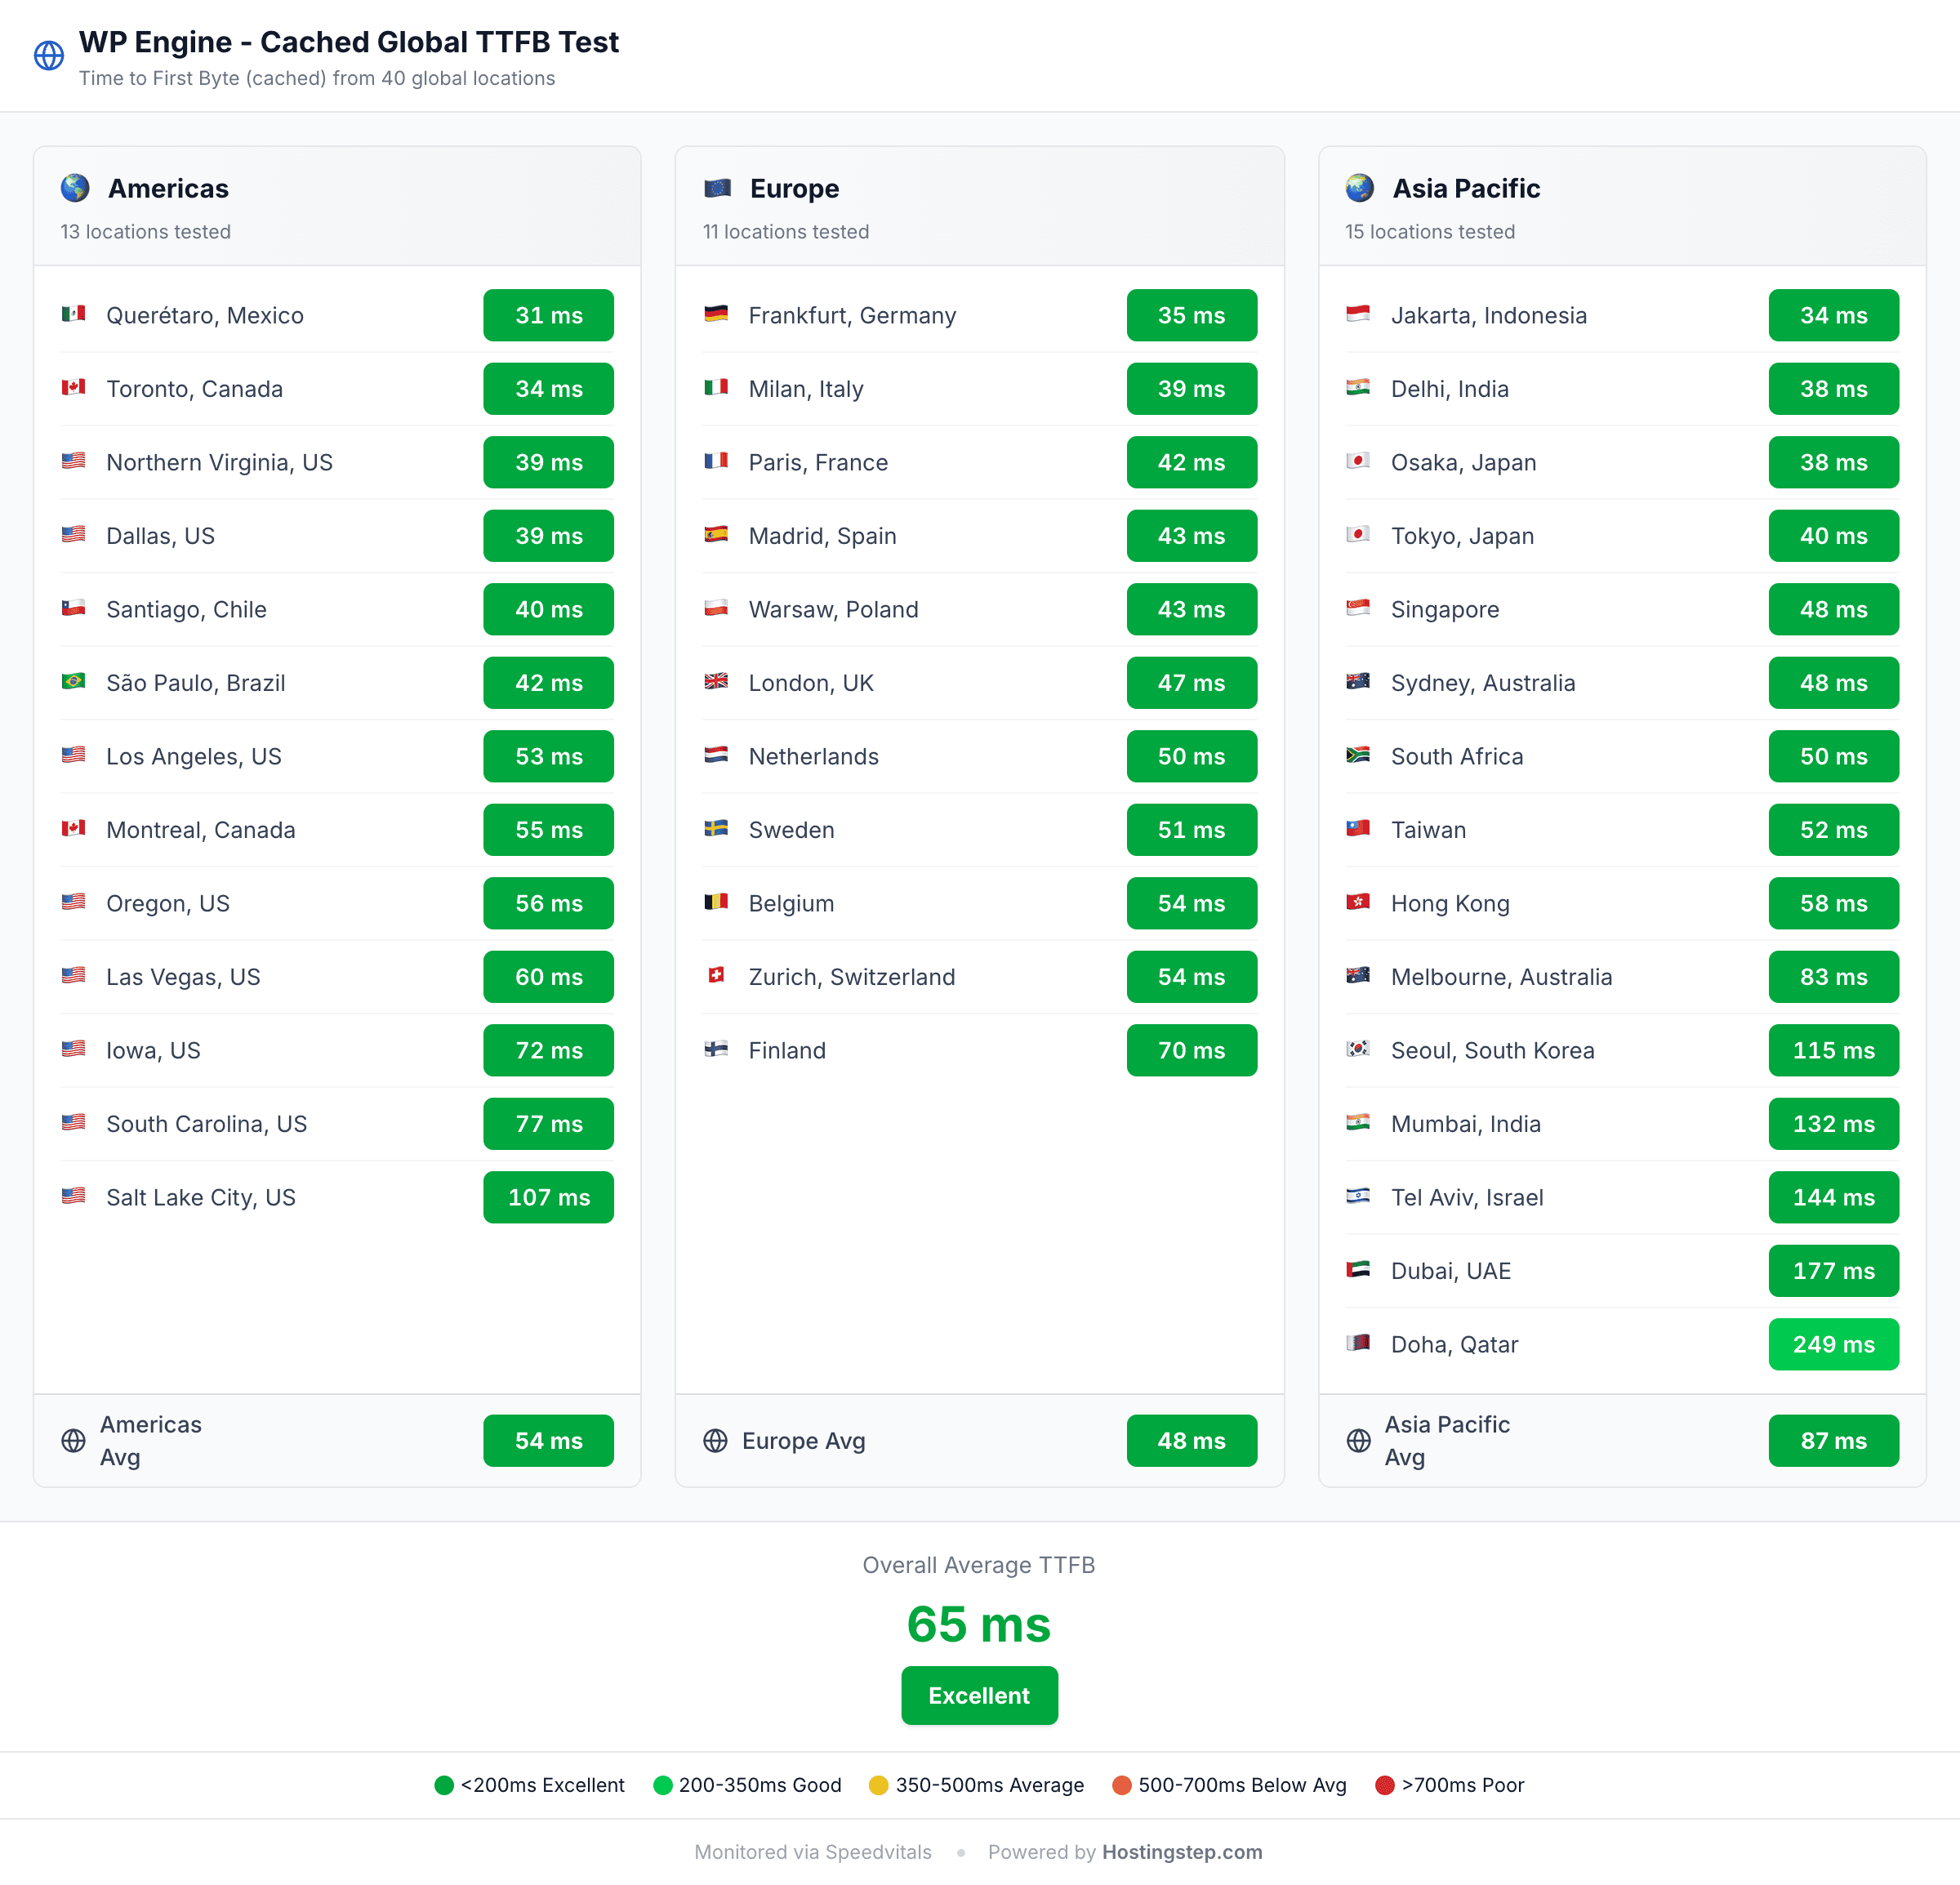
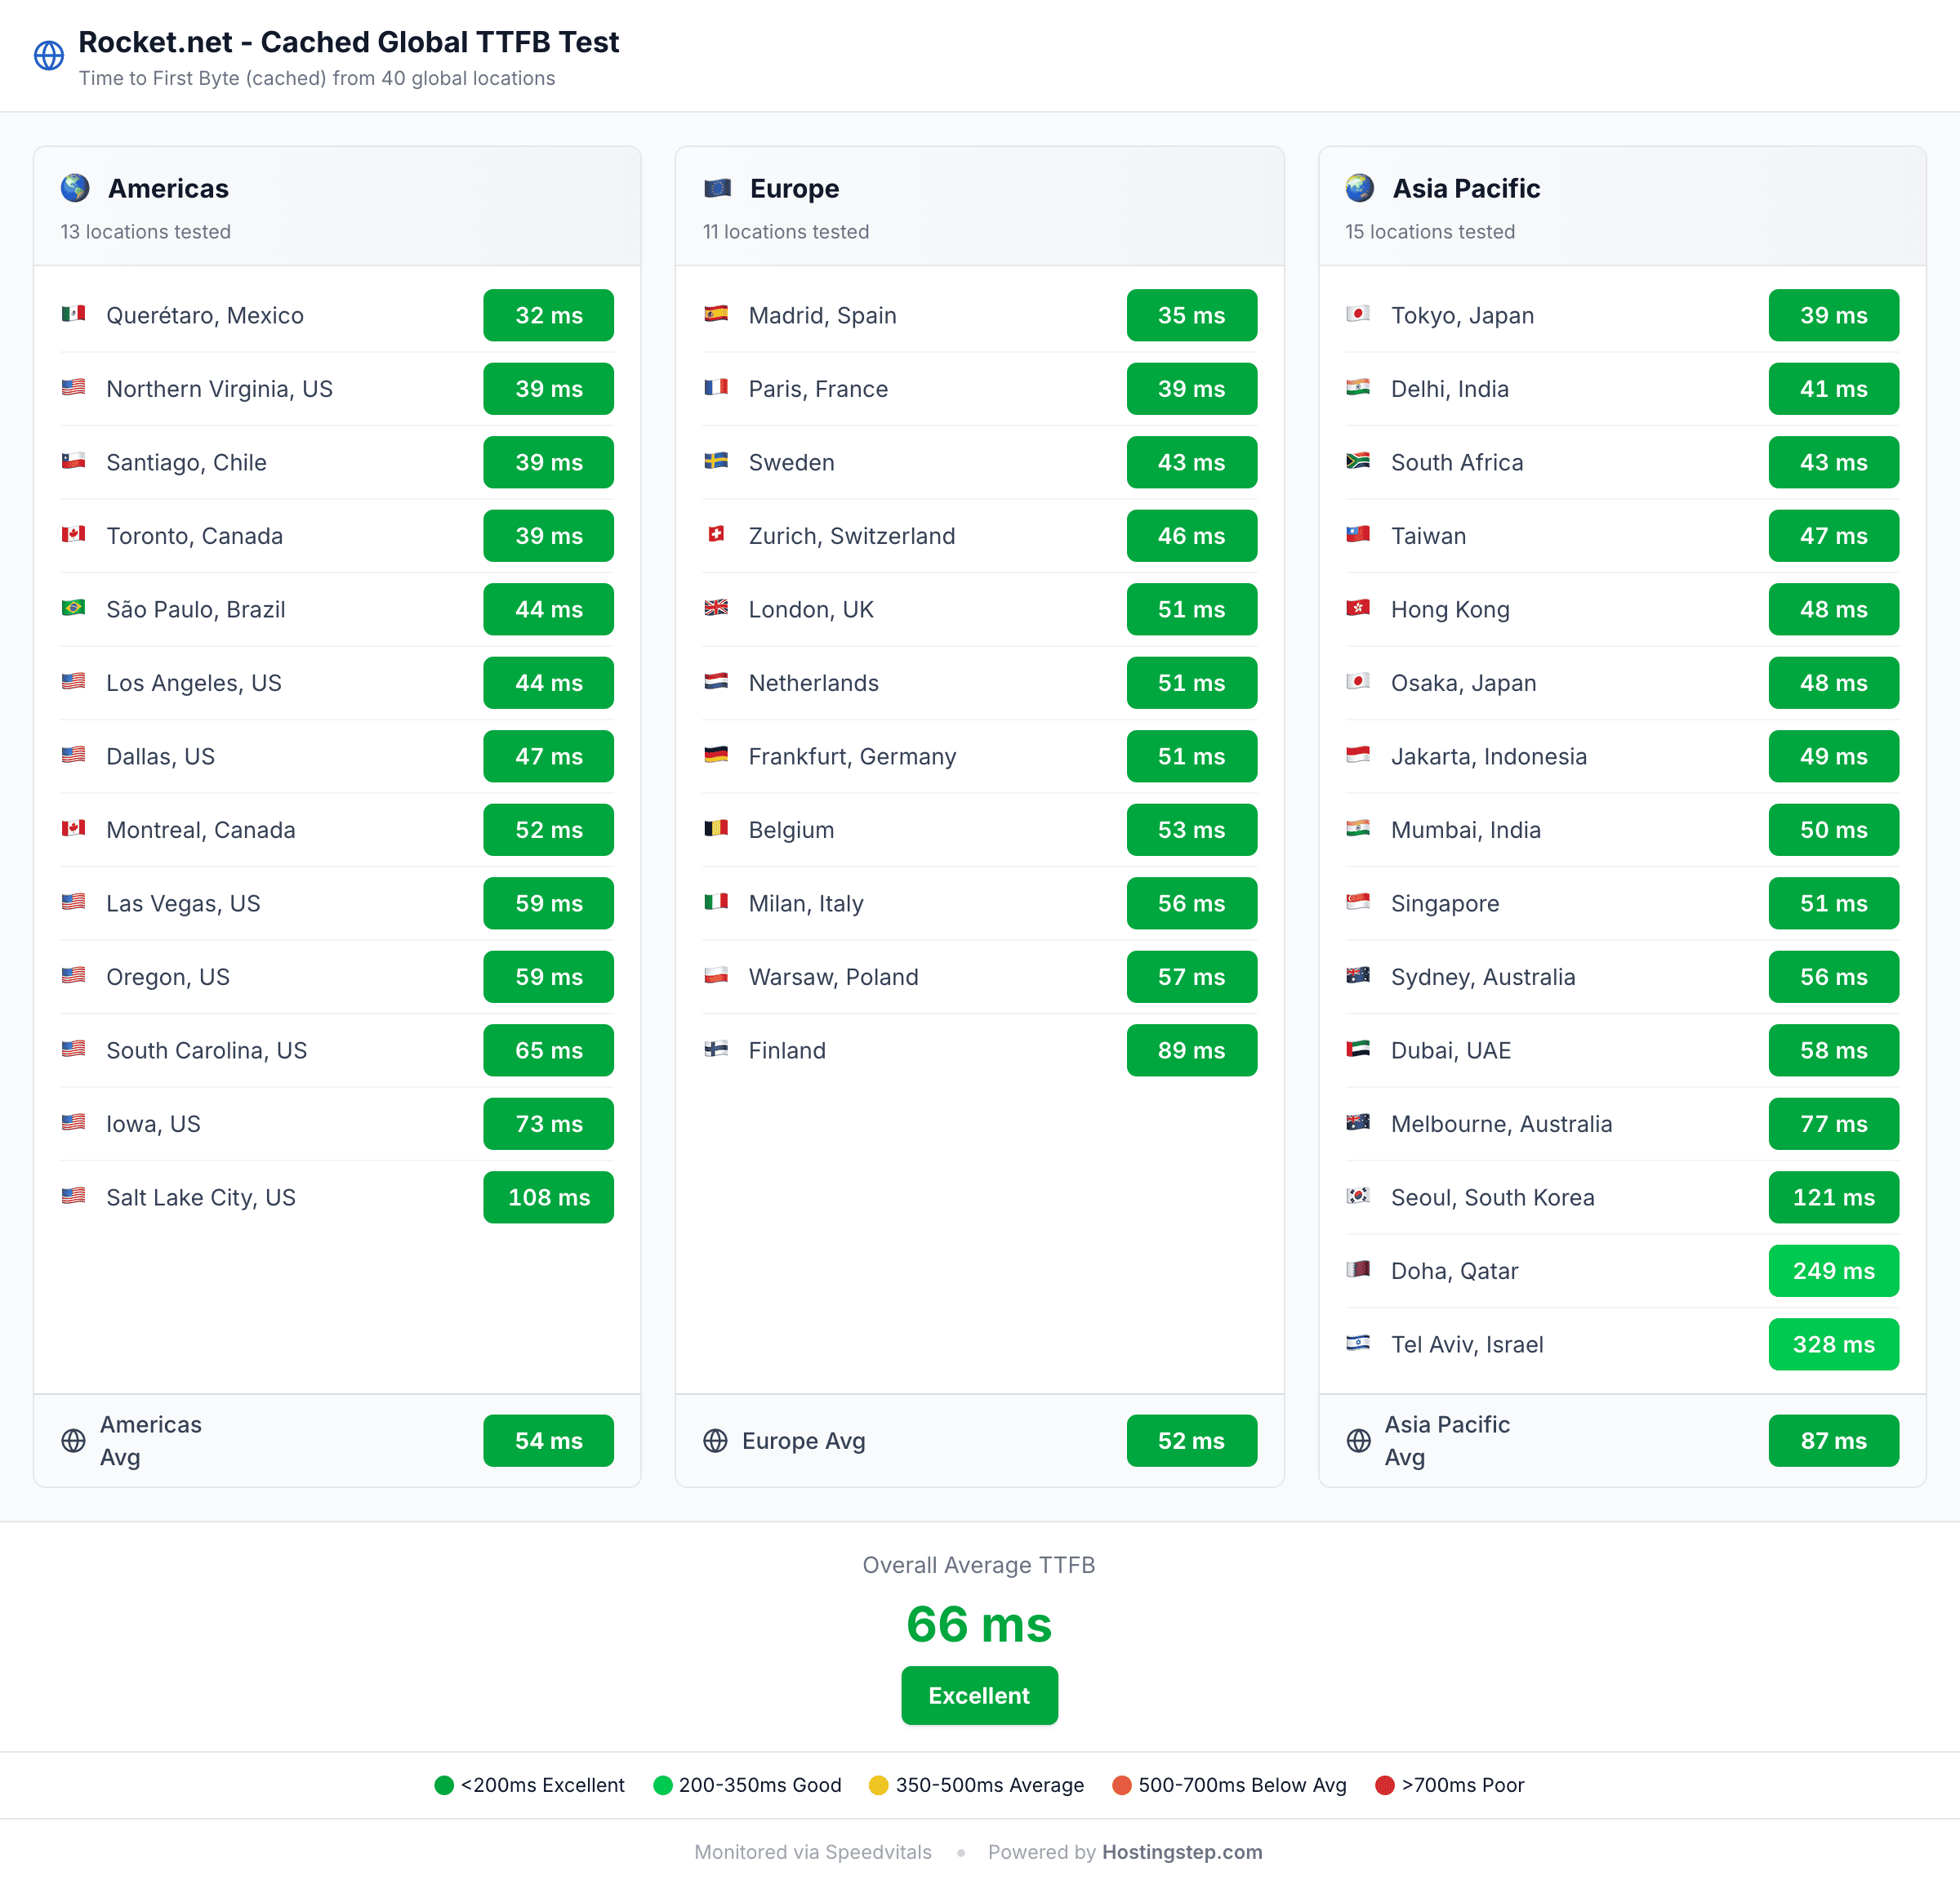
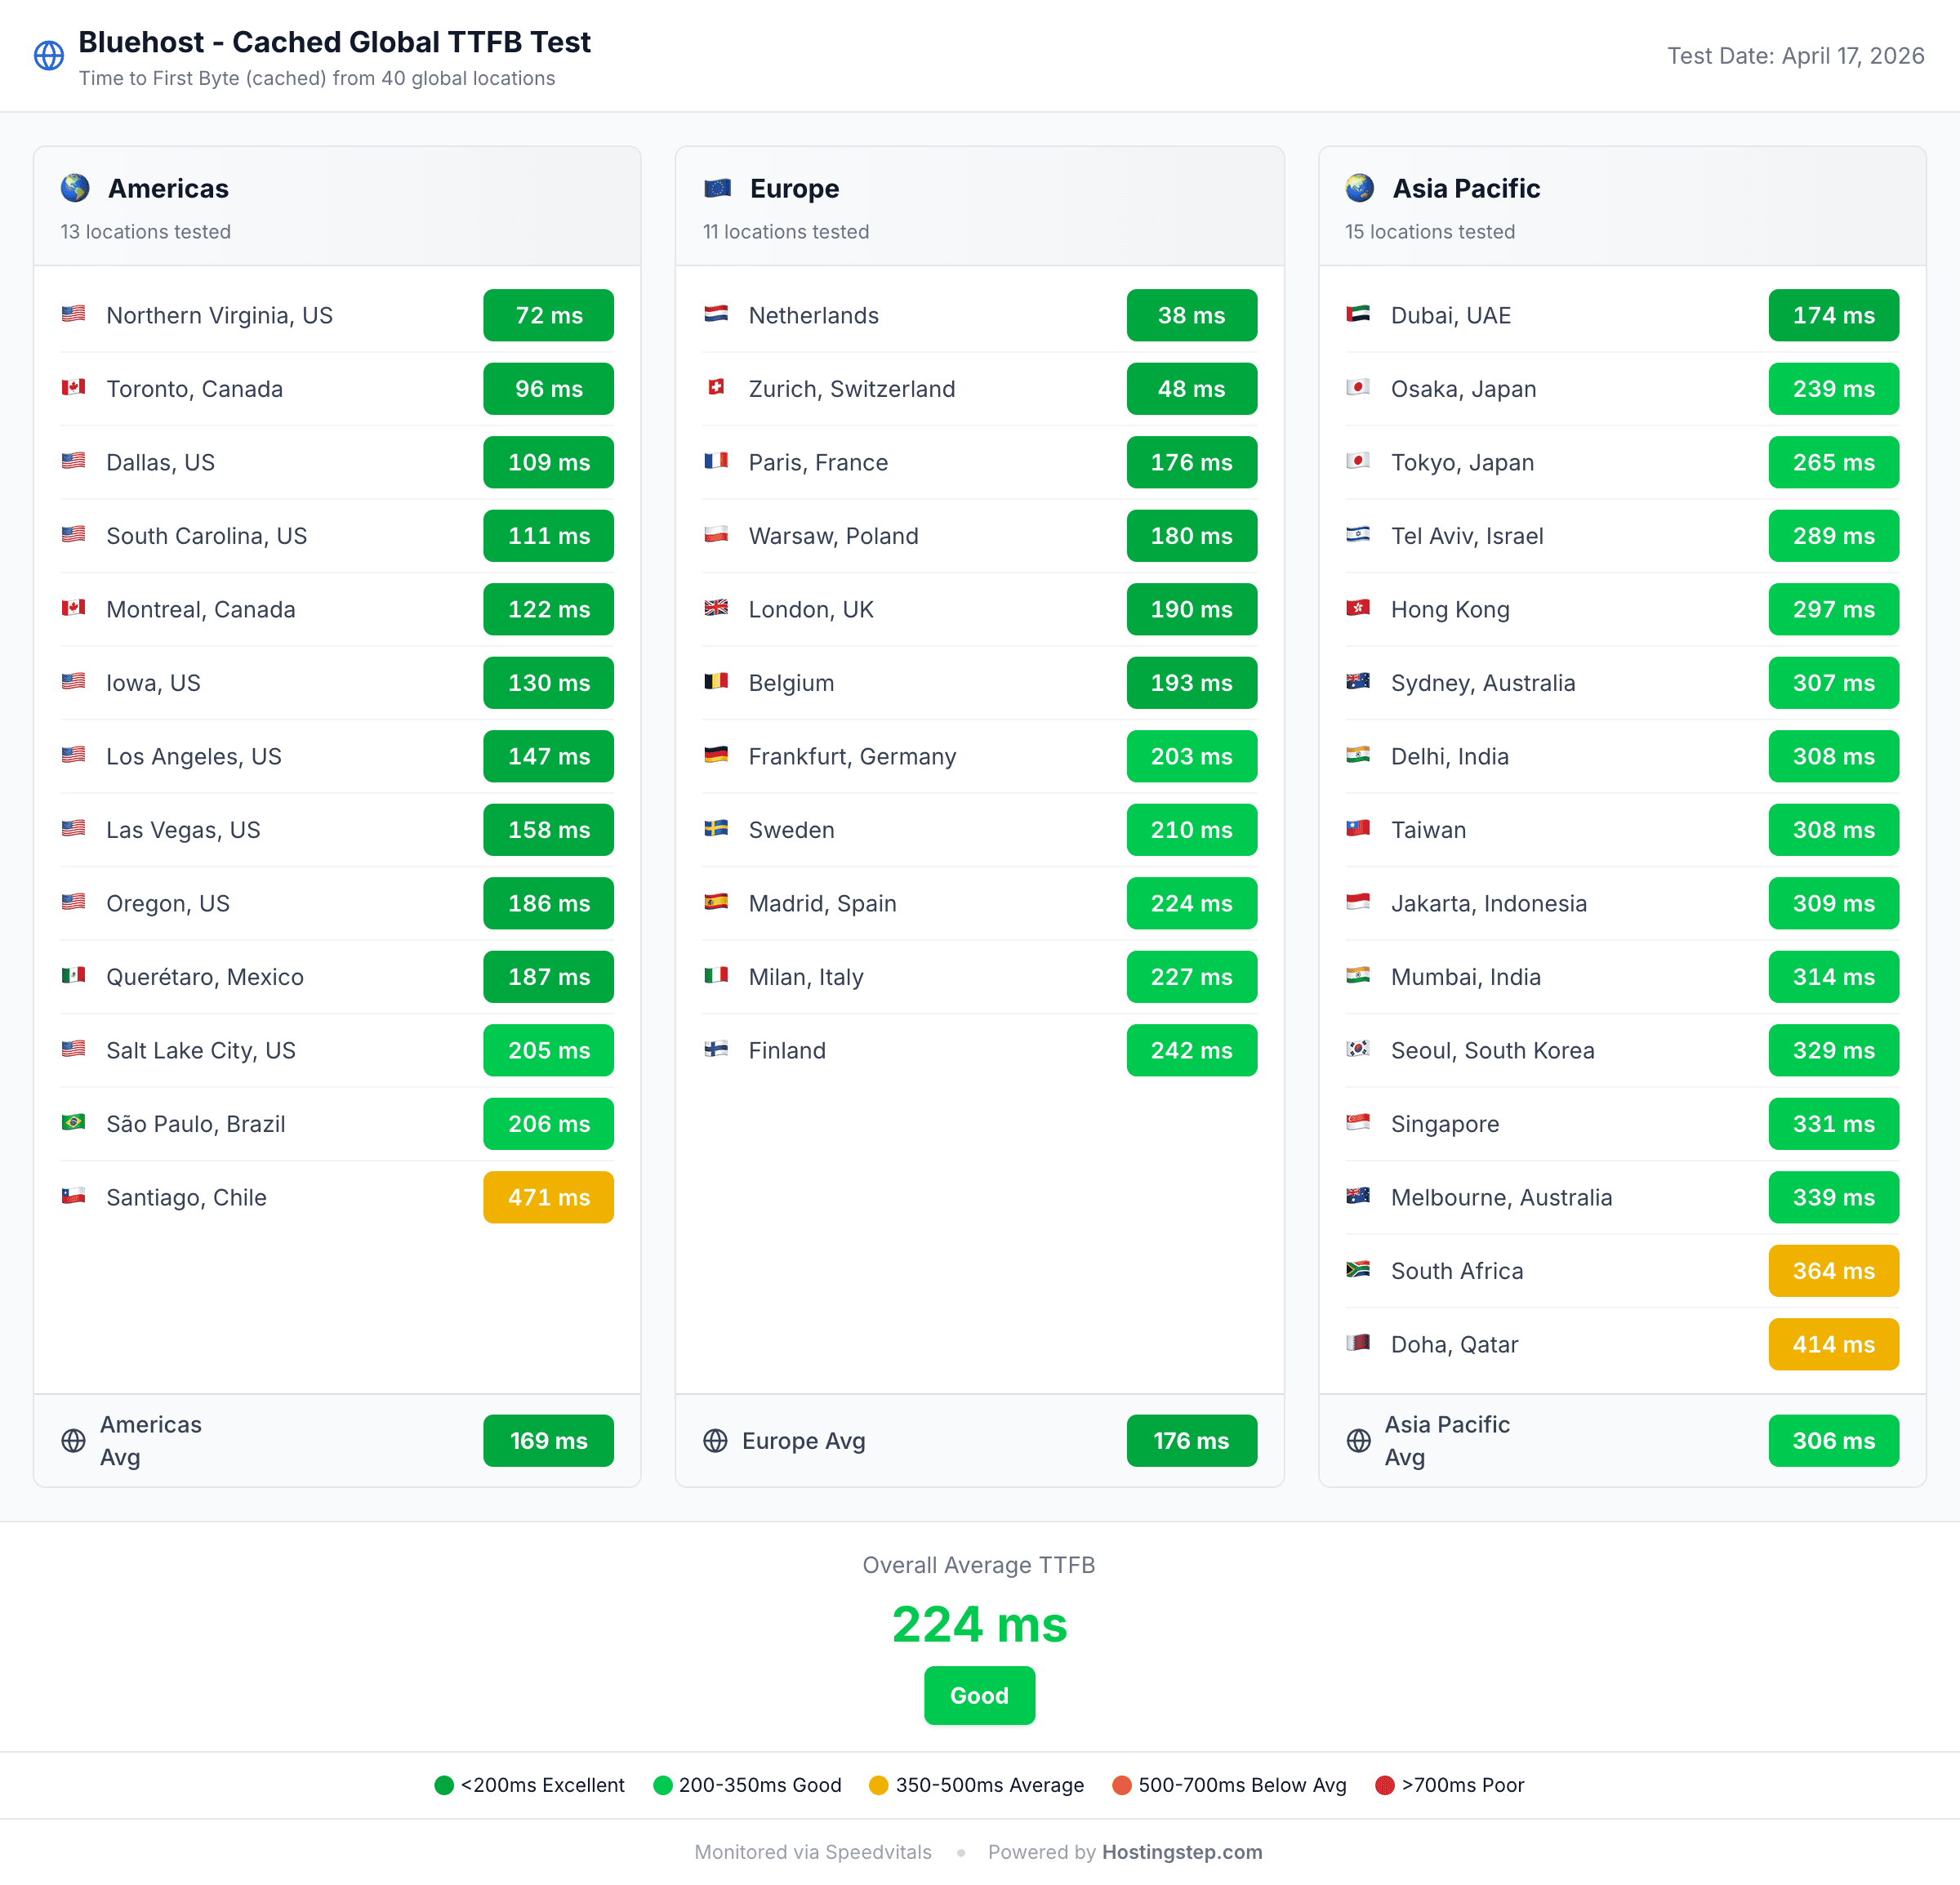
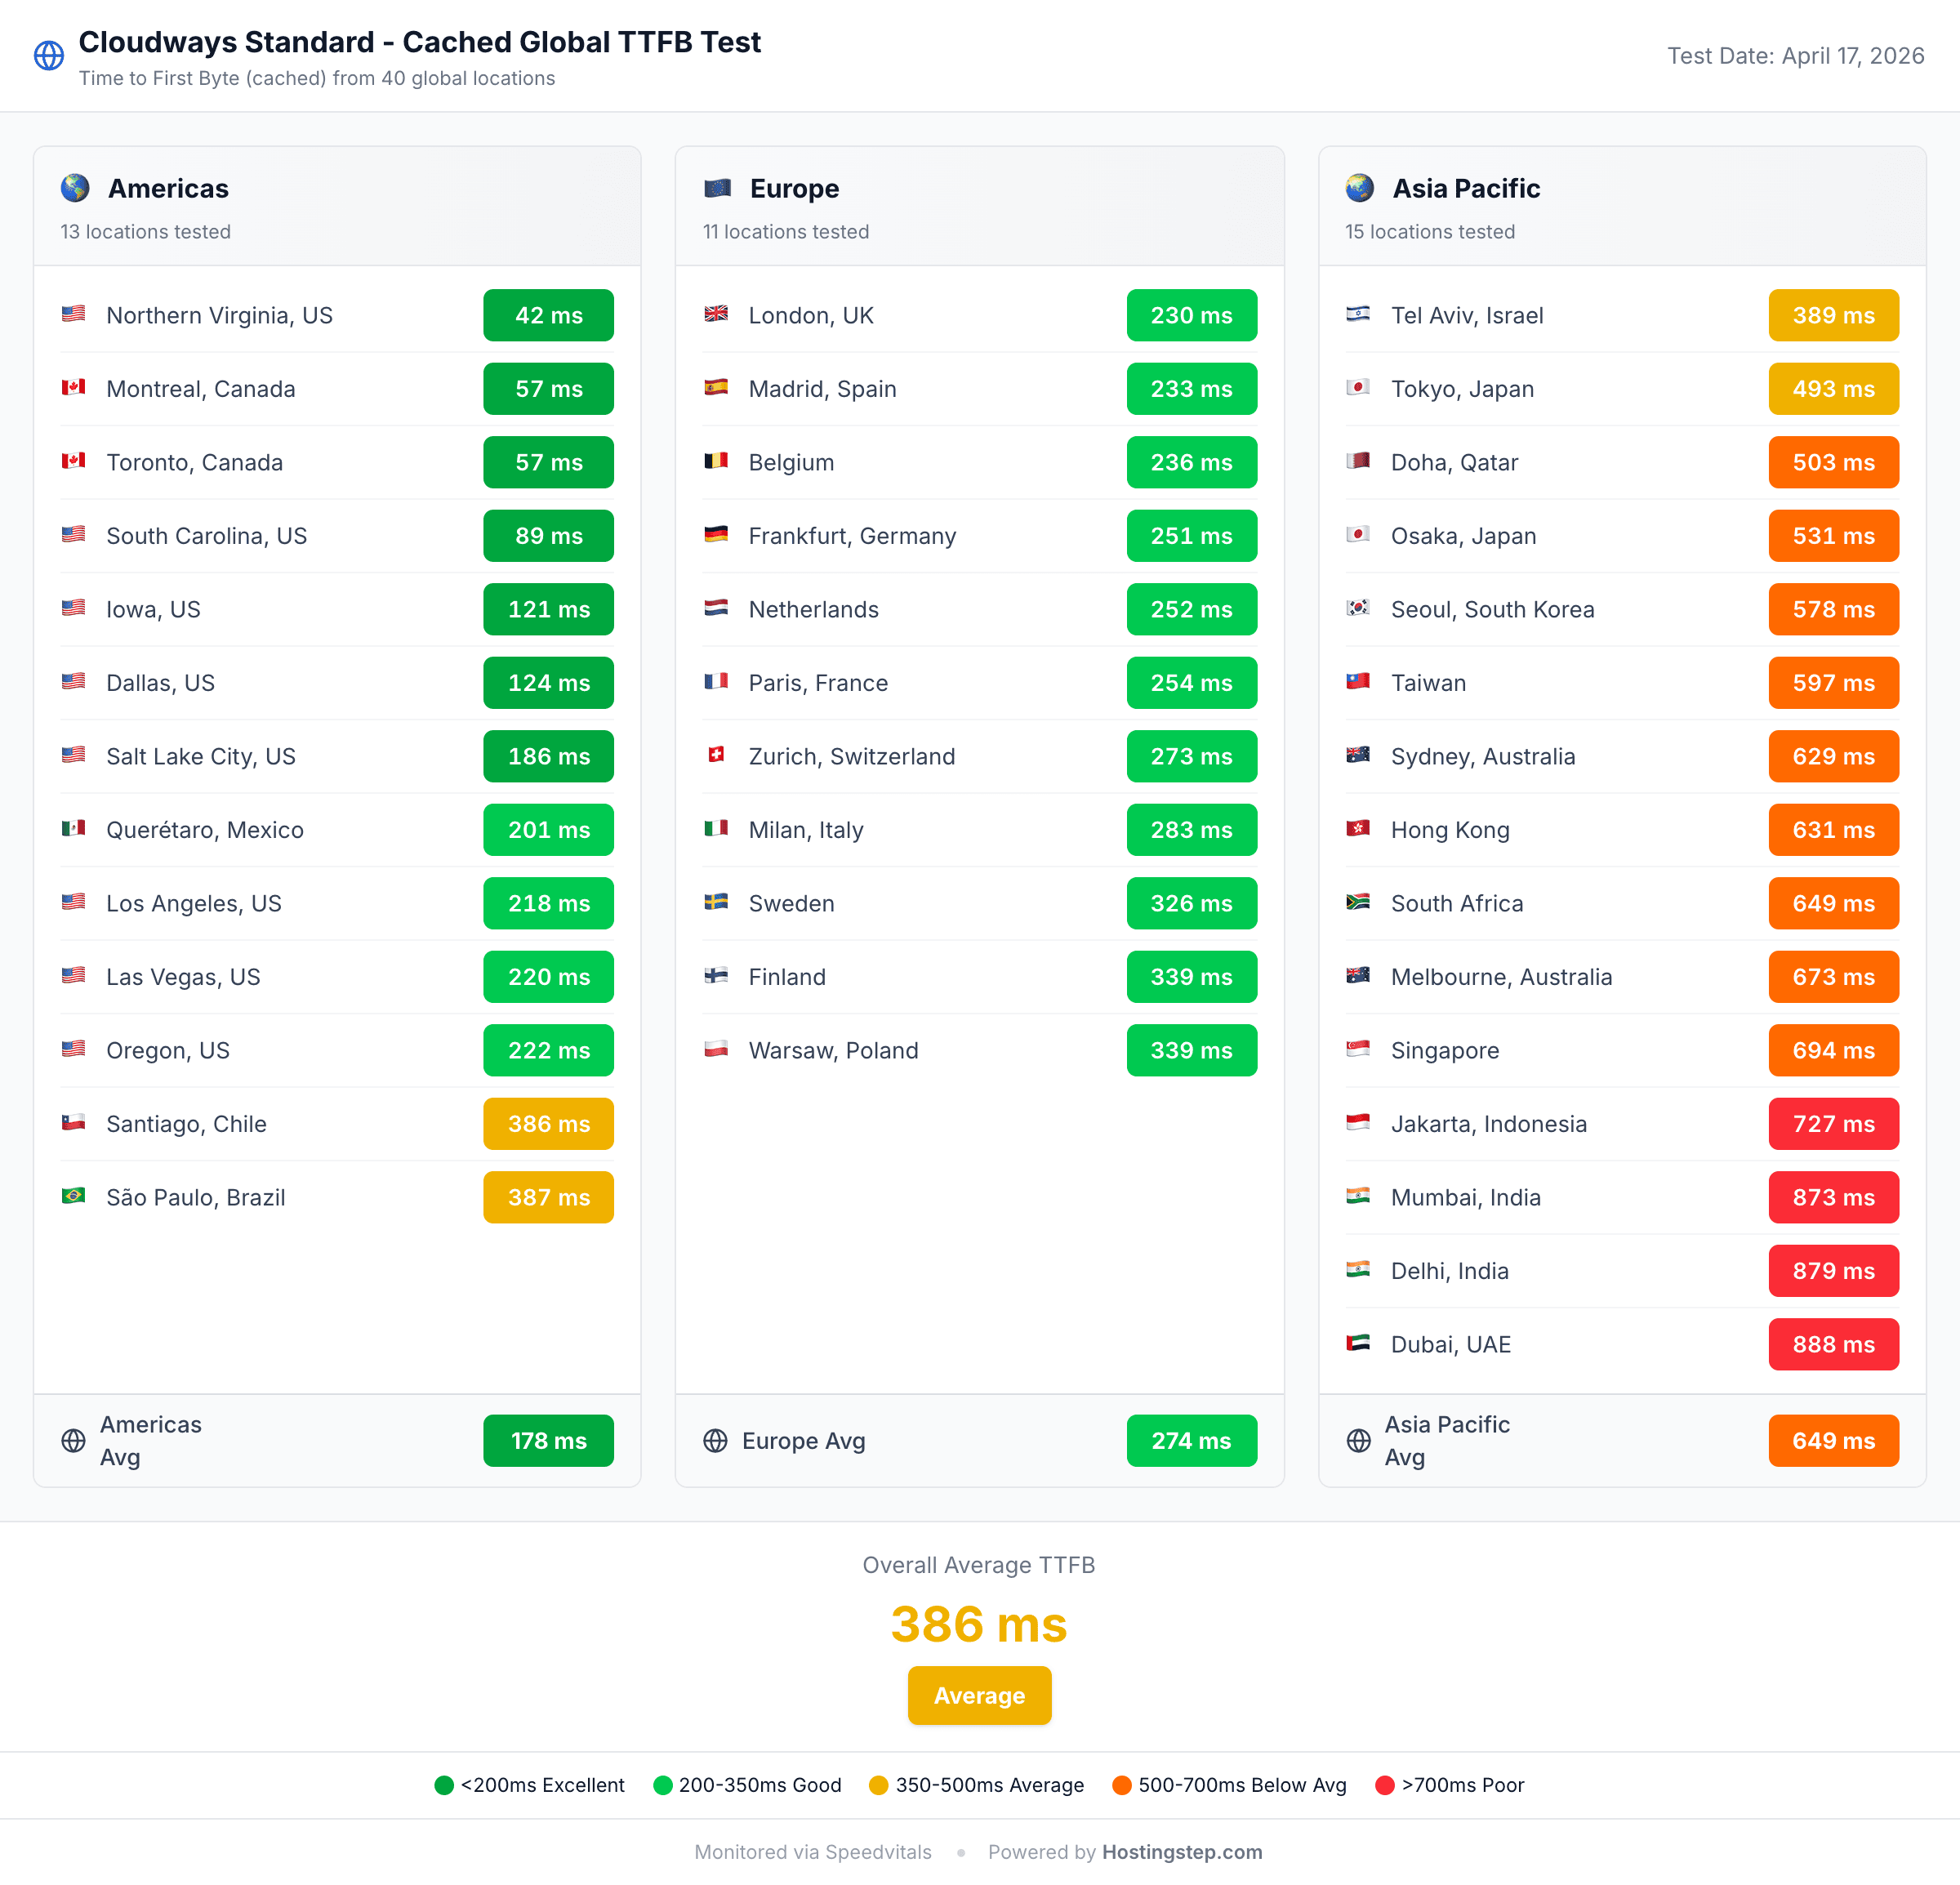
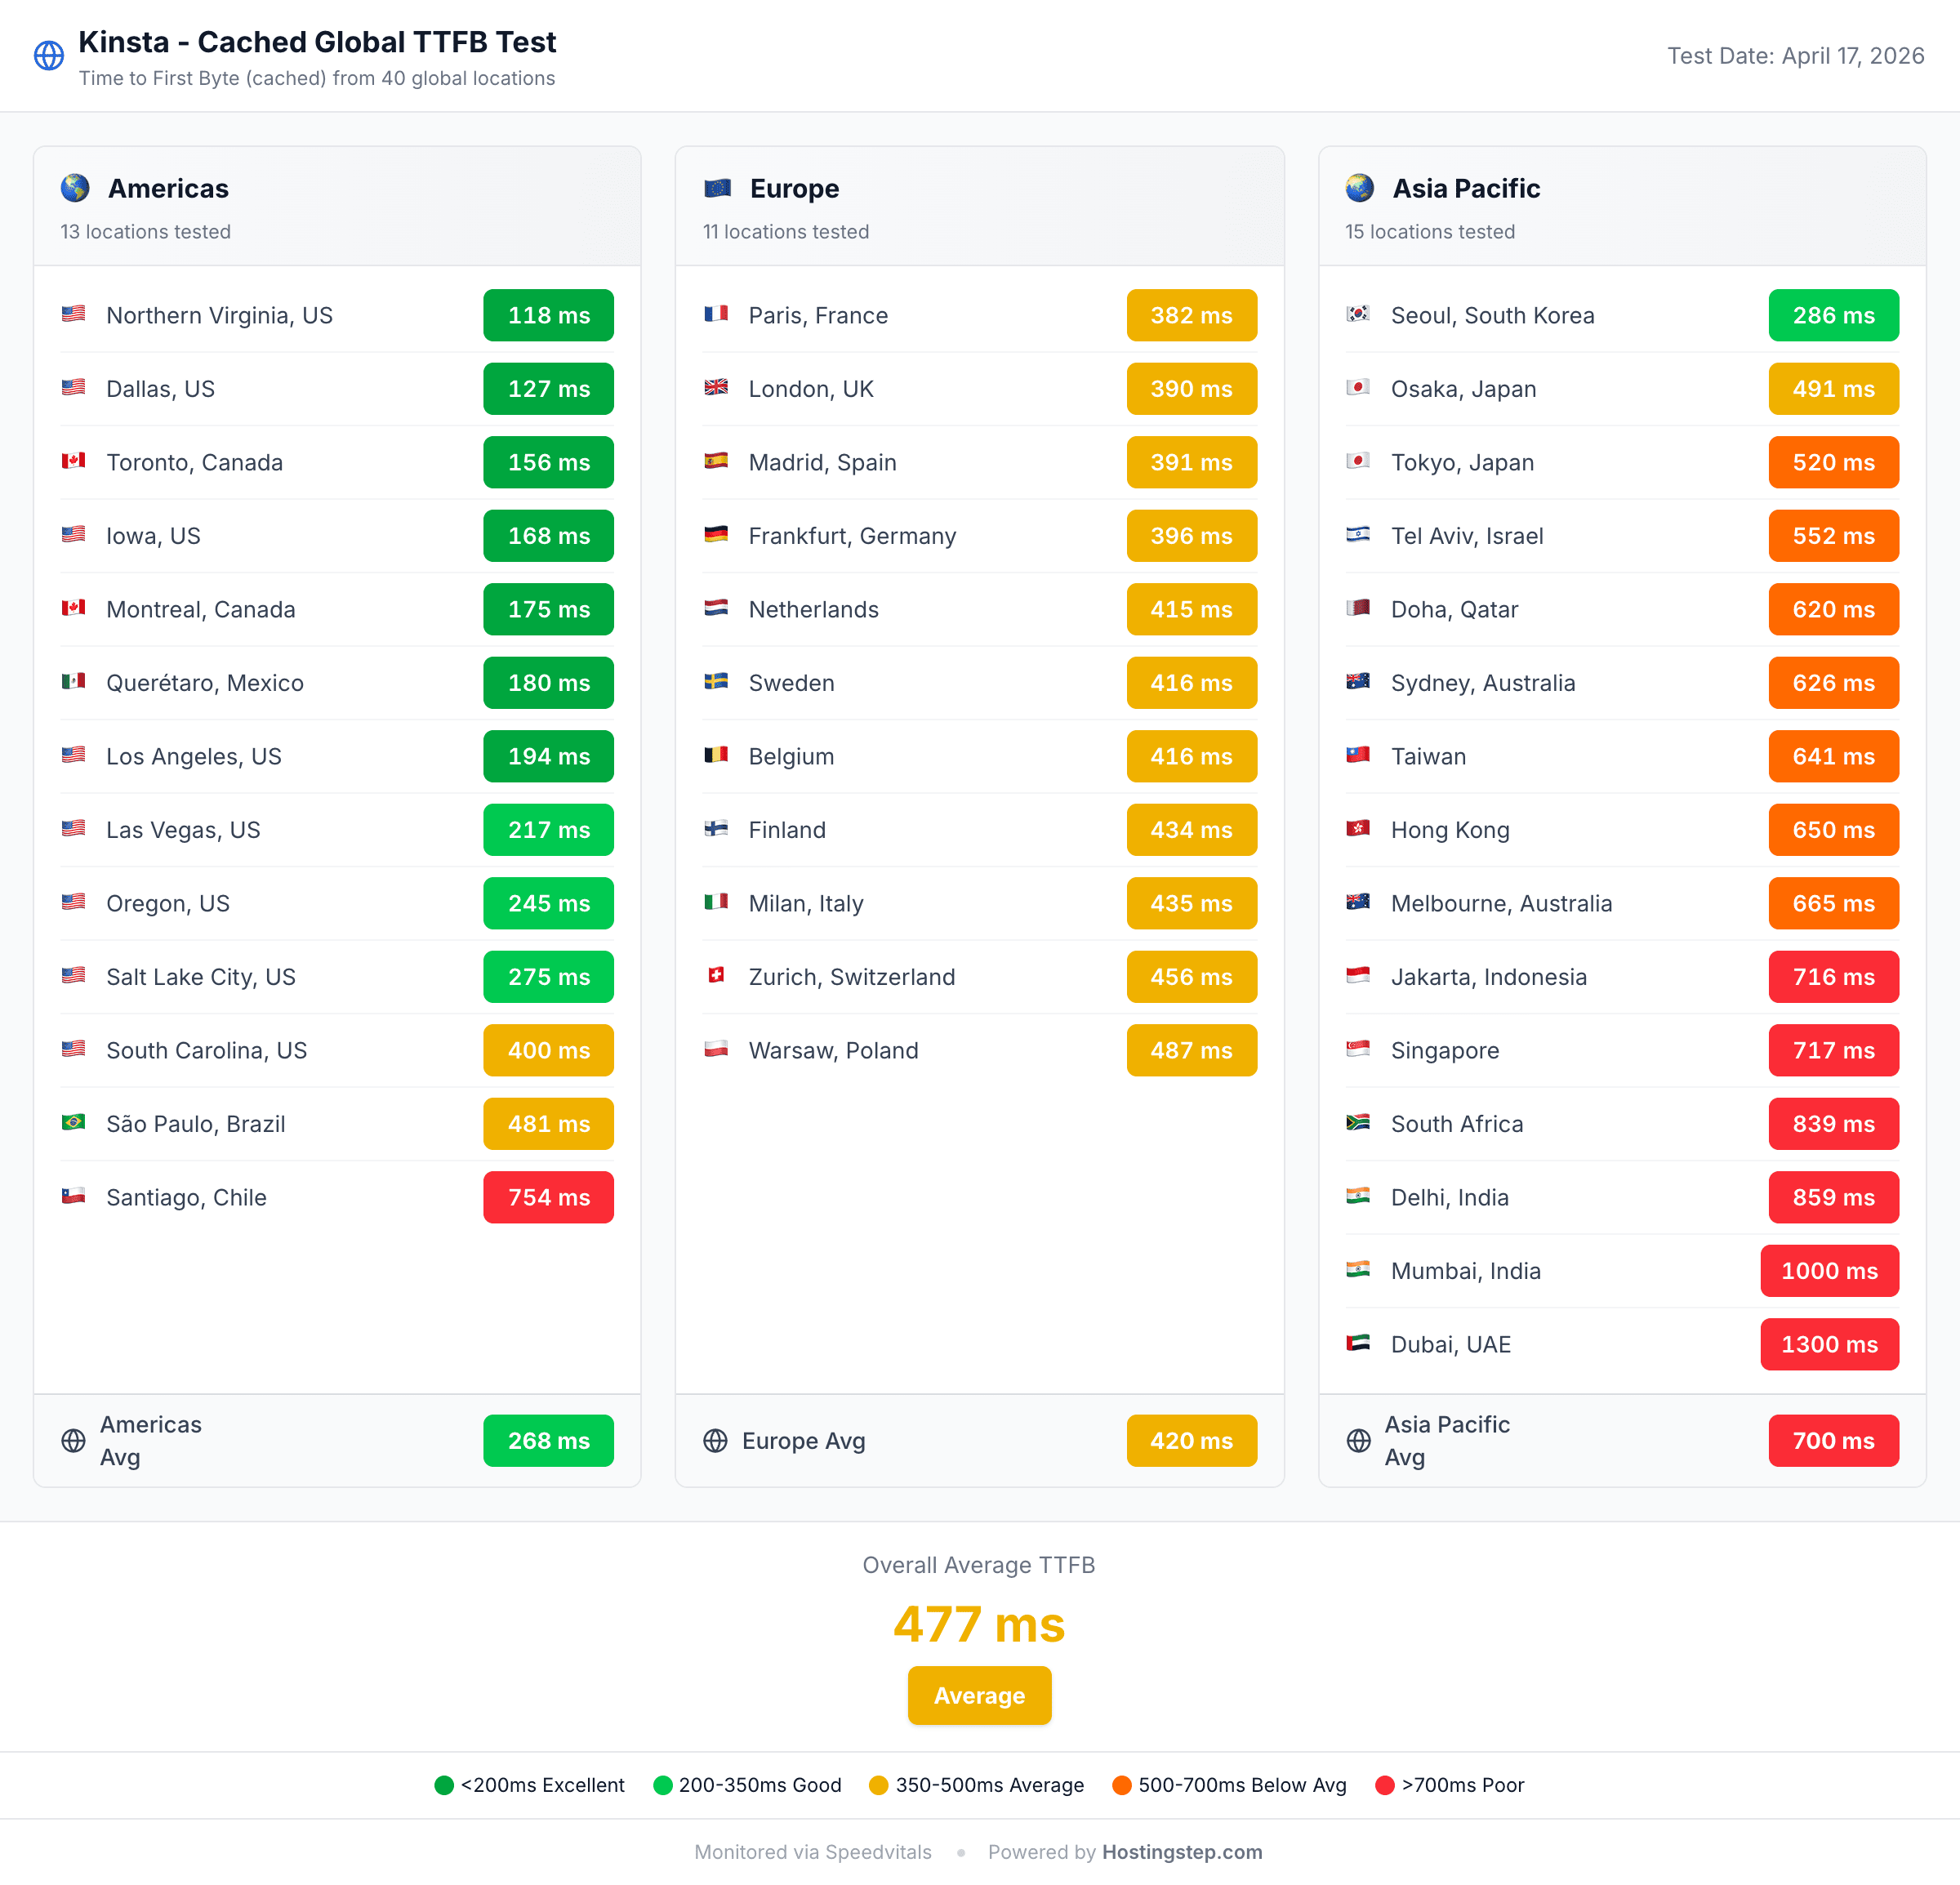
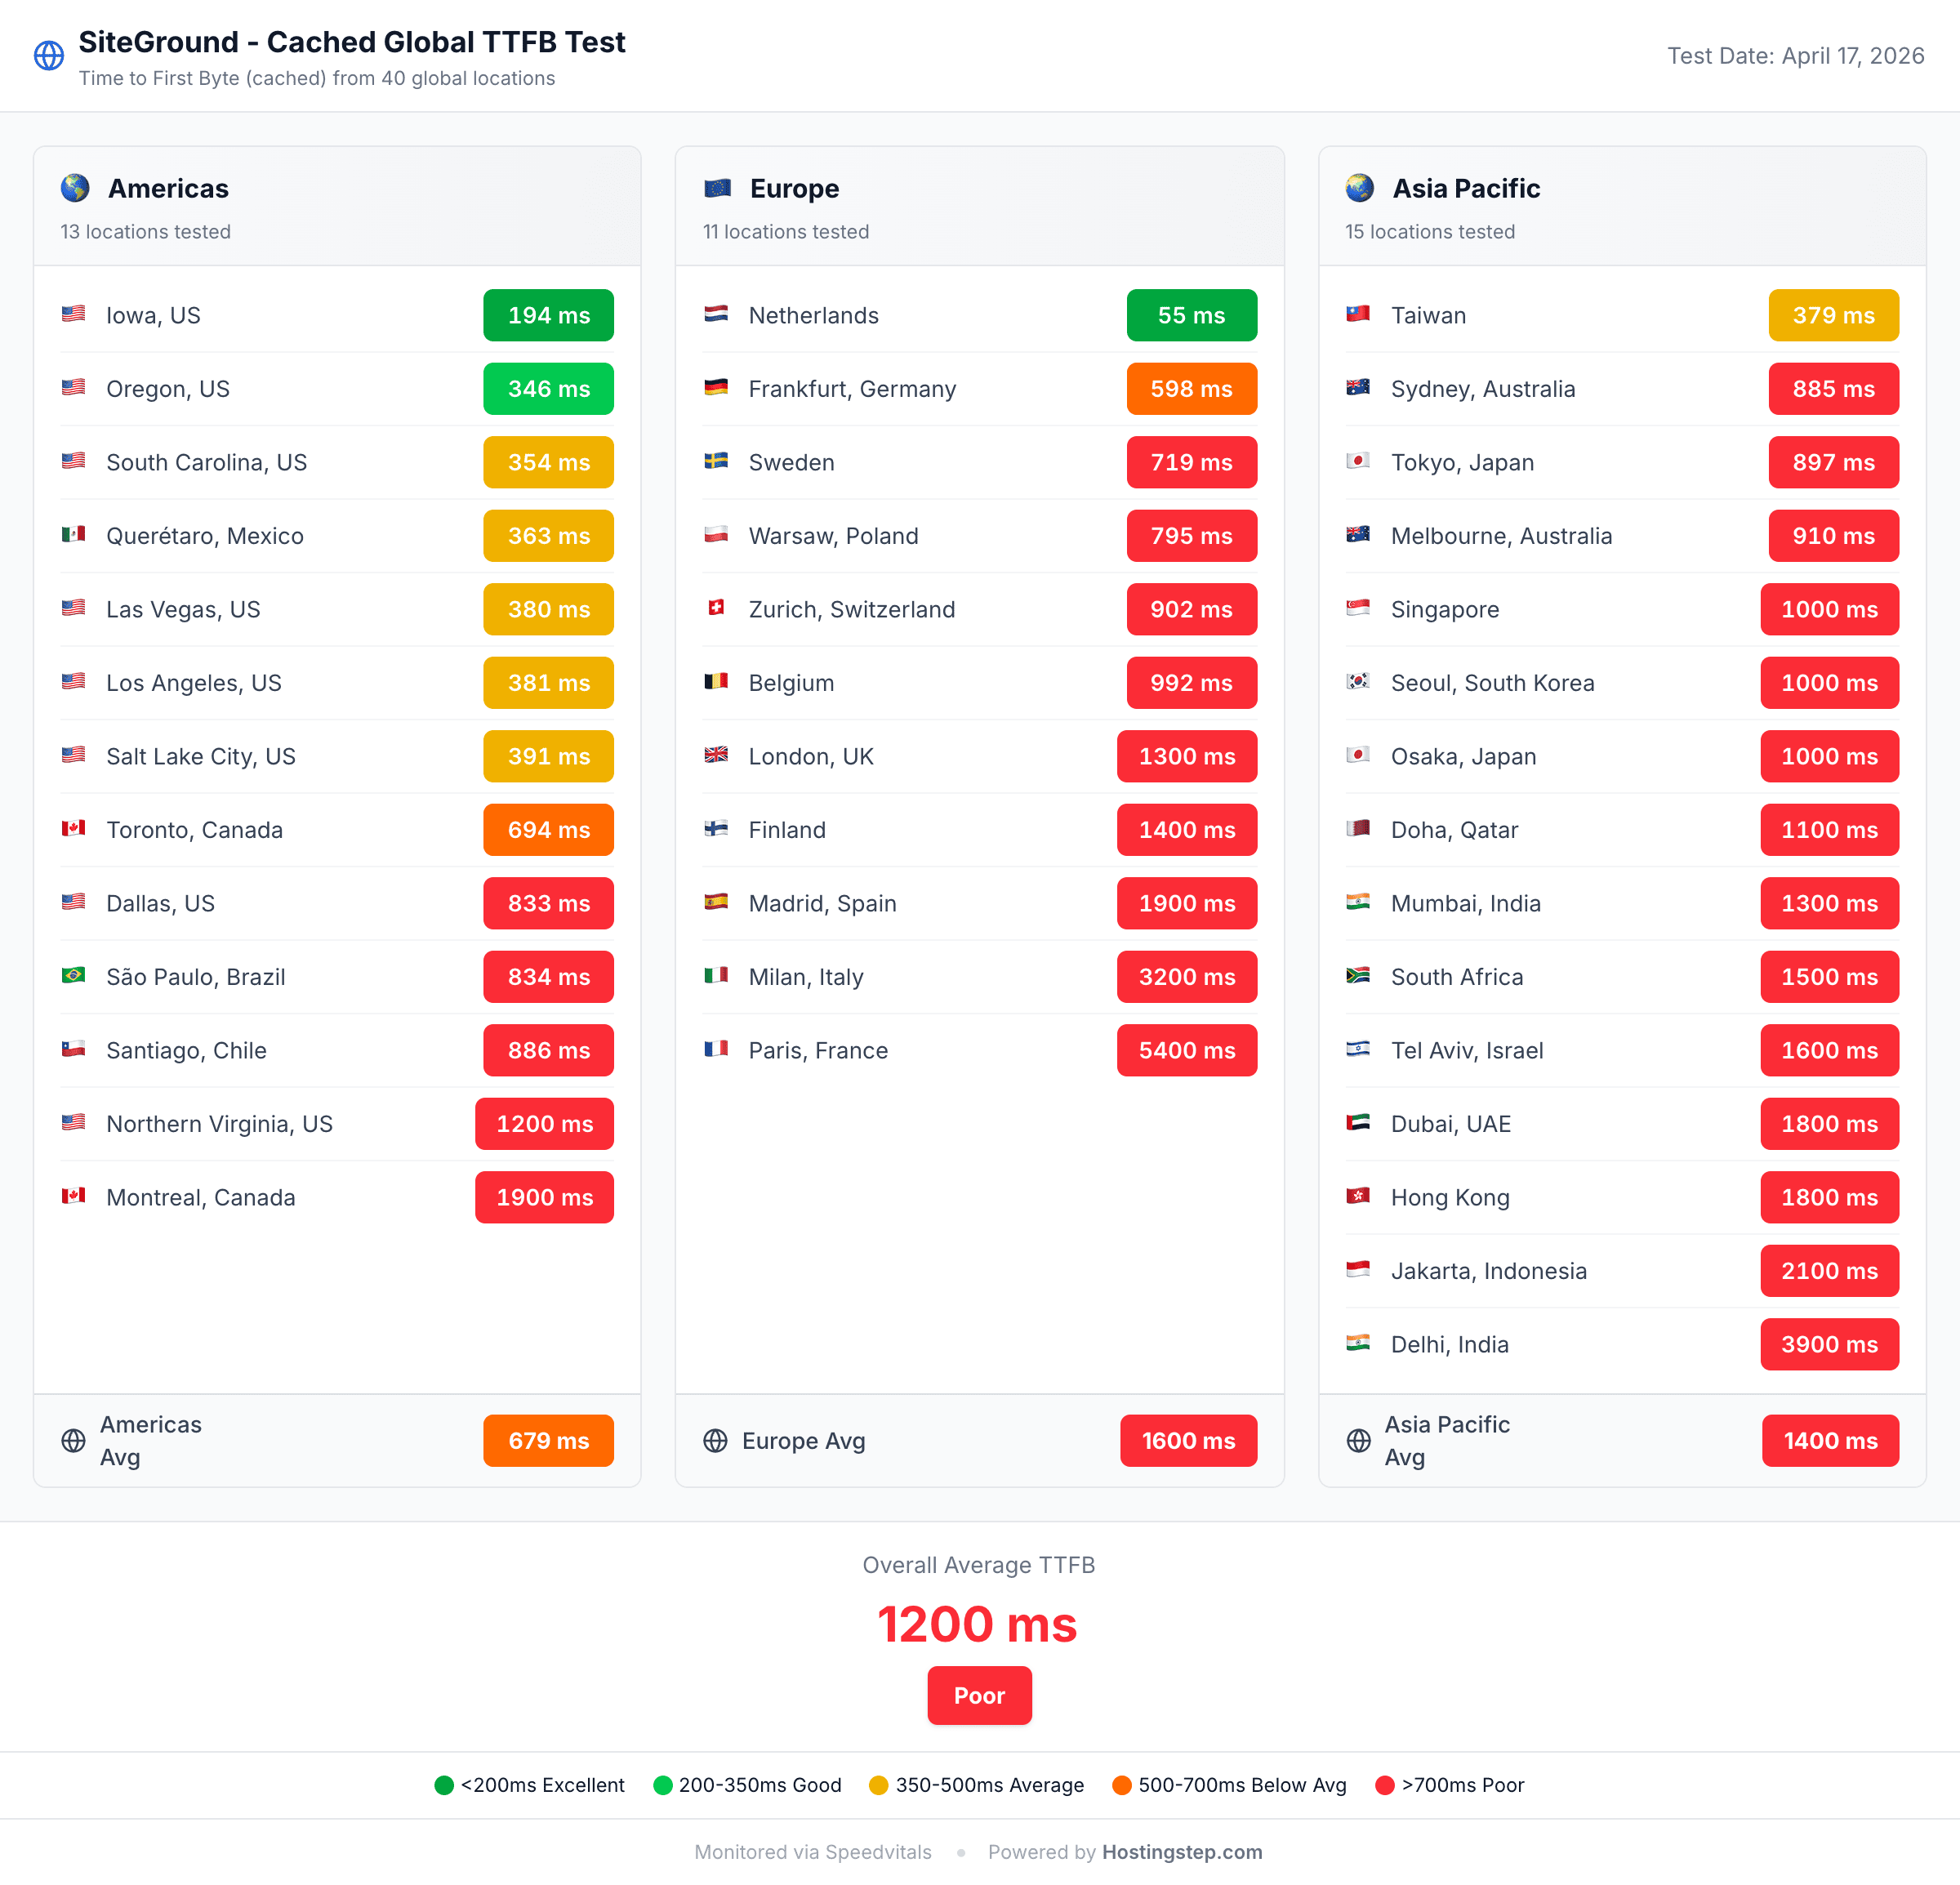
Global TTFB measures how each host performs for visitors outside the US. Every test site sits in a US data center, so for a host without a CDN this number mostly measures how far the visitor is from the origin, not how fast the server is. SpeedVitals pings the cached test page from 40 locations: 13 in the Americas, 11 in Europe and 16 across Asia-Pacific, the Middle East and Africa. Google’s 800ms line is the only absolute mark on this chart.
WP EngineRocket.netWordPress.comPressableGoDaddy Managed WPTemplBluehostWPXLiquid WebHostinger BusinessDreamHostCloudwaysGreenGeeksFastCometInMotionHostingHostArmadaHostingerHostGatorScalaHostingNameCheapNameHeroChemiCloudKinstaIonosEasyWPHosting.comGoDaddyDreamPressInterServerSiteGround| # | Hosting | Global TTFB | CDN type |
|---|---|---|---|
| 1 | WP Engine | 65ms | edge CDN |
| 2 | Rocket.net | 66ms | edge CDN |
| 3 | WordPress.com | 69ms | edge CDN |
| 4 | Pressable | 74ms | edge CDN |
| 5 | GoDaddy Managed WP | 75ms | edge CDN |
| 6 | Templ | 167ms | edge CDN |
| 7 | Bluehost | 224ms | static CDN |
| 8 | WPX | 240ms | edge CDN |
| 9 | Liquid Web | 349ms | static CDN |
| 10 | Hostinger Business | 351ms | static CDN |
| 11 | DreamHost | 385ms | no CDN |
| 12 | Cloudways | 386ms | no CDN |
| 13 | GreenGeeks | 386ms | no CDN |
| 14 | FastComet | 387ms | no CDN |
| 15 | InMotionHosting | 390ms | no CDN |
| 16 | HostArmada | 402ms | no CDN |
| 17 | Hostinger | 404ms | no CDN |
| 18 | HostGator | 427ms | static CDN |
| 19 | ScalaHosting | 442ms | static CDN |
| 20 | NameCheap | 448ms | no CDN |
| 21 | NameHero | 448ms | no CDN |
| 22 | ChemiCloud | 460ms | no CDN |
| 23 | Kinsta | 477ms | edge CDN |
| 24 | Ionos | 480ms | no CDN |
| 25 | EasyWP | 534ms | static CDN |
| 26 | Hosting.com | 642ms | no CDN |
| 27 | GoDaddy | 689ms | no CDN |
| 28 | DreamPress | 726ms | static CDN |
| 29 | InterServer | 789ms | no CDN |
| 30 | SiteGround | 1,200ms | static CDN |
Every host under 200ms runs an edge-caching CDN. WP Engine leads at 65ms on Cloudflare Enterprise; Rocket.net (66ms) and GoDaddy Managed WordPress (75ms) also run Cloudflare edge, while WordPress.com (69ms) and Pressable (74ms) use their own in-house CDN. Templ at 167ms is the only Google Cloud CDN host in the pool. Bluehost (224ms) is the one static-CDN host inside the fastest band, and WPX Hosting (240ms) completes it on its own XDN edge infrastructure.
The 250–500ms band holds 16 hosts, most of them tested with no CDN at all. DreamHost, Cloudways and GreenGeeks at 385–386ms are doing what physics allows from a US origin. Liquid Web (349ms) and Hostinger Business (351ms) lead the static-CDN hosts. Kinsta at 477ms is the outlier: the slowest edge-caching host, and slower than three hosts with no CDN.
EasyWP (534ms) uses a static CDN yet trails its parent brand NameCheap (448ms), which was tested without one. SiteGround at 1,200ms is the only host above Google’s 800ms line, even though it was tested with its own CDN enabled; that is 18x slower than WP Engine, and visitors far from the US origin will feel that gap most. InterServer at 789ms sits just inside the line.
Takeaway: if most of your visitors are outside the US, an edge-caching host is the single largest global speed upgrade available. Otherwise, pick a data center near your audience; without a CDN, visitors far from that one location accept the latency.
 WP Engine
 WordPress.com
 Pressable
 Templ
Templ GoDaddy Managed WP
 Rocket.net
 Bluehost
 Liquid Web
 Cloudways
 ScalaHosting
 GreenGeeks
 NameCheap
 InMotion Hosting
 Hostinger
 DreamHost
 FastComet
 HostGator
 EasyWP
 Kinsta
 Ionos
Ionos ChemiCloud
 Hostinger Business
 HostArmada
 NameHero
 WPX
WPX GoDaddy
 Hosting.com
 SiteGround
 InterServer
New Entrants: Q4 2025 Early Data
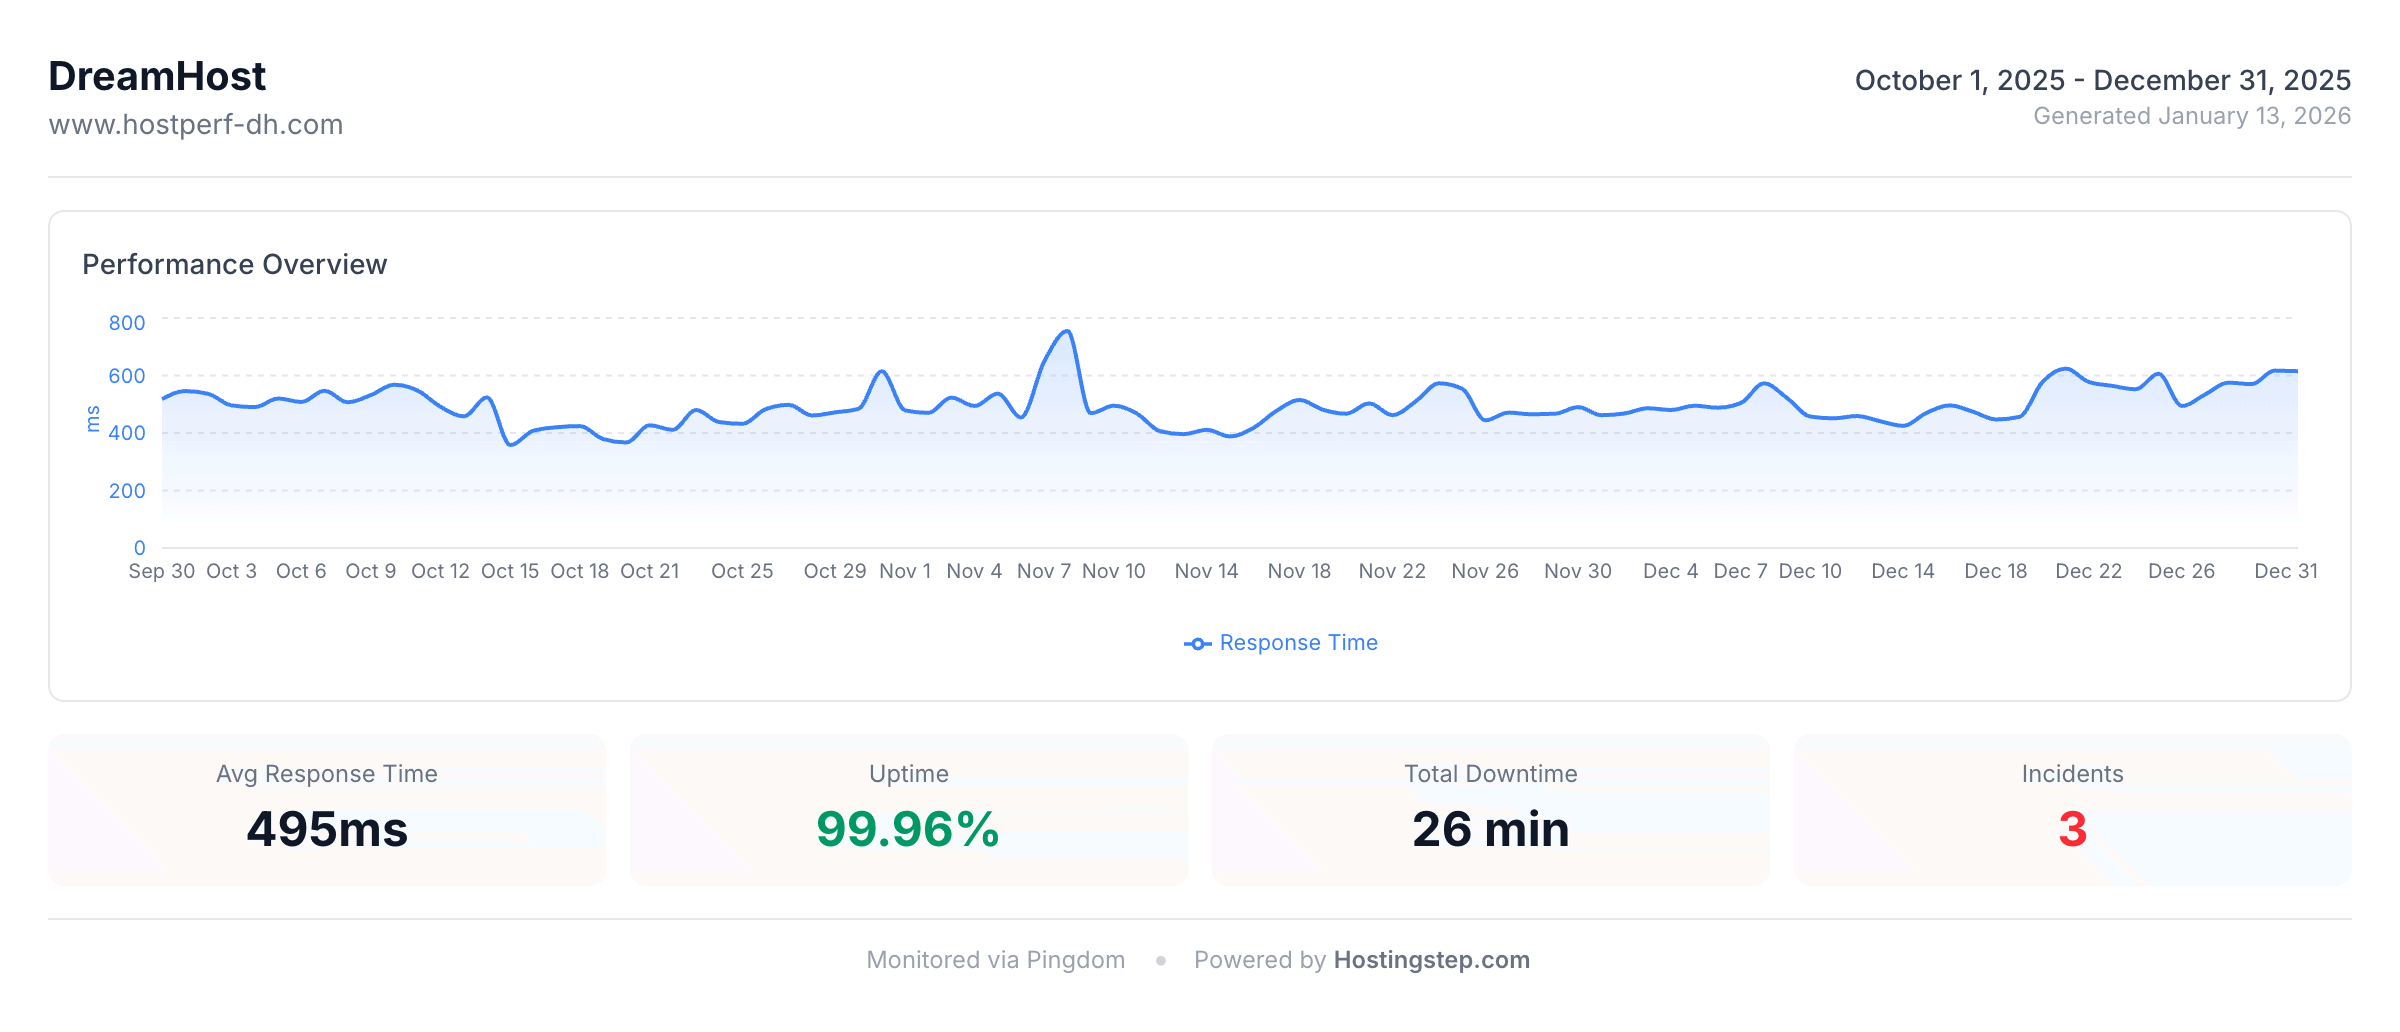
On October 1, 2025 we started monitoring 13 additional providers. Their load test, WPBench and global TTFB results appear in the charts above alongside the full-year hosts. TTFB and uptime below cover Q4 2025 only (October 1 – December 31, 92 days, 132,480 tests per host), so read them as an early signal; the full-year figures will appear in the 2027 report.
PressableWordPress.comGoDaddy Managed WPHostArmadaNameCheapInterserverScalaHostingHostinger BusinessEasyWPDreamHost (Shared)InMotionHostingIonosGoDaddy (Shared)PressableWordPress.comEasyWPInterserverGoDaddy (Shared)IonosInMotionHostingHostinger BusinessNameCheapGoDaddy Managed WPScalaHostingHostArmadaDreamHost (Shared)The table below collects all five tests for the new entrants. The early-signal grade uses the same percentile scale as the full-year report card; Ionos and GoDaddy Shared receive no grade because their load tests did not complete.
| Hosting | TTFB | Uptime | Downtime · outages | Load test | WPBench | Global TTFB | Early signal |
|---|---|---|---|---|---|---|---|
| Pressable | 341ms | 100.00% | 0 min · 0 | 12ms · 0% | 6.7/10 | 74ms | A+ |
| WordPress.com | 357ms | 100.00% | 0 min · 0 | 16ms · 0% | 6.8/10 | 69ms | A+ |
| GoDaddy Managed WP | 361ms | 99.98% | 24 min · 2 | 35ms · 0% | 3.8/10 | 75ms | B+ |
| HostArmada | 454ms | 99.97% | 28 min · 6 | 32ms · 0% | 5.1/10 | 402ms | B+ |
| NameCheap | 462ms | 99.98% | 21 min · 1 | 150ms · 0% | 5.0/10 | 448ms | D |
| Interserver | 462ms | 99.99% | 2 min · 2 | 80ms · 0% | 5.3/10 | 789ms | C |
| ScalaHosting | 465ms | 99.97% | 27 min · 15 | 48ms · 0% | 8.8/10 | 442ms | A |
| Hostinger Business | 478ms | 99.98% | 18 min · 4 | 31ms · 0% | 7.4/10 | 351ms | A |
| EasyWP | 490ms | 100.00% | 0 min · 0 | 110ms · 0% | 6.7/10 | 534ms | C |
| DreamHost (Shared) | 495ms | 99.96% | 26 min · 3 | 147ms · 0% | 6.1/10 | 385ms | B |
| InMotionHosting | 537ms | 99.99% | 9 min · 6 | 31ms · 0% | 7.4/10 | 390ms | B |
| Ionos | 545ms | 99.99% | 8 min · 4 | Did not complete · 65.4% errors | 7.2/10 | 480ms | n/a |
| GoDaddy (Shared) | 751ms | 99.99% | 4 min · 4 | Did not complete · 68.8% errors | 3.8/10 | 689ms | n/a |
Pressable (341ms), WordPress.com (357ms) and GoDaddy Managed WordPress (361ms) all post fastest-band TTFB and are the strongest challengers to WP Engine and Rocket.net once they have a full year of data. GoDaddy’s two products diverge sharply: its Managed WordPress is 2x faster than its shared hosting (751ms), two different infrastructure stacks under one brand.
Pressable, WordPress.com and EasyWP recorded 100% uptime for the quarter. Pressable and WordPress.com publish 100% and 99.999% SLAs respectively; EasyWP is the surprise, having averaged 99.96% in our 2022–23 monitoring. Every new entrant cleared the 99.9% line. The widest gap is ScalaHosting’s 15 outages in 92 days against a single outage for NameCheap.
Pressable and WordPress.com earn A+ in four of five tests and are positioned to join the A+ ranks in next year’s benchmarks if this holds. Hostinger Business and ScalaHosting grade A. GoDaddy Managed WordPress earns A+ in both TTFB tests, but its D in WPBench shows limited server resources behind the fast CDN.
 Pressable
 WordPress.com
 GoDaddy Managed WP
 HostArmada
 NameCheap
 InterServer
 ScalaHosting
 Hostinger Business
 EasyWP
 DreamHost
 InMotion Hosting
 Ionos
Ionos GoDaddy
 Pressable
 WordPress.com
 EasyWP
 InMotion Hosting
 InterServer
 Ionos
Ionos GoDaddy
 GoDaddy Managed WP
 Hostinger Business
 NameCheap
 ScalaHosting
 HostArmada
 DreamHost
Beyond the Benchmarks: Analysis
TTFB Range (Consistency)
Average TTFB tells you how fast a host typically responds; it does not tell you how predictable that is. A host averaging 450ms every day is more useful than one averaging 380ms that spikes to 1,500ms. TTFB range is the difference between a host’s highest and lowest daily-average TTFB across the year, calculated for the 17 full-year hosts.
WP EngineNameHeroGreenGeeksCloudwaysLiquid WebHostingerBluehostKinstaWPX HostingFastCometHosting.comRocket.netTemplDreamPressHostGatorSiteGroundChemiCloud| # | Hosting | Avg TTFB | Min TTFB | Max TTFB | Range |
|---|---|---|---|---|---|
| 1 | WP Engine | 365ms | 259ms | 503ms | 244ms |
| 2 | NameHero | 476ms | 393ms | 659ms | 266ms |
| 3 | GreenGeeks | 422ms | 340ms | 648ms | 308ms |
| 4 | Cloudways | 449ms | 352ms | 666ms | 314ms |
| 5 | Liquid Web | 497ms | 366ms | 703ms | 337ms |
| 6 | Hostinger | 483ms | 367ms | 799ms | 432ms |
| 7 | Bluehost | 532ms | 396ms | 855ms | 459ms |
| 8 | Kinsta | 459ms | 371ms | 938ms | 567ms |
| 9 | WPX Hosting | 411ms | 282ms | 872ms | 590ms |
| 10 | FastComet | 521ms | 390ms | 1,001ms | 611ms |
| 11 | Hosting.com | 470ms | 362ms | 981ms | 619ms |
| 12 | Rocket.net | 373ms | 270ms | 909ms | 639ms |
| 13 | Templ | 386ms | 282ms | 948ms | 666ms |
| 14 | DreamPress | 663ms | 454ms | 1,297ms | 843ms |
| 15 | HostGator | 580ms | 453ms | 1,763ms | 1,310ms |
| 16 | SiteGround | 632ms | 502ms | 2,121ms | 1,619ms |
| 17 | ChemiCloud | 528ms | 370ms | 2,043ms | 1,673ms |
WP Engine is the most consistent host in the pool: its slowest day (503ms) was less than double its fastest (259ms), and combined with a single outage it delivers the most predictable numbers in the industry. NameHero’s 266ms range is the second tightest, followed by GreenGeeks, Cloudways and Liquid Web, all under 350ms.
Rocket.net and Templ rank in the top three for average TTFB but show wider ranges (639ms and 666ms), so their fast average comes with more day-to-day variation. ChemiCloud’s worst day (2,043ms) was 5.5x its best (370ms); SiteGround (1,619ms range) and HostGator (1,310ms) tell similar stories of wide performance swings.
CDN Impact: How Much Does CDN Type Matter?
Grouping all 30 hosts by CDN type against their global TTFB shows where the advantage actually comes from.
Edge caching CDN 8 hosts: serves the complete HTML page from the nearest edge location. WP Engine, Rocket.net, Templ, Kinsta, WPX Hosting, Pressable, WordPress.com, GoDaddy Managed WP.
Static asset CDN 8 hosts: serves images, CSS and JS from the CDN, but HTML still routes to the origin. Bluehost, HostGator, DreamPress, EasyWP, Hostinger Business, Liquid Web, ScalaHosting, SiteGround.
Origin only 14 hosts: no CDN; every request routes to the origin server. Cloudways, DreamHost (Shared), GreenGeeks, Hosting.com, Hostinger, ChemiCloud, FastComet, NameHero, HostArmada, NameCheap, InMotionHosting, Interserver, Ionos, GoDaddy (Shared).
| CDN type | Avg global TTFB | Median | Range | Hosts |
|---|---|---|---|---|
| Edge caching | 154ms | 75ms | 65–477ms | 8 |
| Static asset CDN | 532ms | 435ms | 224–1,200ms | 8 |
| Origin only | 478ms | 426ms | 385–789ms | 14 |
Edge-caching hosts (154ms) are 3x faster than static-CDN (532ms) or no-CDN hosts (478ms). The more striking finding is that static-asset CDN hosts are no faster than origin-only hosts: on the median the two groups sit within 10ms of each other (435ms vs 426ms). Serving images and CSS from an edge location provides no measurable advantage when the HTML document itself still travels from the origin. The bottleneck is the HTML response, and only edge caching removes that round trip.
Cloudways (386ms), with no CDN, outperforms four of the eight static-CDN hosts: HostGator, EasyWP, ScalaHosting and SiteGround. GreenGeeks (386ms), also with no CDN, is 3x faster than SiteGround’s static CDN (1,200ms) and slightly faster than HostGator’s (427ms). Even among edge-caching hosts the spread is wide: Kinsta (477ms) trails both GreenGeeks and Cloudways despite running Cloudflare edge infrastructure. Architecture sets the ceiling; implementation quality and origin performance decide where each host lands beneath it.
Takeaway for site owners: if your site serves visitors outside your data center region, an edge-caching CDN is the highest-impact upgrade you can make. On the group averages, a host like HostGator could gain roughly 270ms by moving from a static-asset CDN to edge caching. A static-asset CDN, despite the marketing around it, does not produce faster global page loads than having no CDN at all.
Shared vs Managed WordPress Hosting
Nine shared and eight managed WordPress hosts were tested for the full year. Managed: WP Engine, Rocket.net, Templ, WPX Hosting, Kinsta, Cloudways, DreamPress, Liquid Web. Shared: GreenGeeks, Hosting.com, Hostinger, Bluehost, SiteGround, ChemiCloud, FastComet, NameHero, HostGator.
| Metric | Managed WordPress (8) | Shared hosting (9) | Gap |
|---|---|---|---|
| Average TTFB | 450ms | 516ms | Shared is 66ms slower (14.7%) |
| Average uptime | 99.9873% | 99.9306% | 67 min vs 365 min of downtime a year |
| Average outages/year | 5.9 | 35.0 | Shared hosts see 6x more outages |
| Typical price | $15–35/month | $2.95–5/month | Managed costs 5–10x more |
The TTFB gap between managed and shared hosting is just 66ms. The real gap is reliability: shared hosts averaged 35 outages a year against 5.9 for managed, and outage frequency is what decides how often your site is interrupted. GreenGeeks at $2.95/month, with 422ms TTFB and a 26ms load test, outperforms several managed hosts costing $25–30 a month on speed alone.
When managed hosting is justified: e-commerce, critical business sites and news publishers, where downtime costs revenue and the 6x reliability gap pays for itself. When shared hosting delivers: blogs, small business sites and content sites, where the top shared hosts give 85–90% of managed speed at 80% lower cost. The data does not support “managed is always better”; it supports “managed is more stable, and the premium is worth paying when downtime costs you money.”
WordPress Hosting Performance Stats 2026
All Tested WordPress Hosting Providers
Every host in one place. Each card shows the five headline figures; open a card for our reading of the numbers and a link to the full review.
WP EngineA+WP Engine reclaims #1 in TTFB for the first time since our monitoring began in 2020, and records the tightest year-long consistency of any host (244ms range) alongside the fastest global TTFB (65ms) and a 27ms load test. The one gap is server-side resource allocation, with a WPBench score of 6.5; benchmark before committing a plugin-heavy WooCommerce site.
See our full WP Engine reviewTemplA+Templ is the most consistent performer year over year and the only host in our pool running Google Cloud, Google CDN and Google DNS together. A 167ms global TTFB and a 7.5 WPBench score on a $15 plan are strong; the 58ms load test trails Pressable and WP Engine.
See our full Templ reviewGreenGeeksA+GreenGeeks is the best-balanced shared host in the report card, with no failing grade in any test and a 26ms load-test response that beats every other shared host we have tested in five years. The trade-off is outage frequency: 21 outages (138 minutes) across the year, and a 5.0 WPBench score on the Lite plan we tested.
See our full GreenGeeks reviewKinstaAKinsta holds the highest WPBench score of any managed WordPress host (8.8) for the fifth consecutive year and handles load at 40ms with zero errors. Its two weak spots are a 477ms global TTFB, slow for an edge-caching host, and 149 minutes of downtime tied to the 2025 Cloudflare outages.
See our full Kinsta reviewLiquid WebALiquid Web is the most predictable host in our five-year dataset, with a TTFB standard deviation of just 28.6ms from 2021 to 2025. Load handling (60ms), uptime and WPBench (7.2) are equally steady, and a 349ms global TTFB is a respectable result for a static CDN.
See our full Liquid Web reviewHostingerB+Hostinger recorded just 33 minutes of downtime in 2025, the best uptime of any shared host we benchmarked, and the highest shared-host WPBench score at 7.4. The 245ms load test is the trade-off: the Premium plan we tested has no CDN, while the Hostinger Business plan with Hostinger CDN handled the same test at 31ms.
See our full Hostinger reviewBluehostB+Bluehost’s 2025 numbers split into pre- and post-Oracle Cloud migration. After we moved the test site in Q4 2025 it recorded its first 100% uptime quarter in five years of testing and the pool’s highest WPBench score (9.6), while Cloudflare CDN brought global TTFB down to 224ms. The 532ms origin TTFB blends old and new infrastructure; the July 9, 2026 load retest completed at 41ms with 0% errors.
See our full Bluehost reviewWPX HostingB+WPX Hosting delivers a 240ms global TTFB through its own XDN edge caching, with near-perfect uptime (16 minutes of downtime) and a TTFB that has stayed consistent across the years. The first Loader.io run was blocked by WPX security; a July 8, 2026 retest completed at 45ms with 0% errors.
See our full WPX Hosting reviewCloudwaysBCloudways recorded just 12 minutes of downtime in 2025, the second-best uptime in the pool, and its TTFB has stayed within a narrow band for five years. The 282ms load test and 4.7 WPBench score both declined from previous years and are why it grades B rather than A.
See our full Cloudways reviewHosting.comBHosting.com (formerly A2 Hosting) improved its WPBench score from 3.4 to 5.5 after moving to its new data centers and handles load at 43ms. Uptime was its weakest metric, with 49 outages totaling 301 minutes, and a 642ms global TTFB reflects origin-only delivery.
See our full Hosting.com reviewFastCometCFastComet handles load at 78ms with zero errors, but uptime is a concern: 39 outages in 2025 and a worst single-day uptime of 82.29%. Its TTFB has climbed from 326ms in 2022 to 521ms in 2025, and a 4.8 WPBench score sits below similarly priced competitors.
See our full FastComet reviewSiteGroundCSiteGround allocates the second-highest server resources of any shared host (WPBench 8.4), but most other metrics rank near the bottom. Its 1,200ms global TTFB is the slowest of all 30 hosts even with its own CDN enabled, TTFB has regressed from 403ms in 2022 to 632ms, and 44 outages were recorded in 2025.
See our full SiteGround reviewDreamPressCDreamPress recorded its weakest results since our monitoring began. TTFB regressed from 437ms in 2024 to 663ms, the slowest full-year host; the 221ms load test is the slowest of any managed host; and a 726ms global TTFB sits in the slower-than-most band despite a static CDN. DreamHost’s own shared plan is faster on every speed metric at a fraction of the price.
See our full DreamPress reviewChemiCloudDChemiCloud recorded 99.7559% uptime in 2025, below its own 99.99% SLA, with 67 outages and over 21 hours of downtime, the most in the pool. The load test averaged 1,068ms with a 4.2% error rate. Two positives: a 460ms global TTFB without a CDN, and a WPBench improvement from 3.5 to 6.1 after its server upgrade.
See our full ChemiCloud reviewNameHeroDNameHero delivers the second-tightest TTFB consistency in the pool (266ms range), so day-to-day response times are predictable. Reliability is the larger factor: 51 outages totaling 322 minutes in 2025. The load test reached a connection ceiling at around 80 concurrent users, averaging 257ms for completed requests with a 56% error rate, and the 3.7 WPBench score reflects limited resource allocation on the Starter Cloud plan.
See our full NameHero reviewHostGatorFHostGator’s Oracle Cloud migration produced a clear improvement: TTFB dropped from 789ms to 580ms (26.5%) and WPBench jumped from 4.3 to 9.6. Reliability did not follow: 470 minutes of downtime, a worst day at 79.38% uptime, and a load test that spiked to 10,002ms under full load before settling at 213ms with 2.0% errors.
See our full HostGator reviewRocket.netRocket.net has posted fastest-band TTFB for five consecutive years, the only host in our benchmarks with that record, and its 66ms global TTFB is the second fastest of all 30 hosts. Uptime is near perfect at two outages and WPBench stands at 7.5. TTFB has climbed gradually from 266ms in 2021 to 373ms in 2025, and the load test could not run because Cloudflare Enterprise blocked the test client.
See our full Rocket.net reviewPressableQ4 2025 dataPressable recorded the fastest load-test response in the entire 2026 benchmarks (12ms), 100% uptime across Q4 2025, and a 74ms global TTFB on its own CDN and DNS infrastructure rather than Cloudflare. WPBench of 6.7 sits mid-pack; the full-year data will show whether these speeds hold.
See our full Pressable reviewWordPress.comQ4 2025 dataWordPress.com shares Pressable’s infrastructure and delivered a 69ms global TTFB (third fastest of 30 hosts), a 16ms load test and 100% Q4 uptime. The plan costs $2.75 per month and renews at the same price.
See our full WordPress.com reviewGoDaddy Managed WPQ4 2025 dataGoDaddy Managed WordPress posted a 75ms global TTFB (fifth fastest of 30), a 35ms load test with zero errors and 99.98% uptime. Its 3.8 WPBench score shows the speed comes from the edge-caching CDN rather than server resources.
See our full GoDaddy Managed WP reviewGoDaddy (Shared)Q4 2025 dataGoDaddy’s shared plan produced very different results from its managed product: 751ms TTFB, a load test that did not complete (68.8% errors) and a 689ms global TTFB. Uptime of 99.99% was the one strong result.
HostArmadaQ4 2025 dataHostArmada is one of the most promising new entrants: the tightest TTFB range of the Q4 hosts (204ms), a 32ms load test with zero errors and a 402ms global TTFB with no CDN. WPBench of 5.1 sits in the fewer-than-most band, and 6 outages (28 minutes) in the quarter is adequate.
See our full HostArmada reviewHostinger BusinessQ4 2025 dataHostinger Business shows what a CDN changes within one brand: the same 7.4 WPBench score as the Premium plan, but a 31ms load test instead of 245ms and a 351ms global TTFB on Hostinger CDN.
See our full Hostinger Business reviewInMotionHostingQ4 2025 dataInMotionHosting posted a 7.4 WPBench score, a 31ms load test with zero errors, 99.99% uptime and a 390ms global TTFB with no CDN. The 537ms origin TTFB is the one mid-pack result.
InterserverQ4 2025 dataInterServer recorded just 2 minutes of downtime across the 92-day window, among the best of the Q4 hosts, with a 462ms TTFB and an 80ms load test. The 789ms global TTFB is the trade-off, sitting just inside Google’s 800ms line.
IonosQ4 2025 dataIonos allocates competitive resources (WPBench 7.2), held 99.99% uptime and posted a 480ms global TTFB. The load test did not complete, stopping at a 65.4% error rate within the first 30 seconds.
NameCheapQ4 2025 dataNameCheap delivered a predictable 462ms TTFB with a single outage in Q4 2025 and a 448ms global TTFB with no CDN. The 150ms load test and 5.0 WPBench score are mid-pack: the Stellar plan handles traffic but is not tuned for speed.
ScalaHostingQ4 2025 dataScalaHosting posted an 8.8 WPBench score, the highest of any shared host apart from Bluehost and HostGator, and a 48ms load test with zero errors. Consistency is the question: TTFB spiked to 1,195ms on its worst day, and 15 outages in 92 days is elevated.
See our full ScalaHosting reviewEasyWPQ4 2025 dataEasyWP recorded 100% uptime in Q4 2025 and the second-tightest TTFB range among the new entrants (243ms). A July 14, 2026 retest completed the load test at 110ms with 0% errors, and the 534ms global TTFB sits mid-pack despite a static CDN.
See our full EasyWP reviewDreamHost (Shared)Q4 2025 dataDreamHost’s shared plan beats its own managed DreamPress product on TTFB (495ms vs 663ms), global TTFB (385ms vs 726ms) and load handling (147ms vs 221ms) at a fraction of the price, with three outages in the quarter.
Retests, Corrections and Changelog
Any hosting provider can report a configuration error or request a retest of any point-in-time test on this page. Retests run under the identical conditions described in each section and are published here with a dated entry.
September 2, 2026: Report restructured for readability. Key findings and the report card moved to the top; tier-badge lists removed from every test (the chart legend carries the bands); ten per-chart “how to read” boxes consolidated into the How We Tested section; Q4 2025 entrants consolidated into one section with a combined table; provider cards collapsed by default. Data corrections: load-test table re-sorted with ChemiCloud added to the chart; DreamPress added to the global TTFB table; DreamPress 2024 TTFB corrected to 437ms; InterServer Q4 TTFB aligned to 462ms.
September 2026: Scoring standard v2.1 applied: labels describe position in the tested pool; Google’s 800ms TTFB threshold and the 99.9% SLA line are drawn on every chart where they apply; “Did not complete” replaces “Failed” for load tests that stopped at the tool’s error threshold. Report-card overall grades recomputed as the average of the five test grades.
July 14, 2026: EasyWP load test retested: 110ms, 0% errors.
July 9, 2026: Bluehost load test retested after the December 2025 run was blocked by their security layer: 41ms, 0% errors.
July 8, 2026: WPX Hosting load test retested after the first run was blocked by WPX security: 45ms, 0% errors.
This HostingStep benchmark report is generated from 365 days of performance data collected for the main cohort (January 1 – December 31, 2025); newly added providers are tested with Q4 2025 data only. All hosting accounts are independently purchased by HostingStep and the invoices can be verified from this link. For methodology details, visit our Methodology page. For quarterly performance updates, check our Best WordPress Hosting roundup.