Our Verdict: NameHero’s Starter Cloud plan is a capable budget host for most common kinds of websites, like a blog or business website that receives low to moderate traffic. It offers a strong response time to deliver web pages faster to visitors and also offers decent load handling capabilities. However, reliability is a concern with a lot of shorter downtimes and the real server resources are not adequate for running established sites with regular daily operations.
Note: This review is based on our testing of NameHero’s Starter Cloud plan. The performance figures are measured data; the recommendations reflect our editorial assessment of those results. Unless stated otherwise, everything here applies to the Starter Cloud plan while other NameHero plans may produce different benchmark results.
For our review, we purchased their base “Starter Cloud” plan for testing in 2022 and started monitoring its performance 24/7, 365 days a year. We have collected over 6 years of performance data and right now, we are taking the last 8 months of performance data from October 1, 2025 – May 31, 2026 for performance analysis.
NameHero Performance Review:
TTFB Response Time (lower is better)
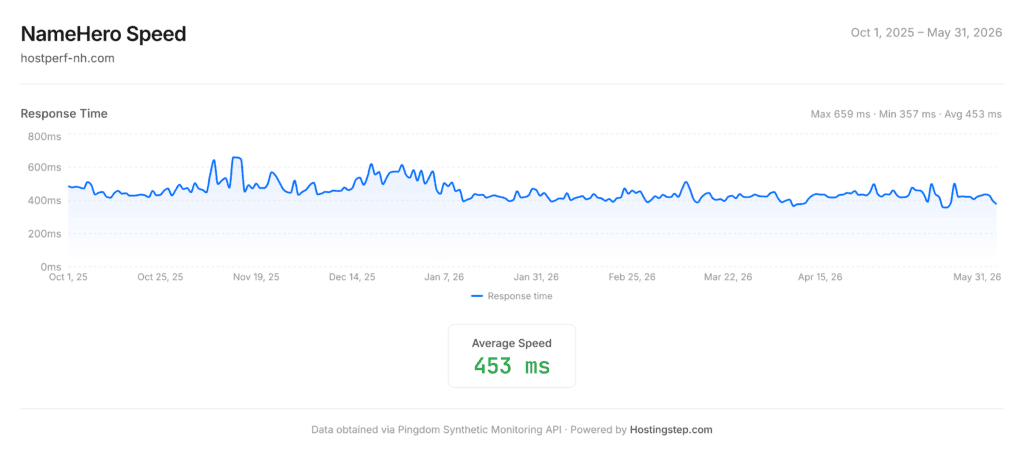
NameHero records a strong response time in our last 8-month test window. Our scoring band ranks hosts with a 400- 500 ms score as “Strong,” and NameHero has been consistently hitting this range for years. The lowest and highest response times during this period are 357ms and 659ms, respectively. The range was tightest, which means the response time is consistent with no high ups or downs.
The response time graph shows above 450ms throughout Q4 2025, but after January 11, 2026, the response time got faster, with below 450ms for most of the months until our testing period of May 31, 2026. This is a good improvement on the NameHero part, as we never touched our test site for any kind of optimization. If the trend continues, NameHero can move into ~400ms response time range in coming months.
Getting a faster response time is most important for your business’s web presence, as visitors, search engines, and AI agents require a faster response time to handle the page information faster and NameHero is well-positioned to offer faster response times.
Uptime (Higher is better)
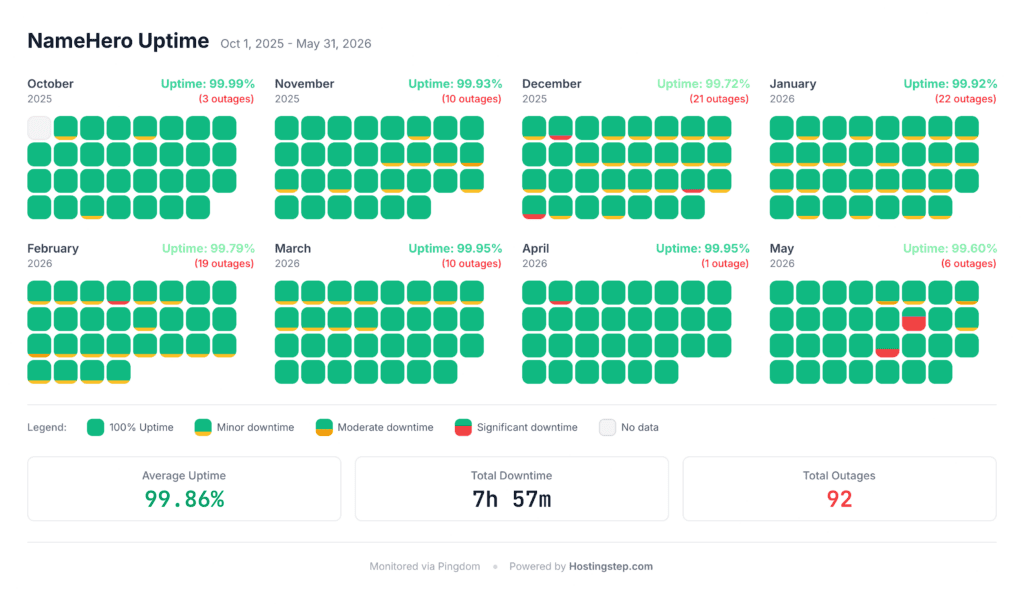
NameHero records below-average performance in uptime tests. It recorded an average uptime of 99.86% during our last 8-month test window. In numbers, it translates to 92 total outages with 7 hours 57 minutes of downtime recorded. Remember, our uptime percentage is based on the NameHero starter cloud plan, which we tested and the higher plans might have better uptime ranges.
In our testing window, the host achieved 99.99% in October, November, January, March, and April, whereas December, February, and May recorded 99.72%, 99.79%, and 99.60%, respectively. The lowest uptime recorded in a single day is 93.60%, which translates to 2 hours 55 minutes of downtime. Such short downtimes are common in shared hosting services, particularly on base plans, although many hosts offer 99.999% uptime on those plans. Most of the outages happen for a short time, typically within 5 minutes, as servers become temporarily unavailable. So, if you are running a simple site, these short outages won’t matter much, but for business websites, choosing a top-tier NameHero plan is highly recommended.
Load Handling (lower is better)
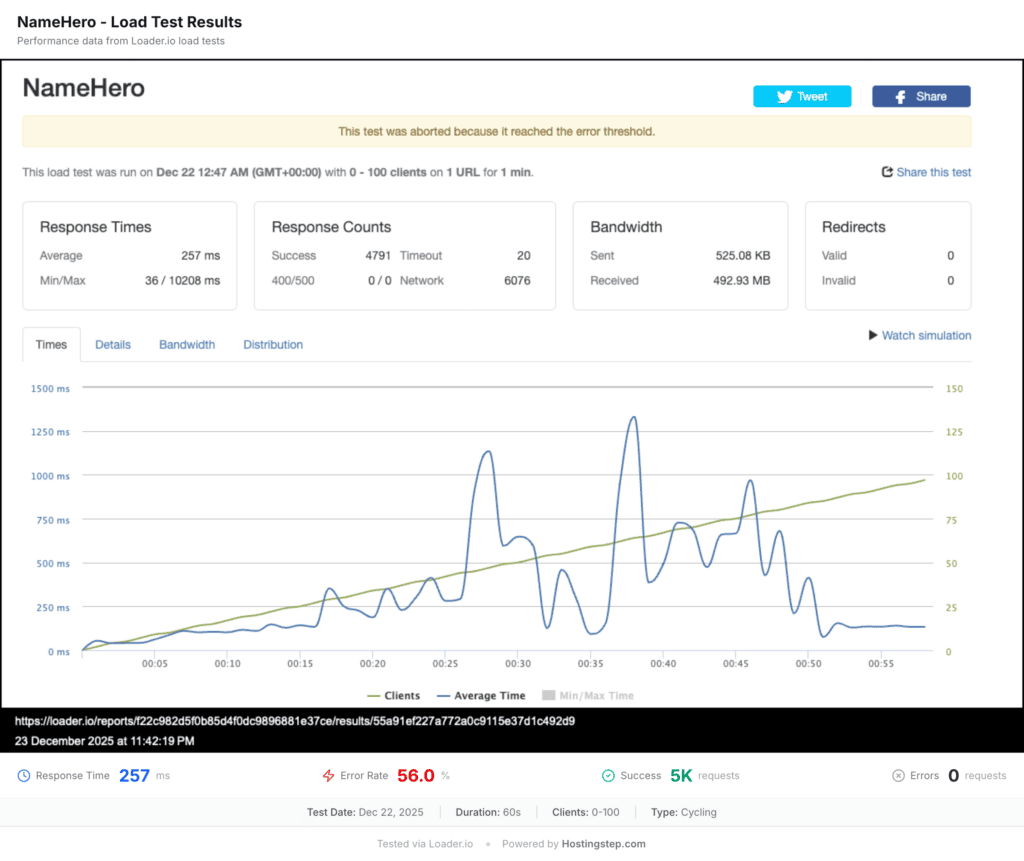
NameHero records a mixed response in load handling. It recorded an average score of 257ms with timeout and network errors. In this test, we send 0-100 visitors to the test site for 60 seconds to find the response time. The ideal way is for the host to handle this visitor load with the lowest possible response time. By doing so, the 0-100 visitors will see the webpage faster without seeing a loading screen.
The test started well with low response time taken for requests but the site turned volatile at around 45 concurrent visitors, where response time started increasing. When 80 concurrent users hit the server, the network error started appearing from near-zero to dominate the test and the successful responses collapsed. The network error appeared only in the last 10 seconds, which is a good sign as it’s not widespread throughout our testing time.
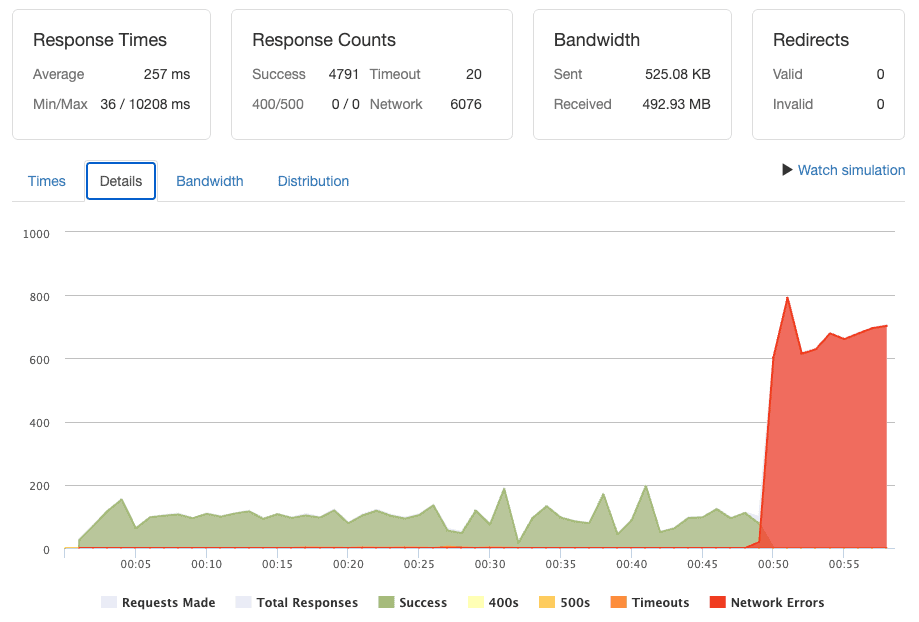
What does the test indicate? NameHero maintained a low response time under low concurrent loads, and even at a moderate traffic surge of up to 80 simultaneous visitors, the server kept handling the load, but beyond that, it broke down. Note: this is a synthetic test with 0-100 visitors who are bots and not real visitors. In a real-world scenario, NameHero might be able to handle 100 concurrent users without any issues or might not handle the load at all, as there are several factors associated like NameHero’s server load, visitor types, geographical locations, etc. For businesses expecting regular traffic spikes, it’s good to use Turbo or the Business Cloud plan instead of Starter Cloud.
Server Hardware Test (Higher is better)
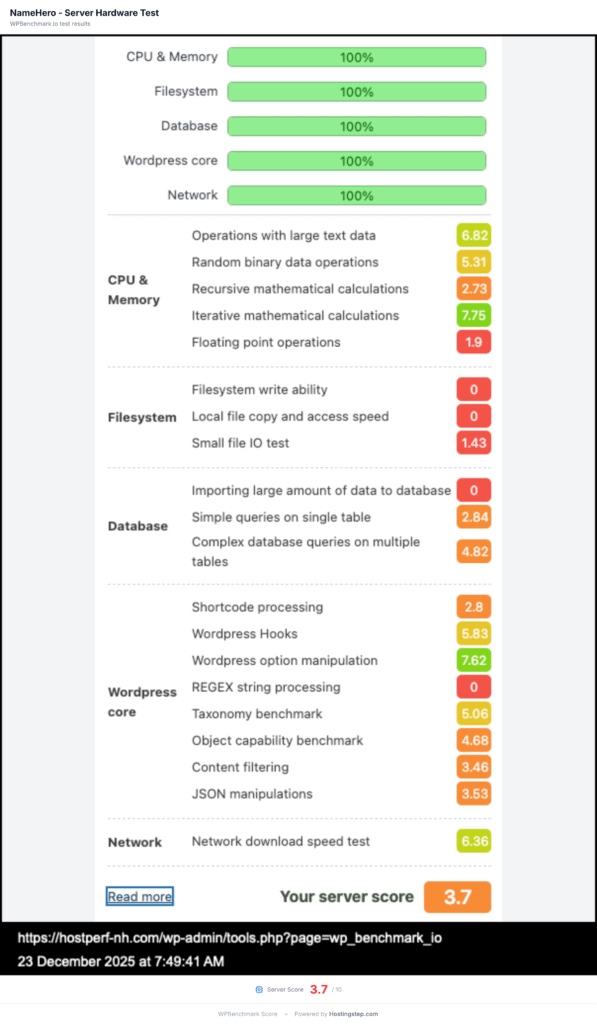
NameHero records below average in server hardware tests. It scored 3.7/10 in our benchmarks, one of the lowest among hosts we’ve recorded. The test is made using the Benchmark plugin, which runs 21 individual tests across 5 categories like CPU compute, Memory, Filesystem I/O, database performance, and WordPress core operations. This is one of the crucial tests as it measures the real resources allocated to your account, instead of the theoretical resources that were mentioned on the host’s sales page.
Our test shows that the 3.7 score is not uniformly distributed across all tests; instead, it comes from fixed tests. The CPU and Memory performance sits at mid-performance in the range of 1.9 – 7.75 out of 10. The worst performance happens in file system tests, where file system write and file-copy operations bottom out on the benchmark. The scores reflect the real resources allocated to the account.
What does the data show? A regular cached blog reads from cache and it rarely touches the disk writes, so the score doesn’t matter here. Instead, if you are doing heavy operations like media upload, plugin installs, imports, etc, then the site might feel slow. As we’ve tested only their starter plan, it’s not enough to handle big operations, but for most common blogs, the scores don’t matter much.
Global TTFB Test (lower is better)
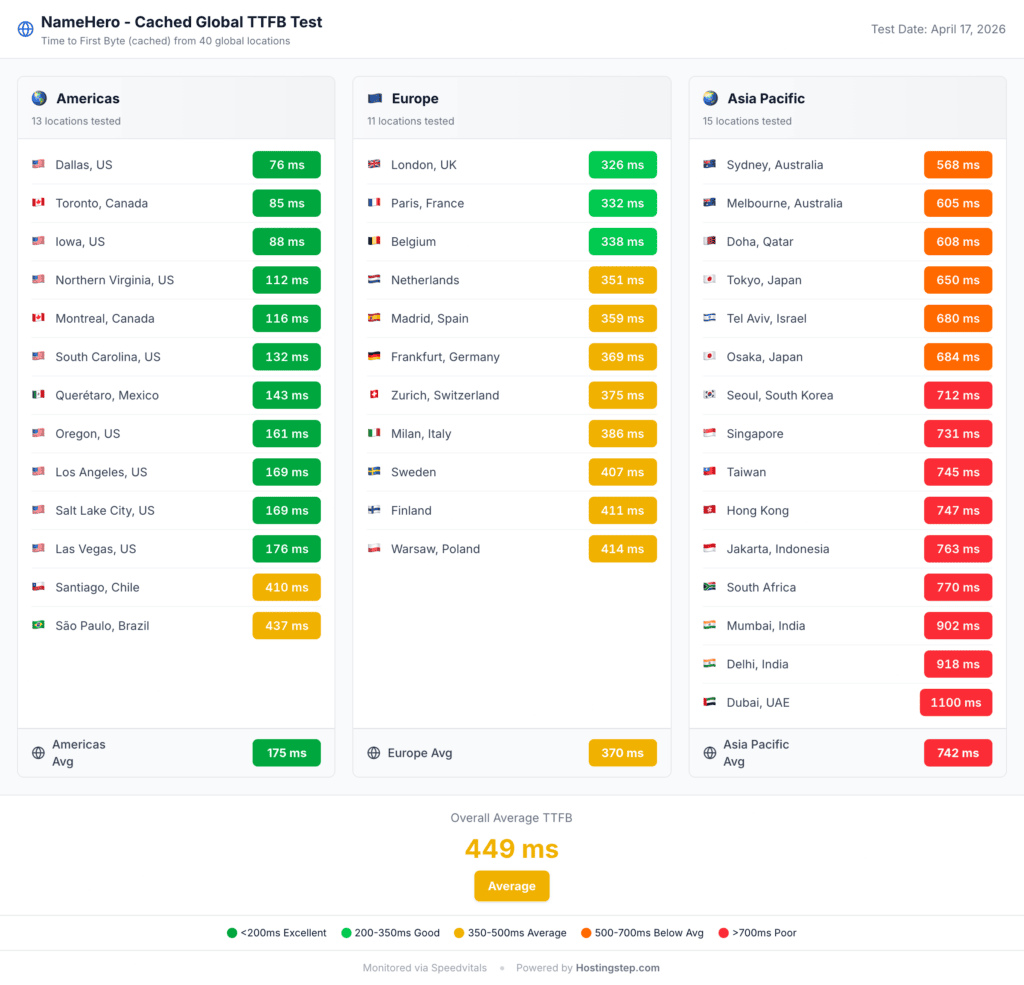
NameHero records an average in our Global TTFB test. It has recorded an average global TTFB of 448ms. Here, the test site is pinged from 40 international locations to measure the global TTFB response time. The test data gives a clear idea of how the NameHero servers deliver the webpages for global visitors. If your site gets visitors globally, watch out for results.
Though our band shows NameHero as an average performer with a score of 448ms, the single number might be misleading, as the global performance of NameHero is sharply split by regions.
| Region | Avg cached TTFB | Read |
| Americas (13 cities) | 175 ms | Excellent |
| Europe (11 cities) | 370 ms | Fair |
| Asia-Pacific (15 cities) | 742 ms | Poor |
Our test site on NameHero is hosted on its US datacenters and it is evident from the excellent TTFB at 13 American regions. It was led by Dallas (76ms), Toronto (85ms) and Iowa (88ms). In the European region, the score is fair in most of Western Europe, like London (326ms), Paris (332ms), and Belgium (338ms), whereas the east drifts into the low 400ms range.
However, in Asia-Pacific, the global TTFB is poor at a regional average of 742ms. Every city tested from these regions has a response time above 500 ms, with Dubai (1,100 ms), Delhi (918 ms), and Mumbai (902 ms) at the bottom. This is due to the difference between the origin data center location and the farthest location having a higher response time, though some hosts kill it with faster TTFB even in these regions with an origin DC present in the USA.
What does this indicate? If your site receives more than 50% of the traffic from Europe or Asia-Pacific, then it’s wise to choose NameHero’s London datacenter for better balance or even their India DC, if you have more than 50% of visitors in the Asia-Pacific region. In the case of most visitors from the USA, it’s fine to go with their US data center itself as an ideal choice.
NameHero vs Competitors
| Metric | NameHero | Hostinger | Bluehost | SiteGround |
| TTFB (US) | 453 ms | 447 ms | 498 ms | 745 ms |
| Uptime | 99.86% | 99.98% | 99.97% | 99.96% |
| Outages (8 mo) | 92 | 11 | 10 | 29 |
| Load Test | 257 ms / 56% | 245 ms / 0% | 131 ms / ~0% | 170 ms / 0% |
| Global TTFB (cached) | 448 ms | 404 ms | 224 ms | 1,200 ms |
| WPBench | 3.7 | 7.4 | 9.6 | 8.4 |
| CDN | None | None | Static | Static (Add-on) |
| Included | Add-on | Add-on | Included | |
| Backups | Weekly | Daily | Weekly | Daily |
| Intro Price | $3.58/mo | $2.69/mo | $1.99/mo | $3.99/mo |
NameHero is compared with its top 3 competitors, Hostinger, Bluehost, and SiteGround (based on Google autosuggestions). We have tested all the corresponding hosts’ base plans, starting with NameHero- Starter Cloud, Hostinger – Premium, Bluehost – Starter, and SiteGround – Startup. All the test sites are hosted in the USA data center of the respective hosts for a fair performance comparison. Each of the plans starts and renews at similar prices. We have considered the exact 8 months of performance data of the hosts for comparison from October 1, 2025, to May 31, 2026.
Summary: NameHero and Hostinger top in response time speed (~6ms difference is negligible) with Bluehost (498ms), whereas SiteGround is super slow at 745ms. In Uptime, NameHero is the only host that needs improvement (99.86%), where the rest of the hosts are well within their uptime SLA (99.9%). In Load handling, NameHero and Hostinger score very similarly, but Hostinger handled the load without any errors, whereas NameHero had network outages in the last 10 seconds of our 60-second testing time period.
Bluehost wins by a margin in the Global TTFB test, thanks to their integrated CDN, which offers faster global response times. WPBench again, NameHero bottoms out with poor performance, whereas similarly priced hosts offer better server resources. NameHero and SiteGround are the only hosts that come with email integrated. The intro price is very similar to Bluehost, which starts at the lowest price of $1.99/month, and it also provides the lowest renewal price of $8.99/month.
Who Should Use NameHero (Based on Starter Cloud plan)
If you are running a simple website or blog or small business where you are creating a website simply to put your business online, NameHero is for you. It comes with the traditional cPanel setup and LiteSpeed for easier caching configuration. It is best suited for US-focused, low to moderate traffic websites. The US response time is 453ms faster, and can deliver your website pages to visitors without any issues.
The bundled email feature itself gives you value if you plan to use it, as SiteGround is the only competitor to offer email, but its TTFB speed is slower.
Who Should Not Use NameHero (Based on Starter Cloud Plan)
If you are running an already established site where traffic spikes occur frequently or if you can’t afford to lose customers due to shorter downtimes, then NameHero Starter Cloud Plan is not for you. In this case, you can sign up for higher plans of NameHero or other hosts with reliable uptime.
Also, if you are running a media-heavy, plugin-heavy, or workload-heavy backend website, the starter cloud plan is not suitable in any case due to poor WPBench performance. It’s ideal to choose a higher plan or choose a host with the high WPBench score.
If the constraints rule out NameHero for you, Bluehost is the closest alternative to get started at the lowest introductory as well as renewal price. Its response time is ~50ms slower than NameHero’s, but it outperforms NameHero in every other metric like uptime, load handling, server hardware, and global TTFB performance. However, it doesn’t include email hosting, which you should watch out for.
Methodology
We purchase the base hosting plans from popular hosting providers and test/monitor their performance 24/7, 365 days a year. We’ve been continuously testing over 34 web hosting providers, starting with the cheapest web hosting and ending with premium Managed WordPress hosting services. We install a standardized WordPress site (same WordPress theme, set of WordPress plugins, and same PHP version) on all our test sites, including NameHero, for fair comparison, to understand how the servers perform under a common setup.
We use the Pingdom Synthetic monitoring tool to measure the response time and uptime performance, where the test site is set to record the score once every 60 seconds. As a result, we perform 525,600 tests a year to measure the average response time and Uptime. We use the Loader.io tool to send 0-100 concurrent visitors to the site to measure load handling performance. We use SpeedVitals to test the site from 40 international locations to measure the global TTFB.