WordPress Hosting Benchmark Methodology
At Hostingstep, we buy our hosting accounts, deploy a test site, and measure their performance. We have created a page listing all our invoices for your reference.
All the test sites come with a standard test bench setup with the following configurations:
- Twenty Twenty-Four WordPress theme
- Akismet, Contact Form 7, Rank Math WordPress plugins
- PHP 8.1
- Server-side caching on all sites. The WP Fastest Cache plugin is installed to enable caching if not available.
We strive to improve the benchmarks every few months. We will notify you of any changes on our Changelog page.
Test 1: TTFB
Configuration:
- Test Frequency: 60-second interval
- Monitoring Locations: 22 points across USA
- Timeout threshold: 30 seconds
- Test Type: HTTPS
- SSL/TSL: Enabled
- Test Duration: 365 days
- Total Tests/Month: 43,800
- Annual Tests: 525,600
Metrics Collected:
- Response Time Metrics (Min/Max/Average TTFB)
- Uptime Metrics (Total Downtime/outages/Average Uptime)
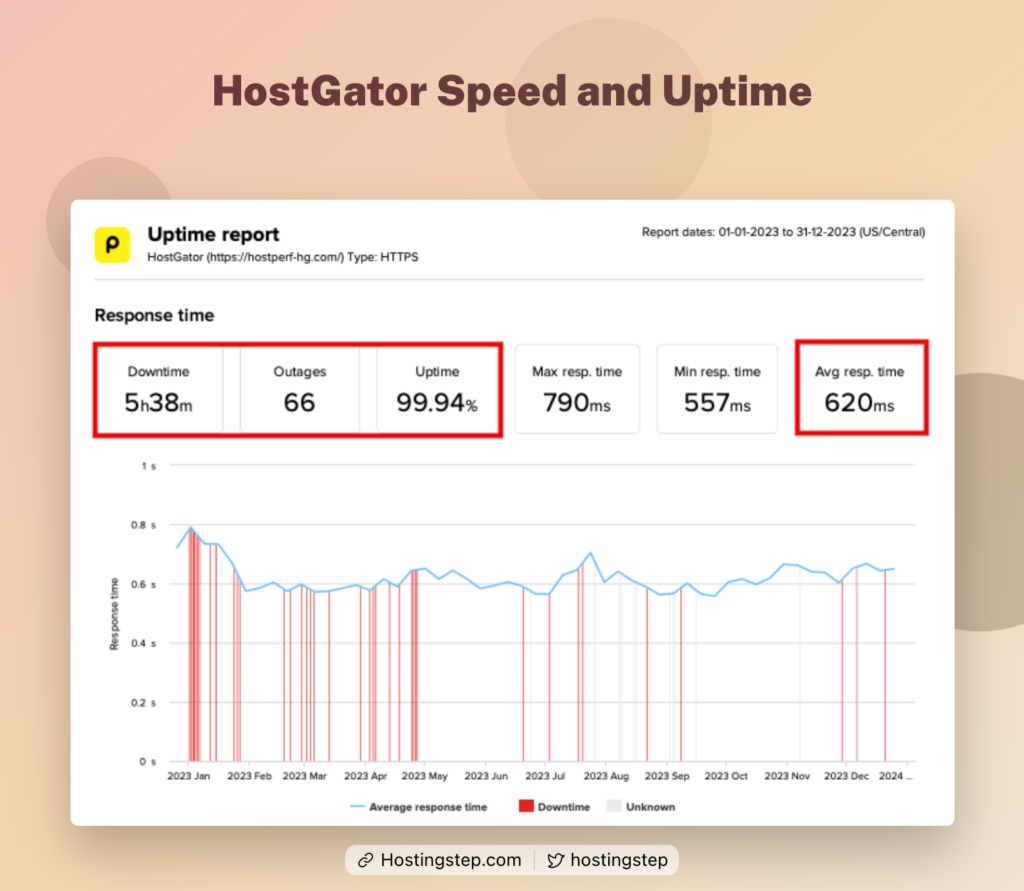
Test 2: Uptime
Uptime is another crucial metric for evaluating a hosting provider. Using the fastest hosting provider, which comes with poor uptime, is meaningless.
Our uptime test is done through the same Pingdom Sytenthic Monitoring tool from the same regions every 60 seconds once.
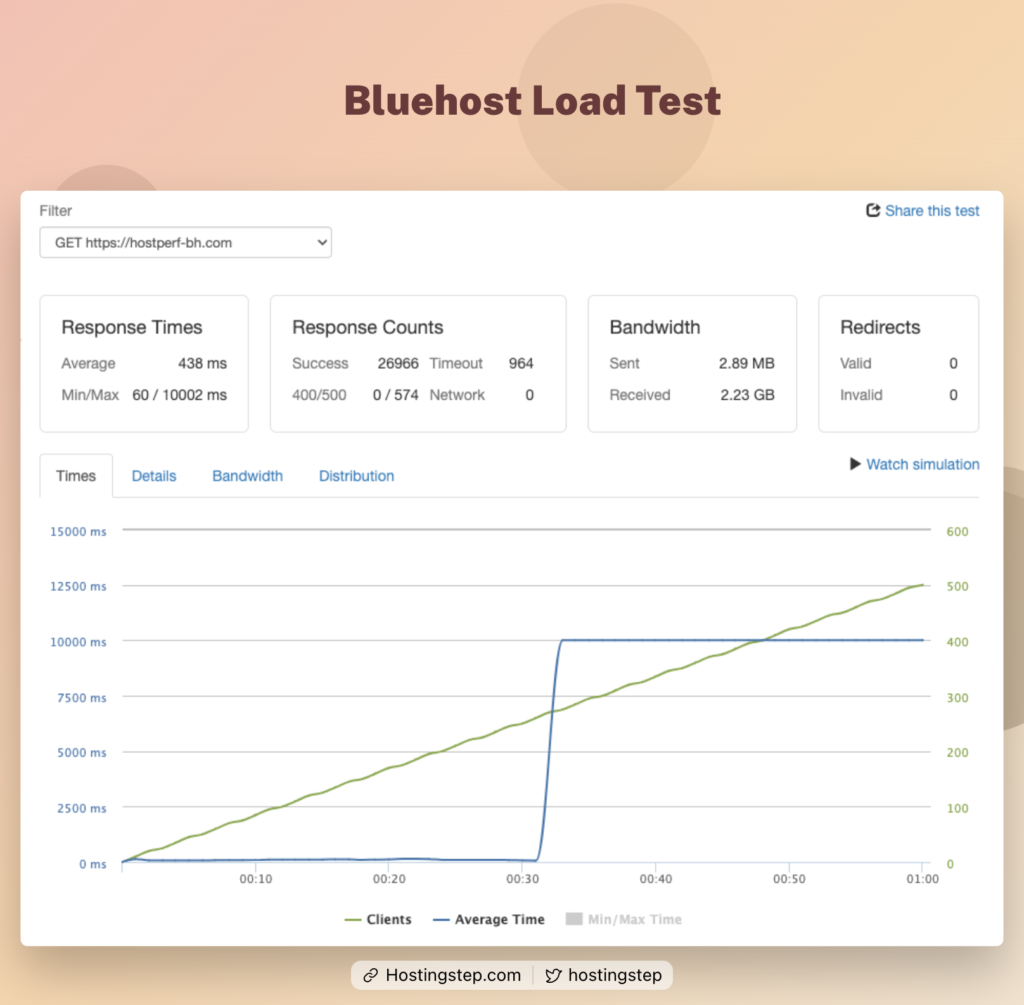
Test 3: Load Test (Loader.io)
Test Configuration:
- Virtual users: 0-100 concurrent visitors
- Duration: 1 minute
- Test Type: Maintain Client Load
- Method: GET
- Protocol: HTTPS
Performance Metrics Measured:
- Response time (Average / Min / Max)
- Response Counts (success / Timeout / 400/500 / Network errors)
Test 4: WPBenchmark
Server Tests Conducted:
- CPU and Memory
- Filesystem
- Database
- Network
Scoring System:
- Scale: 0-10
- Categories: CPU, Memory, Filesystem, Database.
WPBenchmark WordPress plugin performs a series of hardware tests, including CPU & Memory, network, and database tests to evaluate the hardware performance of the server. We set a standard PHP version across all the test sites to bring accurate hardware performance of hosting providers.
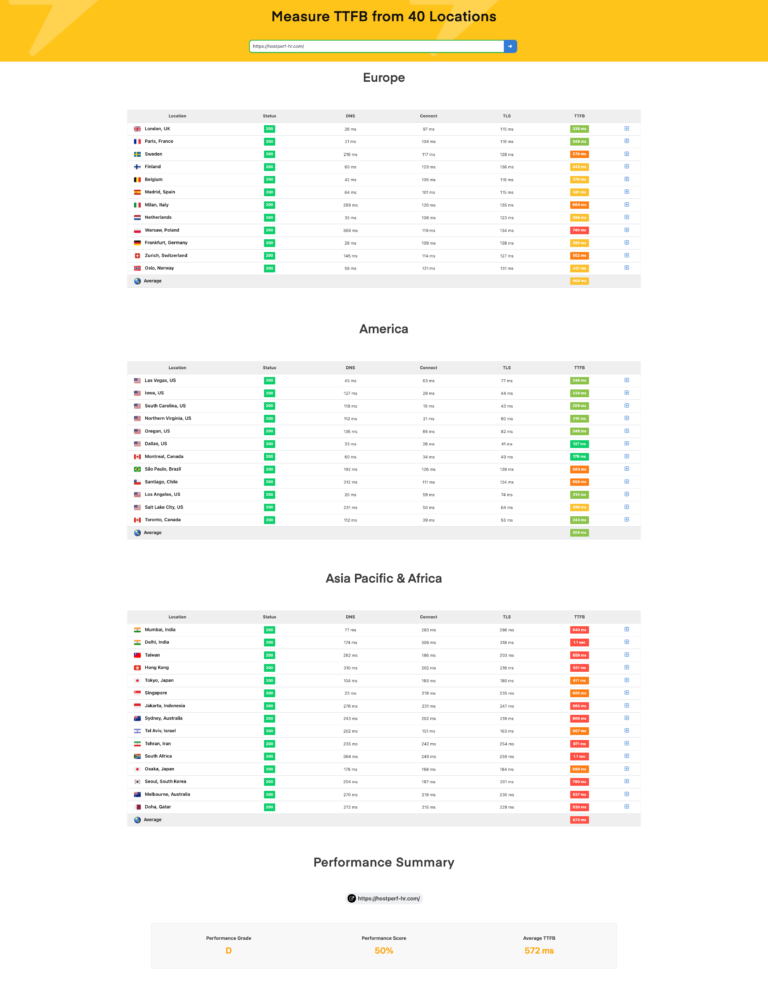
Test 5: Global TTFB
Test Configuration:
- Locations: 40 international points
- Americas: 15 points
- Europe: 15 points
- Asia-Pacific: 10 points
- Protocol: HTTPS
Analysis:
- Average Global TTFB
- Regional TTFB score.
test 6: Core Web Vitals (Paused)
We paused our Core Web Vitals benchmarks. We never believe in one time testing and always go for continuous performance monitoring. The one time Core Web Vitals test results are highly unreliable (across all the tools) and not effective to determine the performance of a company. So, we are pausing this benchmarks as of now.
Core Web Vitals are measured through the GTmetrix tool.
Test Configurations:
- Location: Cheyenne, WY, USA
- Device: Google Nexus 6/6P/ Pixel XL/ Pixel 2 XL
- Speed: Unthrottled connection
Though there are three major metrics, we evaluate the hosting provider solely based on the Largest Contentful Paint (LCP) score.

Resources:
WordPress Hosting Benchmarks: Get access to all performance test results with 365 days of data. It is updated yearly once.
Fastest WordPress Hosting: Similar to the above benchmark post, it comes with quarterly performance data.

Mohan Raj is the founder of Hostingstep.com, where he oversees the independent testing of 25+ web hosting providers. He conducts 525,600+ performance tests per year across 60+ global locations to measure TTFB speed, uptime, load test, core web vitals, and hardware benchmarks. Each provider is tested using independently purchased hosting accounts, backed by verifiable data.