We are back again for our 2024 edition of WordPress Hosting Benchmarks.
We have been testing popular WordPress hosting companies for over three years, and we took last year’s data (January 1, 2023, to December 31, 2023) to write up these 2024 Hosting benchmarks.
Hostingstep WordPress Hosting Benchmark Methodology:
Our WordPress Hosting benchmark is simple. We sign up as a customer for a popular hosting service, buy a hosting account, deploy a test site, and put the site for testing.
All the test sites are pre-installed with
- WordPress Twenty Twenty-Four Theme,
- Akismet, Contact Form 7, and Rank Math plugins.
On Managed WordPress hosting services, the caching is enabled by default. We added the “WP Fastest Cache” plugin for shared hosting services to enable caching.
The table below includes the hosting plan details, data center location, CDN usage, and benchmark start date.
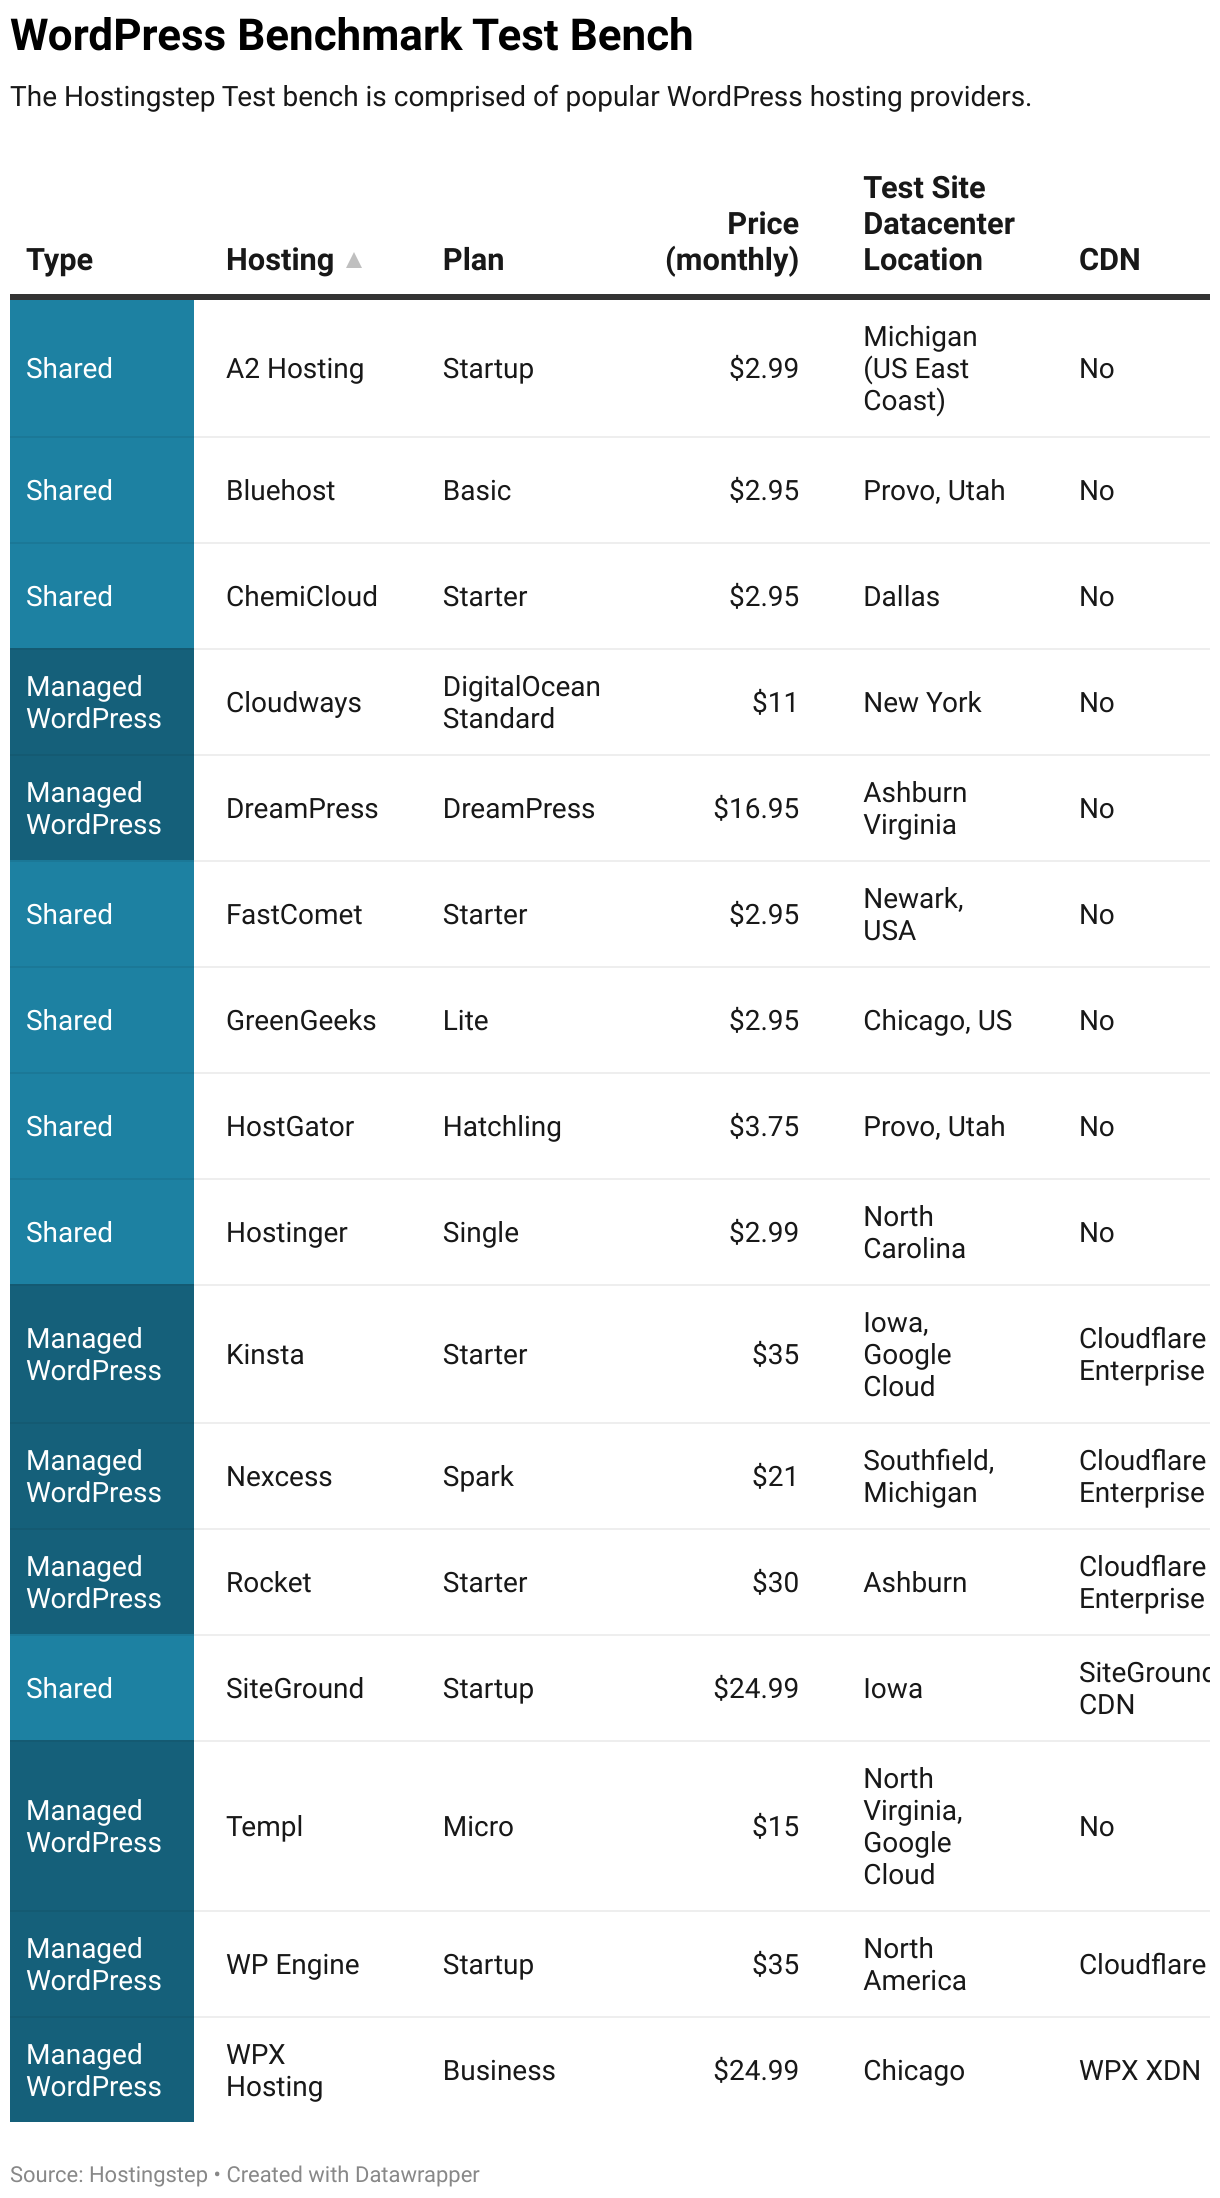
Access in HTML table mode:
| Hosting | Type | Plan | Price (monthly) | Test Site Datacenter Location | CDN | Benchmark Start Date |
|---|---|---|---|---|---|---|
| A2 Hosting | Shared | Startup | $2.99 | Michigan (US East Coast) | No | September 1, 2020 |
| Bluehost | Shared | WordPress Basic Hosting | $2.95 | Provo, Utah | No | November 16, 2022 |
| ChemiCloud | Shared | Starter | $2.95 | Dallas | No | August 25, 2020 |
| Cloudways | Managed Cloud | DigitalOcean Standard | $11 | New York | No | August 25, 2020 |
| DreamPress | Managed WordPress | DreamPress | $16.95 | Ashburn Virginia | No | January, 30, 2021 |
| FastComet | Shared | Starter | $2.95 | Newark, USA | No | August 25, 2020 |
| GreenGeeks | Shared | Lite | $2.95 | Chicago, US | No | September 1, 2020 |
| HostGator | Shared | Hatchling | $3.75 | Provo, Utah | No | November 16, 2022 |
| Hostinger | Shared | Single | $2.99 | North Carolina | No | November 30, 2020 |
| Kinsta | Managed WordPress | Starter | $35 | Iowa, Google Cloud | Cloudflare Enterprise | September 1, 2020 |
| Nexcess | Managed WordPress | Spark | $21 | Southfield, Michigan | Cloudflare | May 1, 2021 |
| Rocket | Managed WordPress | Starter | $30 | Ashburn | Cloudflare Enterprise | October 12, 2020 |
| SiteGround | Shared | Startup | $2.99 | Iowa | No | August 26, 2020 |
| Templ | Managed WordPress | Micro | $15 | North Virginia, Google Cloud | No | February 3, 2021 |
| WP Engine | Managed WordPress | Startup | $35 | North America | Cloudflare | September 1, 2020 |
| WPX Hosting | Managed WordPress | Business | $24.99 | Chicago | WPX XDN | March 26, 2021 |
List of Benchmark Tests:
TTFB and Uptime test using Pingdom:
Using the Pingdom Synthetic Monitoring tool, all our test sites are monitored from 22 major regions in the United States and Canada. Pingdom collects the TTFB score from all the locations and provides an overall average TTFB score. Uptime is also measured in the same way. (Sample TTFB / uptime report)
Load Test using Loader.io:
In this test, a 500 constant client load is sent to the site, and the average response time is measured. The test is made from the Amazon US East data center. (sample report)
Hardware benchmark using WPBenchmark Plugin:
WPBenchmark is a WordPress plugin that does CPU, Memory, File system, database performance, and network speed tests. The plugin gives an overall score out of 10. (sample report)
Core web Vitals using GTmetrix:
GTmetrix measures the sites’ Core Web Vitals score. The test is done in Cheyenne, Wyoming, using a simulated mobile device setup. (sample report)
Global TTFB using SpeedVitals:
Speedvitals tool measures the average global TTFB from 40 international locations in the USA, Europe, and Asia–Pacific. These results are beneficial for sites with global audiences. (sample report)
Benchmark Test 1 – TTFB
Time to First Byte (TTFB) is the most critical factor when choosing any WordPress hosting service. Lowering the TTFB score speeds up the site, provides a better user experience, and helps pass Core Web Vitals.
The Pingdom Sytenthic monitoring tool pings the test site for 60 seconds once. A total of 43,800 tests are done in a month to calculate the average TTFB performance.
I took last year’s data (January 1, 2023 – December 31, 2023) and listed the hosts with better TTFB to poor TTFB scores.
TTFB Benchmark Results
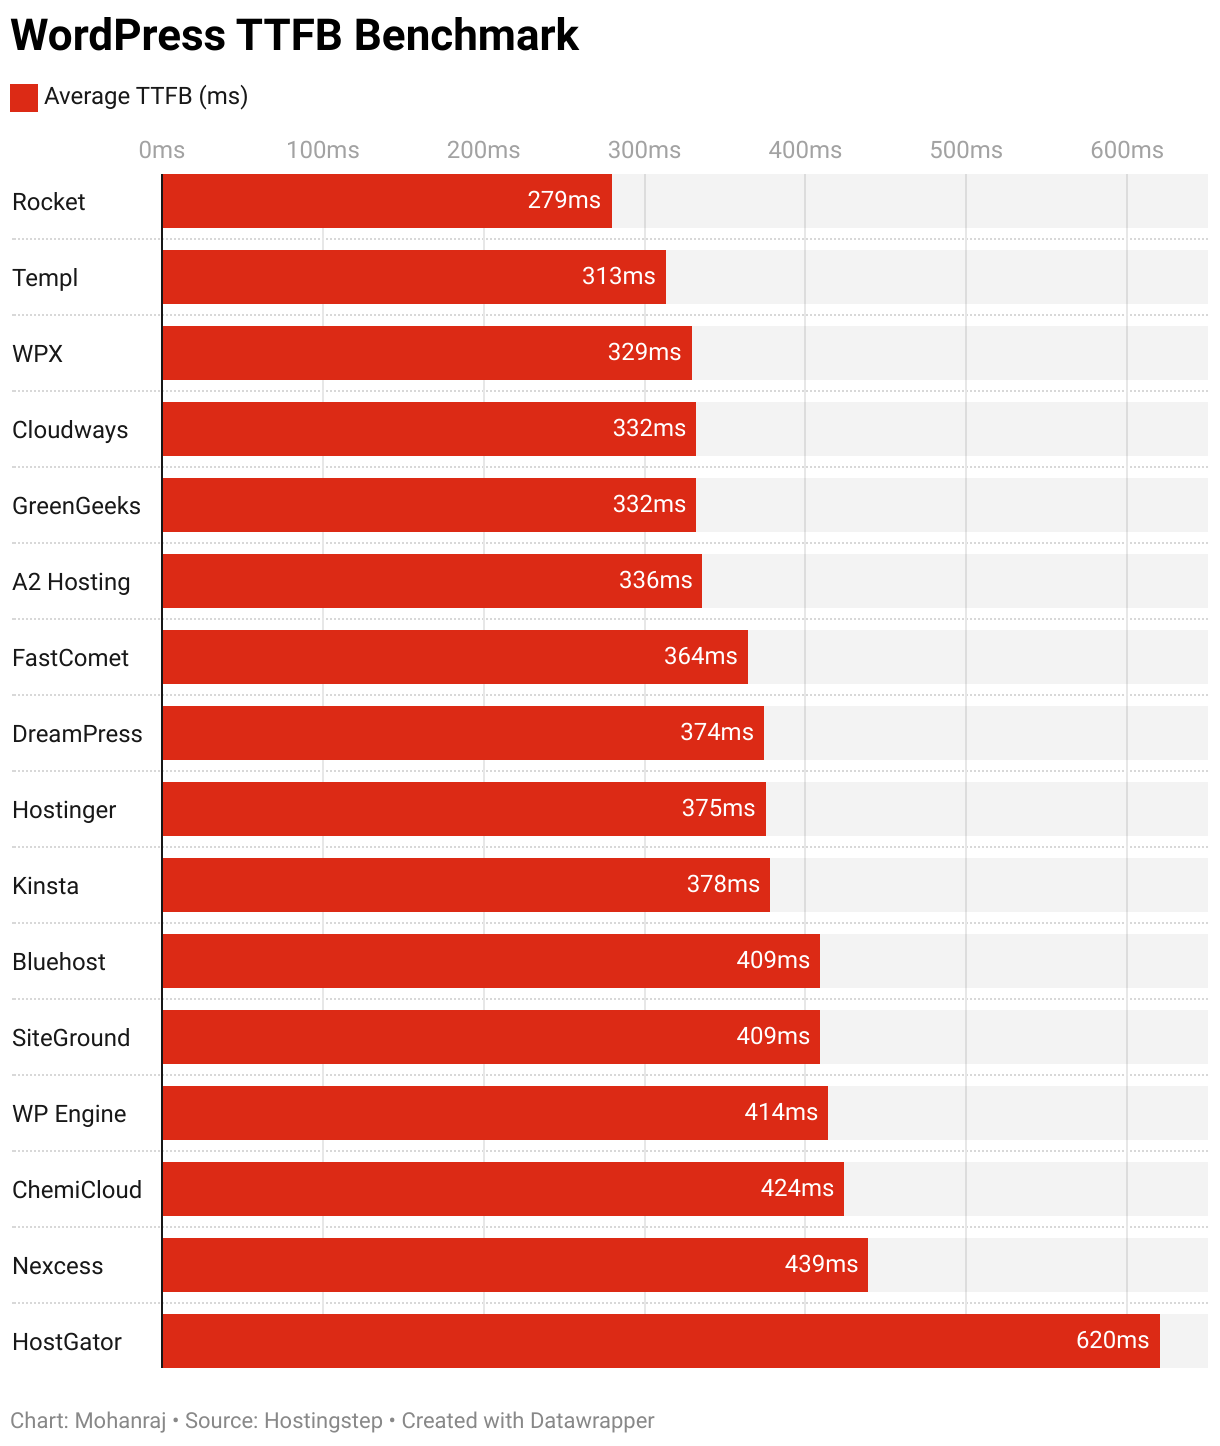

Rocket.net has emerged as the fastest TTFB WordPress host for the second consecutive year. Their speed-optimized hosting stack with Cloudflare Enterprise full-page caching does the magic for them. Templ, my recommended VFM hosting, came second on our list.
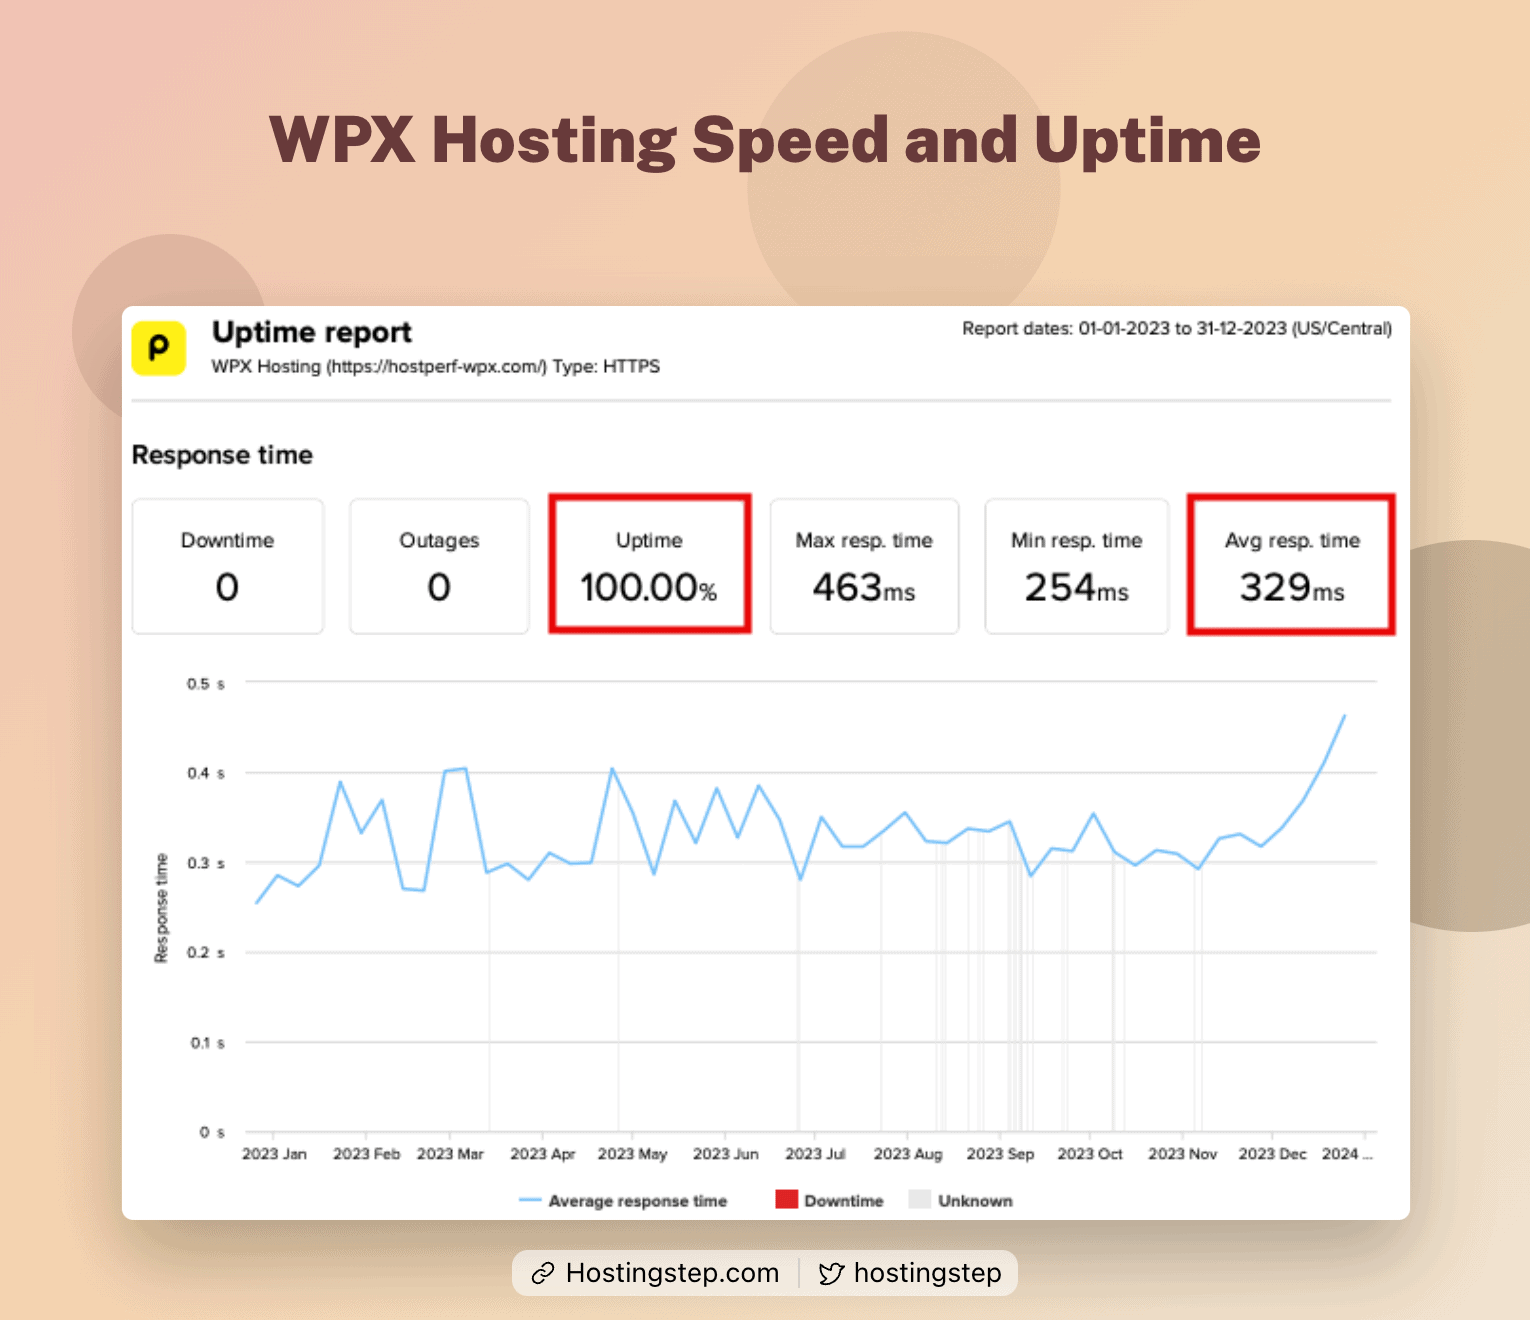
WPX is the third fastest TTFB host, with 329 ms TTFB. Unlike the first two hosts, WPX’s TTFB is inconsistent month over month, as seen in the graph.
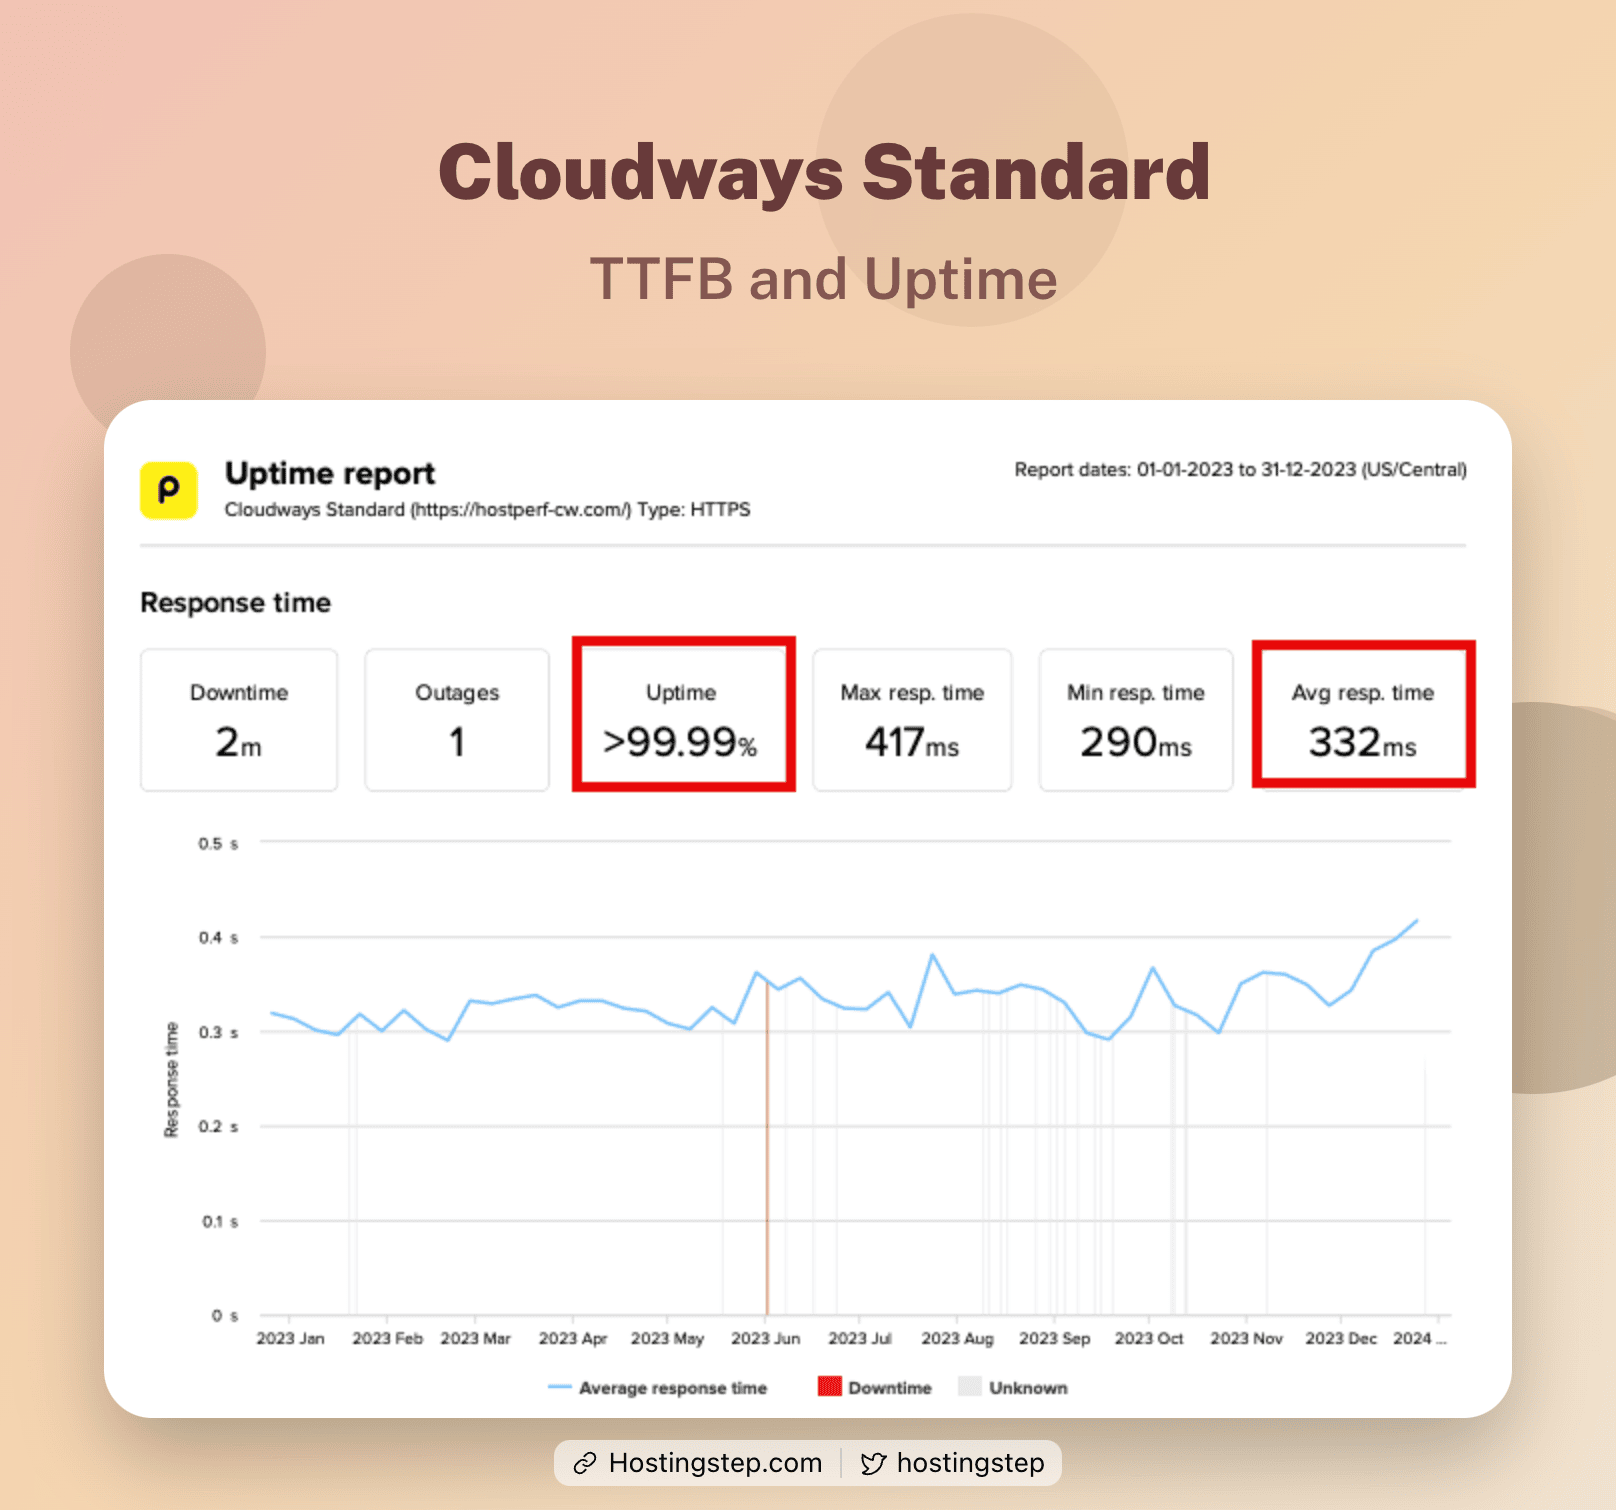
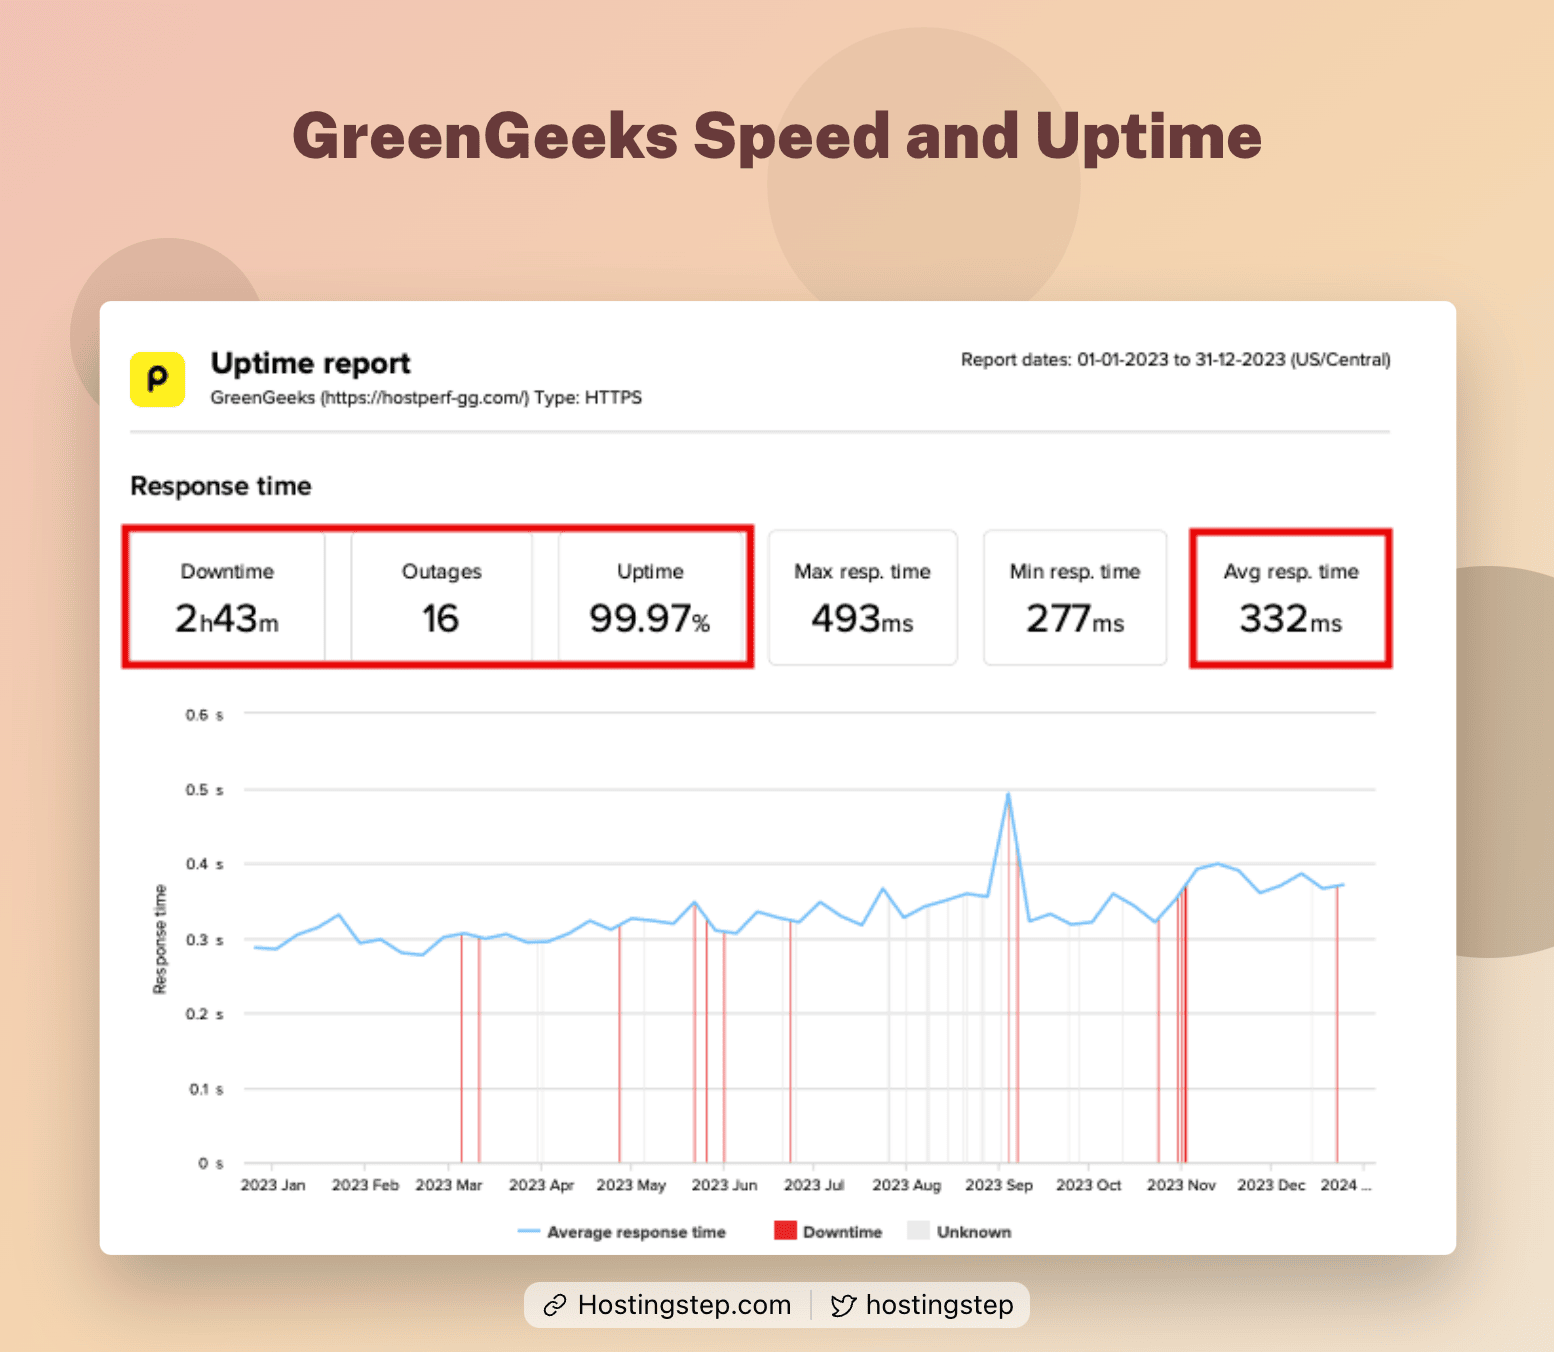
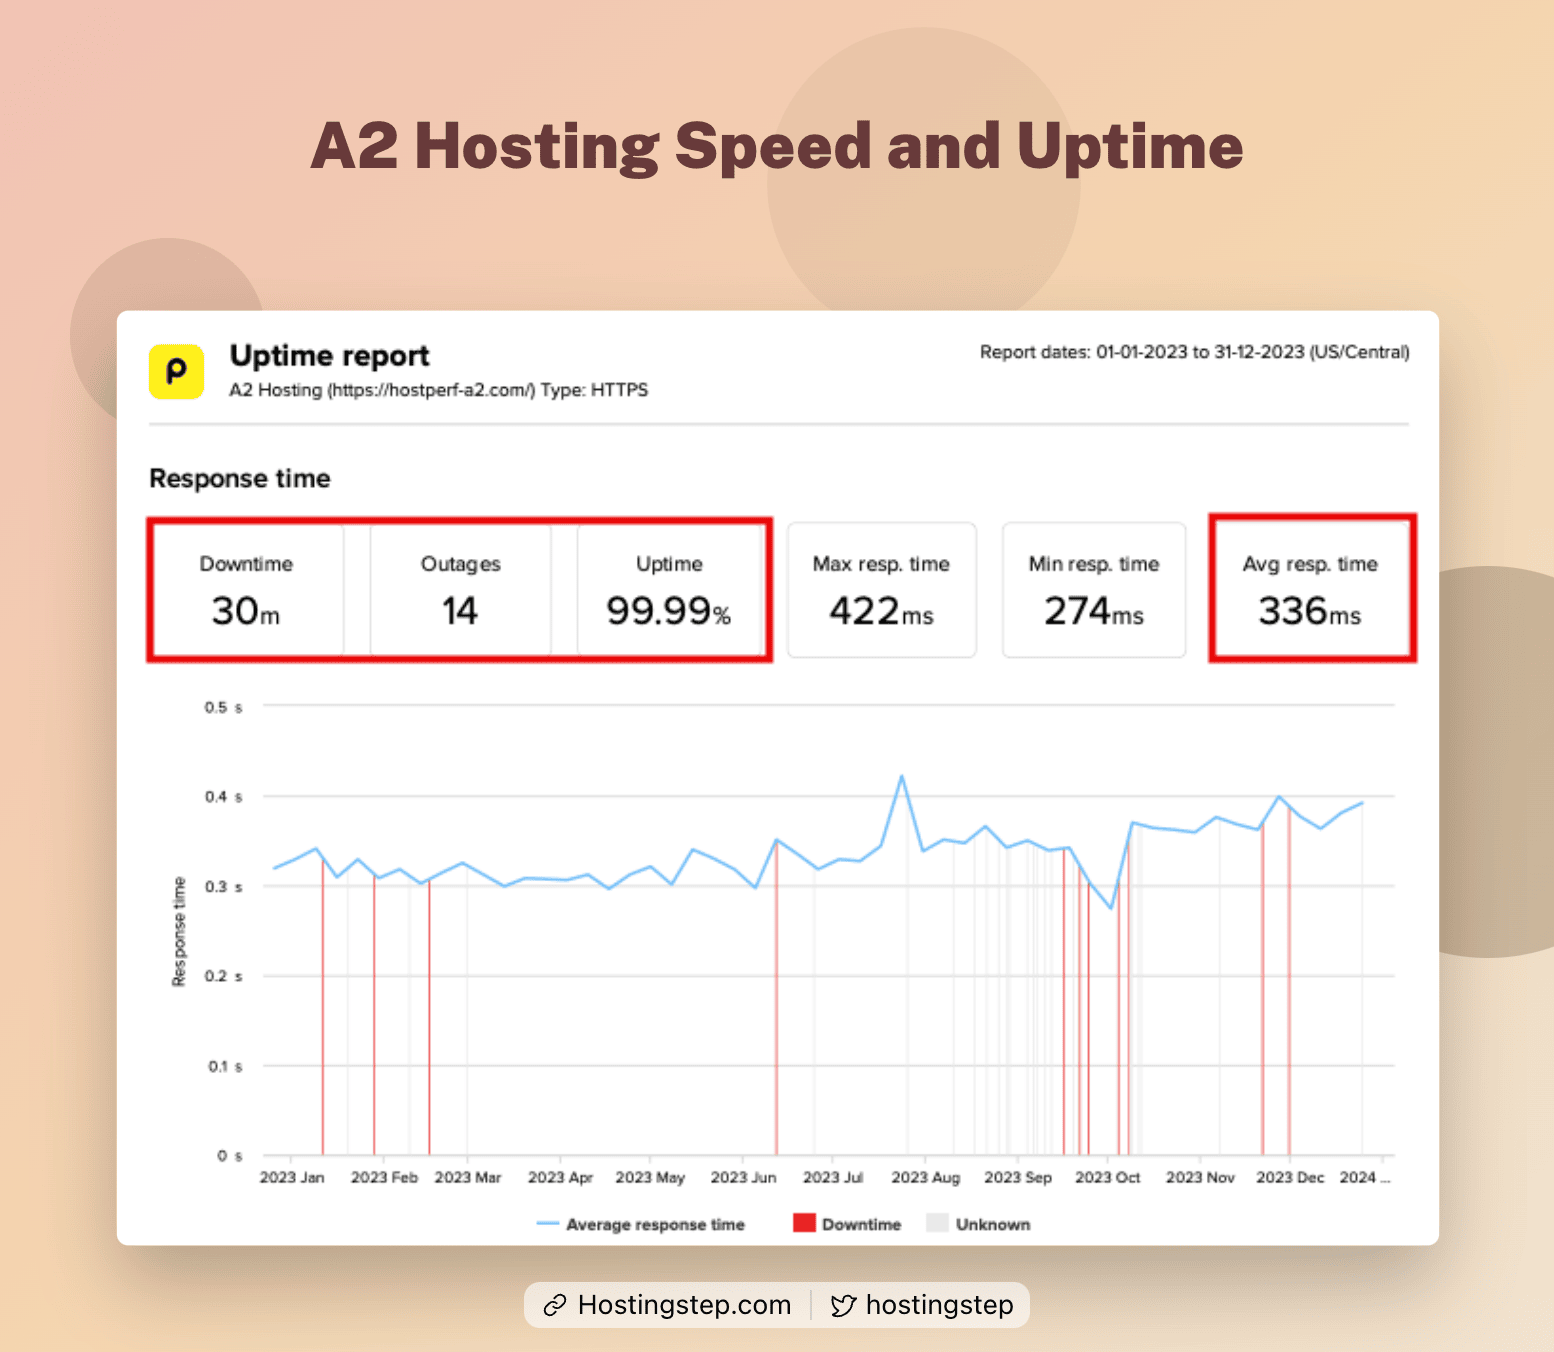
Cloudways and GreenGeeks recorded 332 ms and took the next two spots. GreenGeeks is most impressive, considering it costs $2.99/month to get started. A2 Hosting comes close with 336 ms, which is a pretty decent and consistent graph, too.
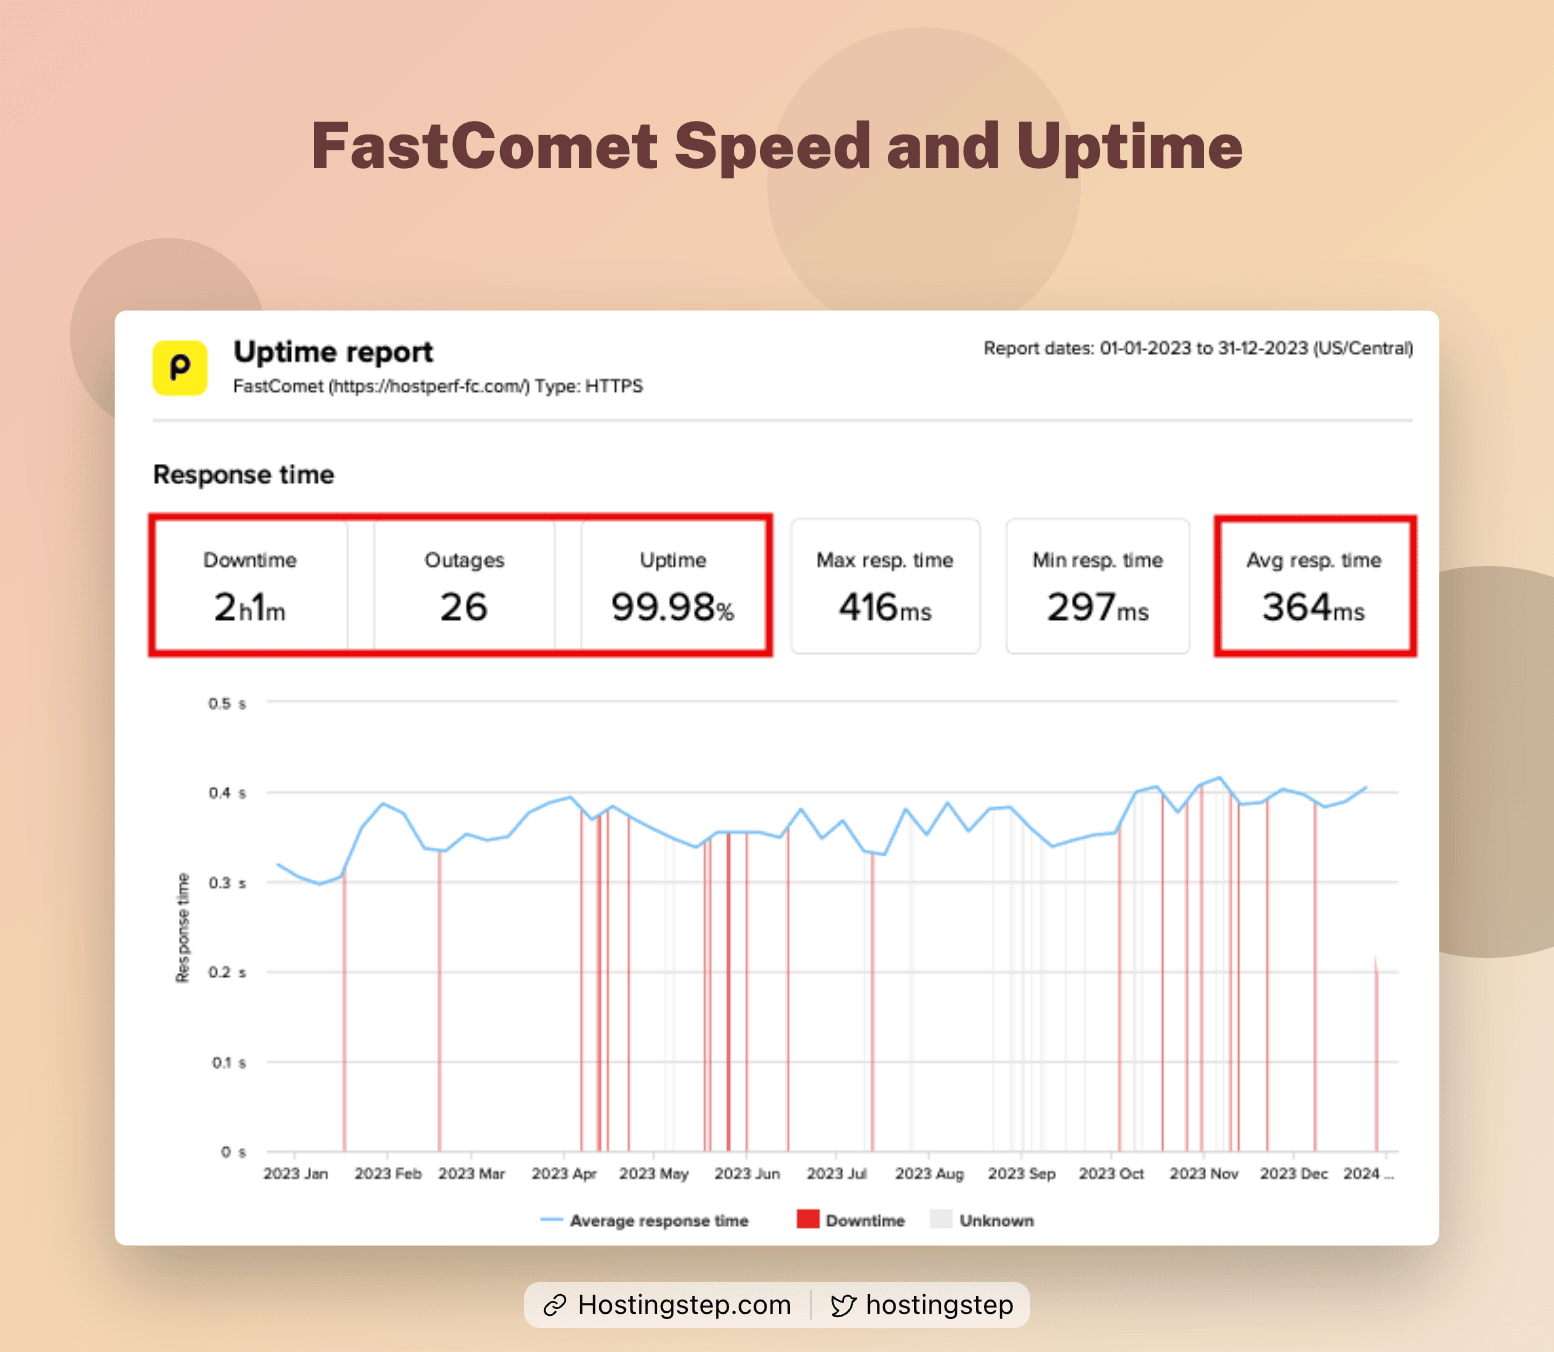
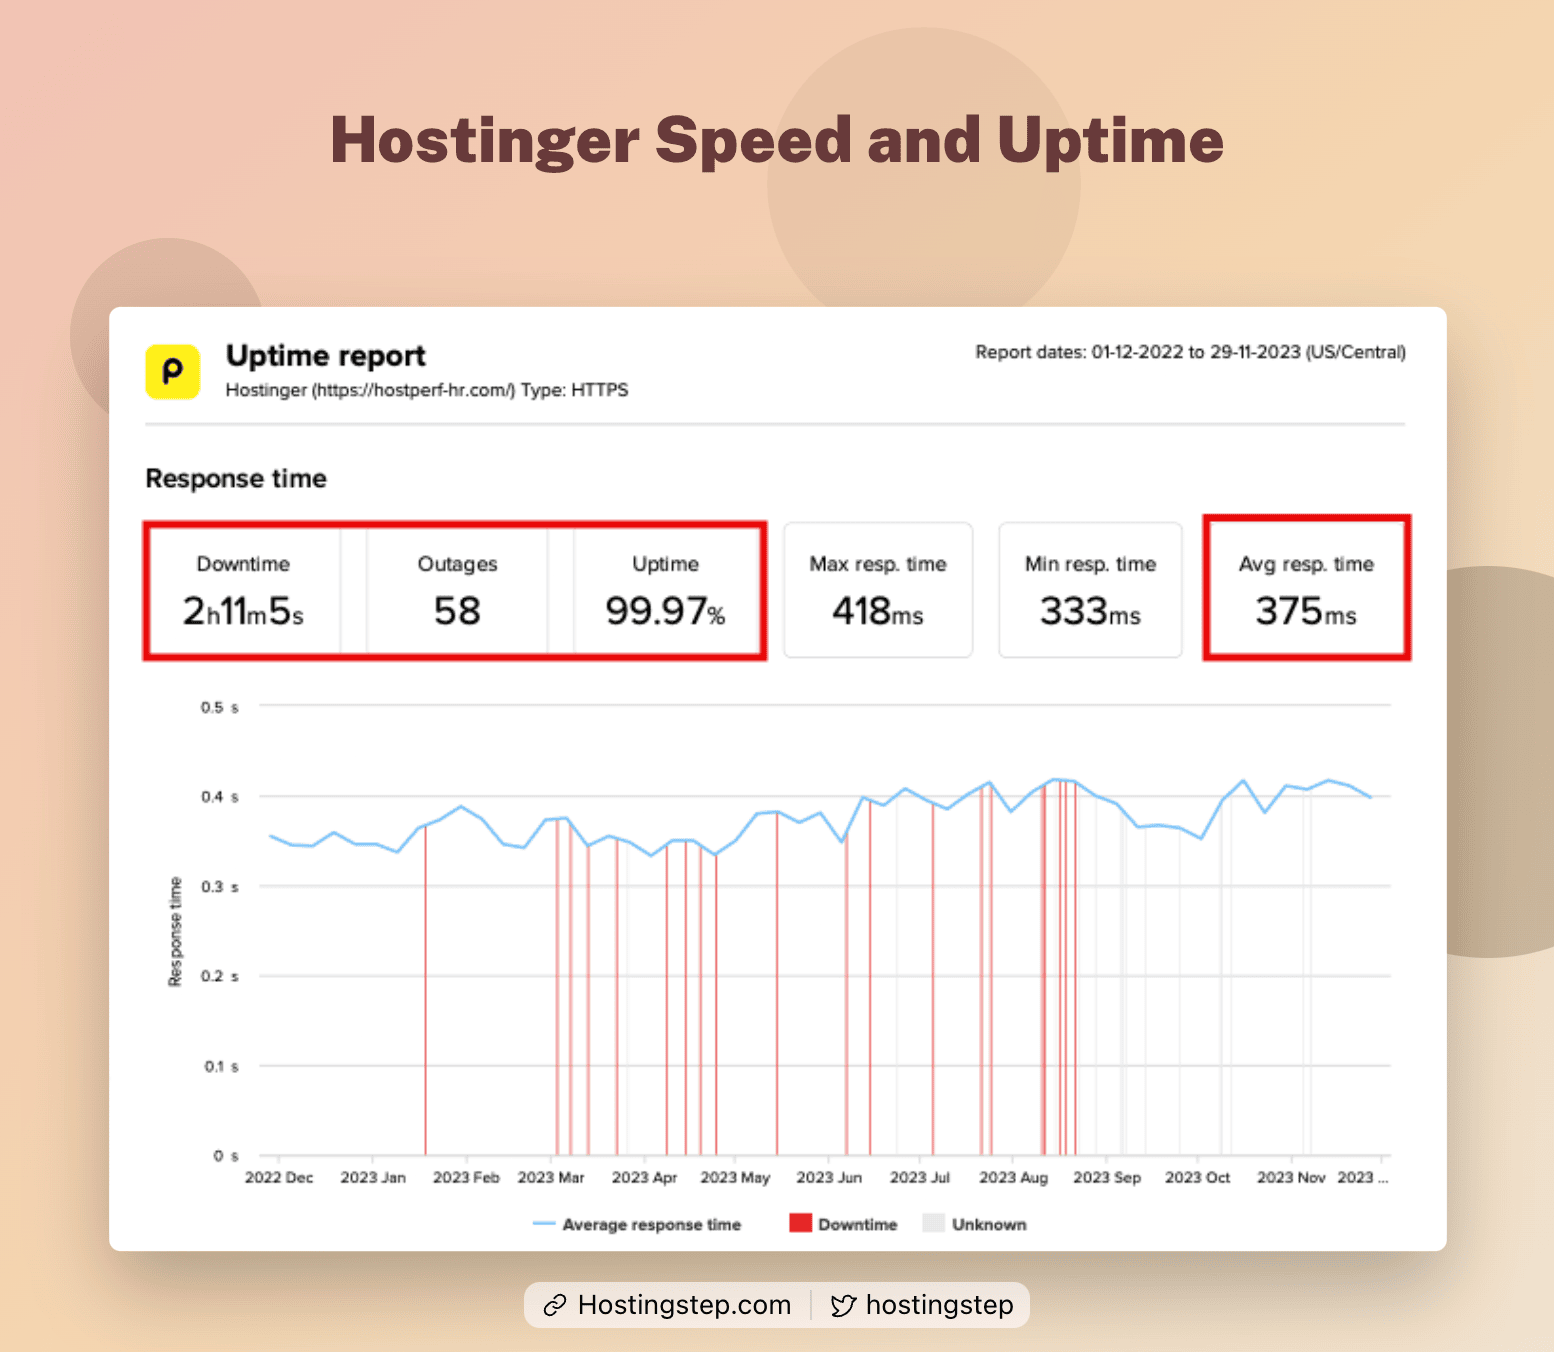
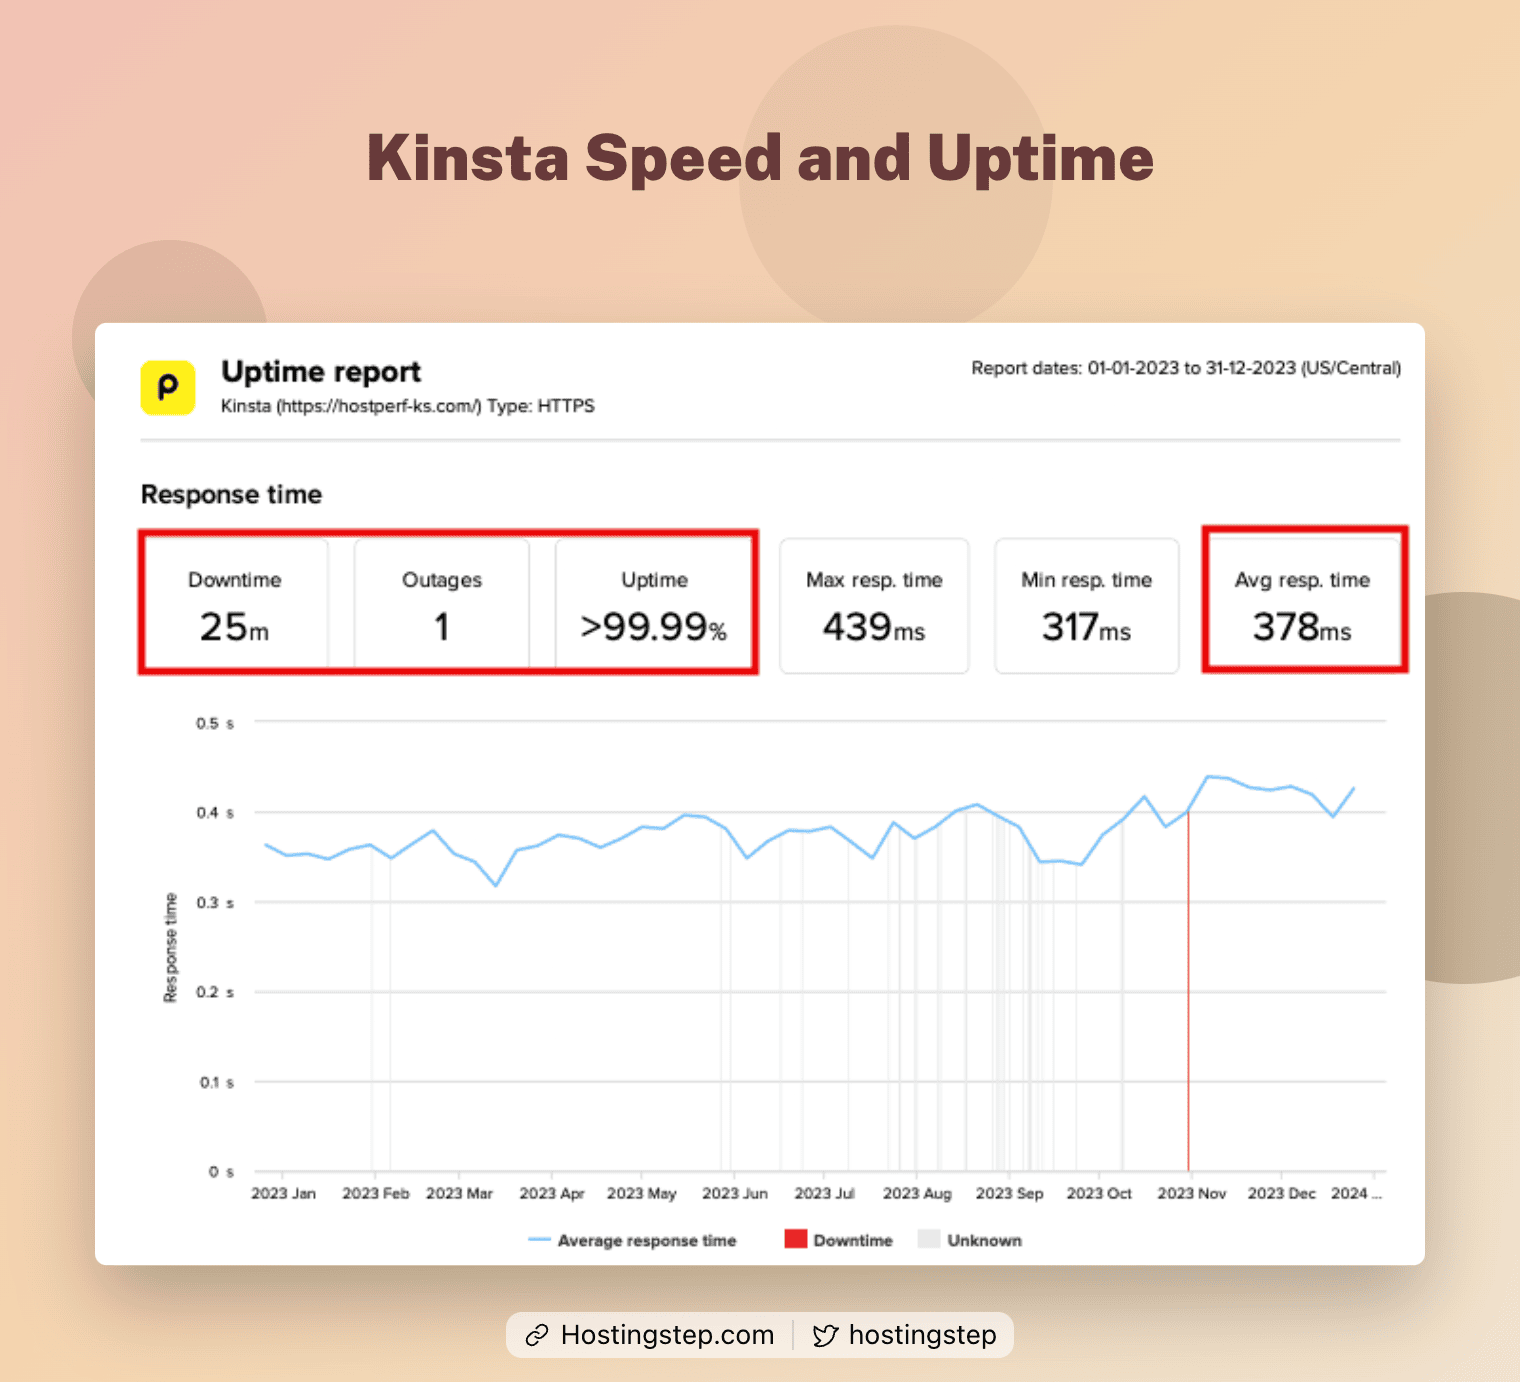
FastComet, DreamHost, Hostinger, and Kinsta recorded an average TTFB of 364 ms, 374 ms, 375 ms, and 378 ms, respectively.
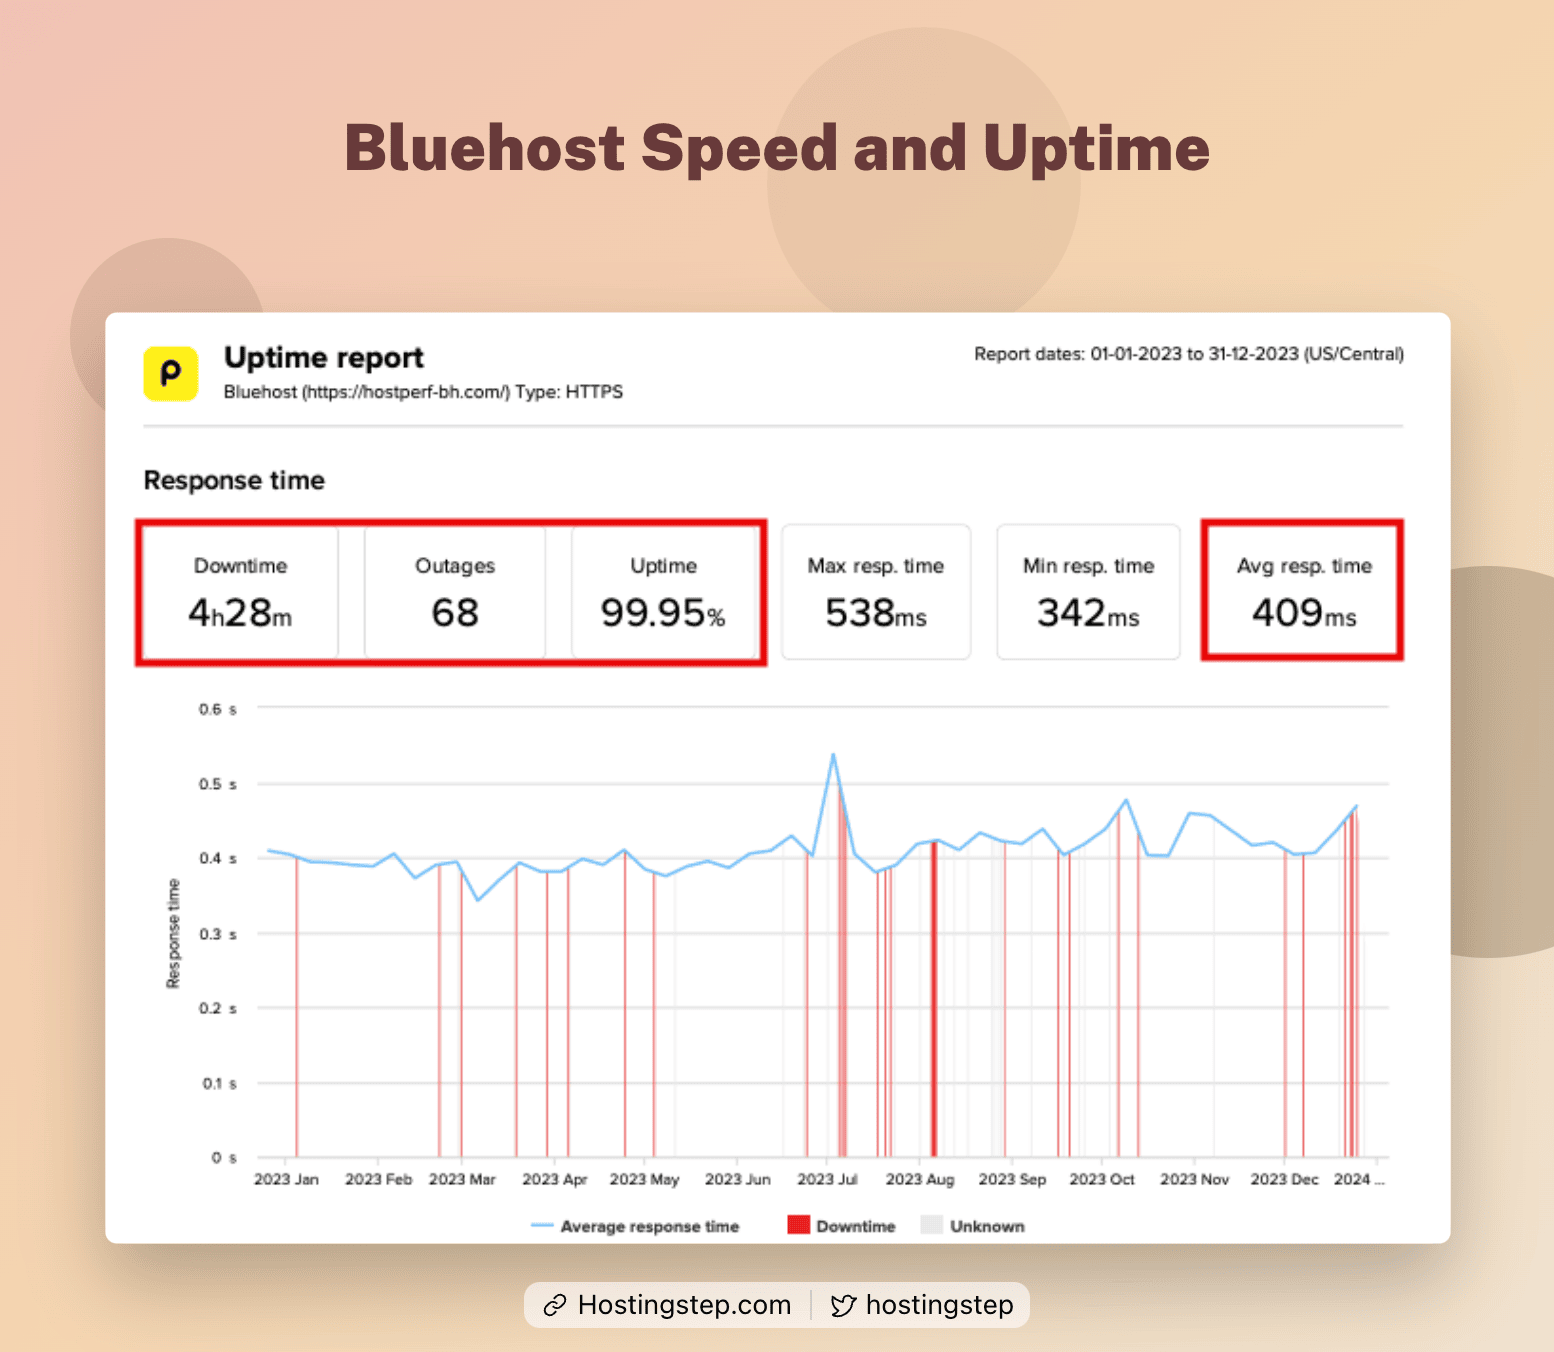
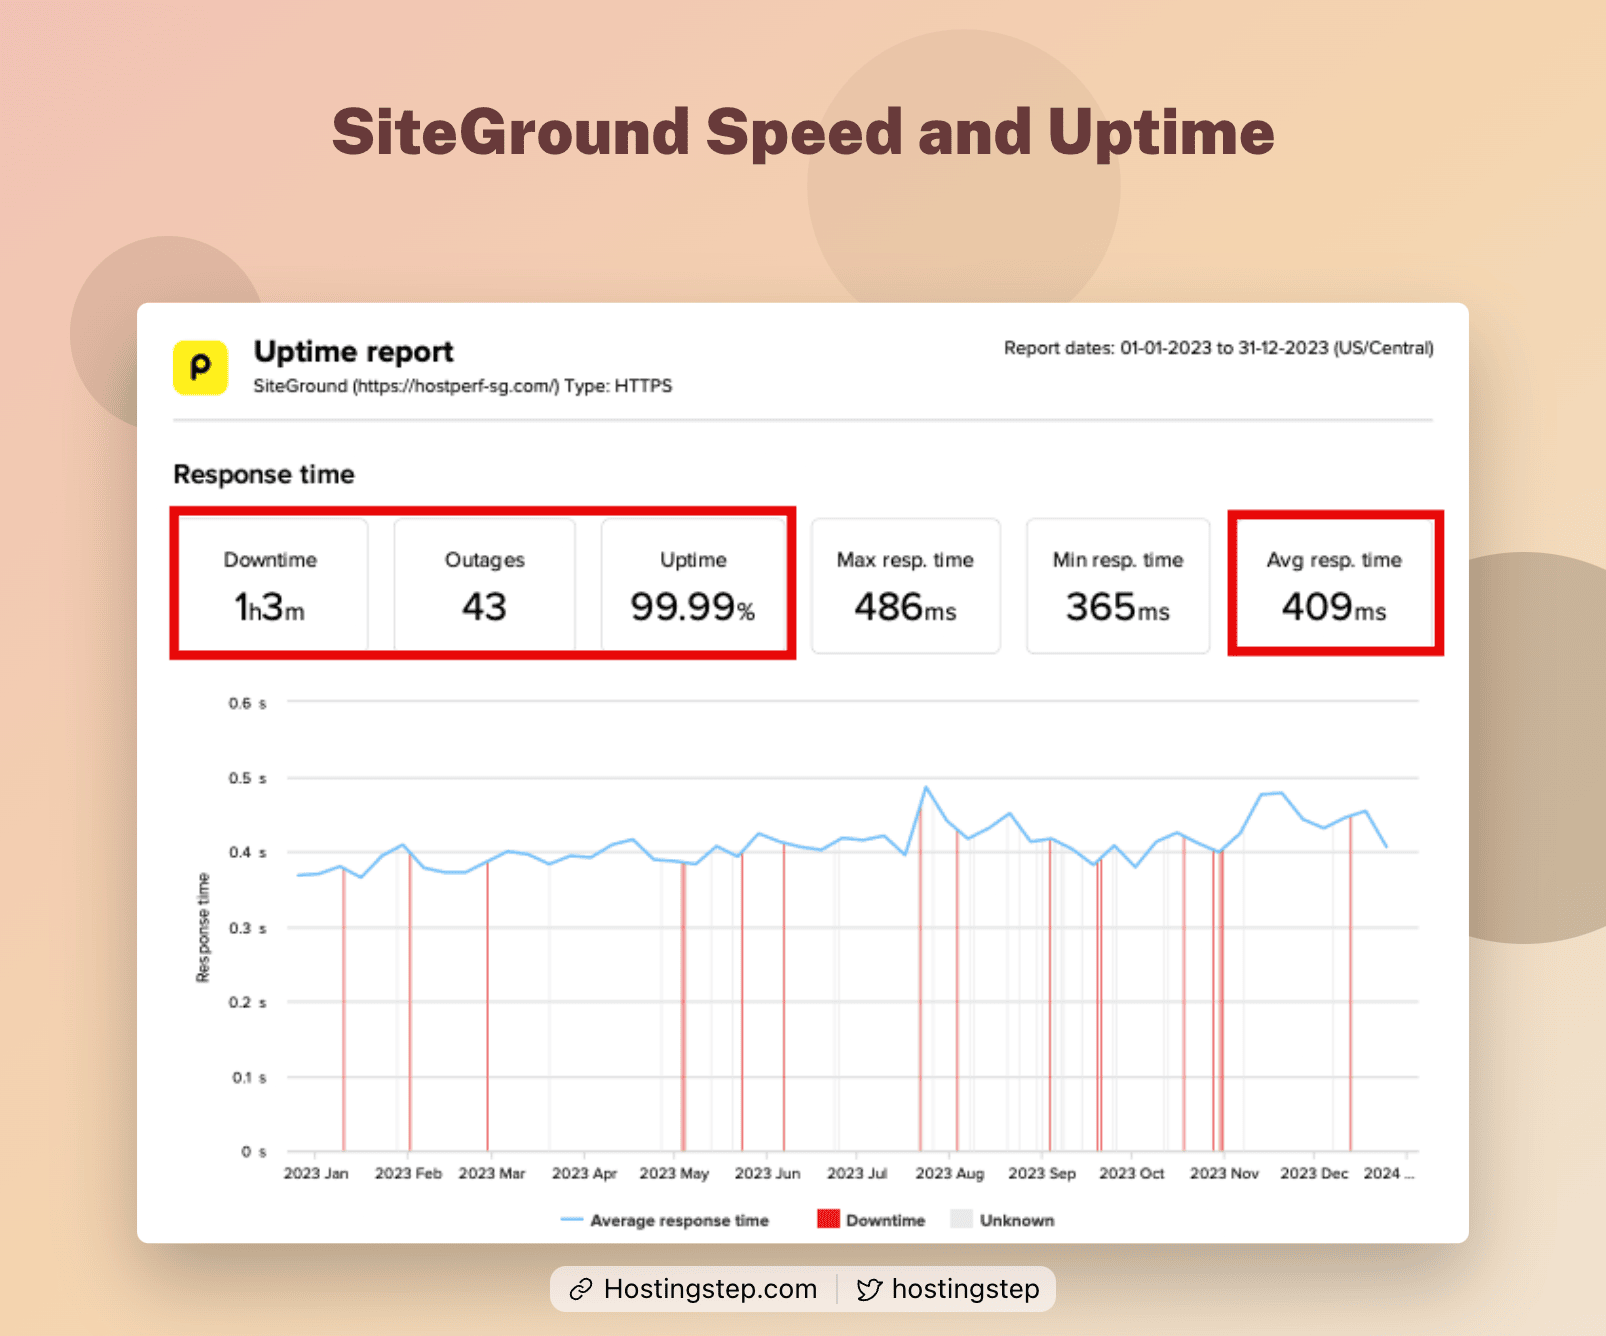
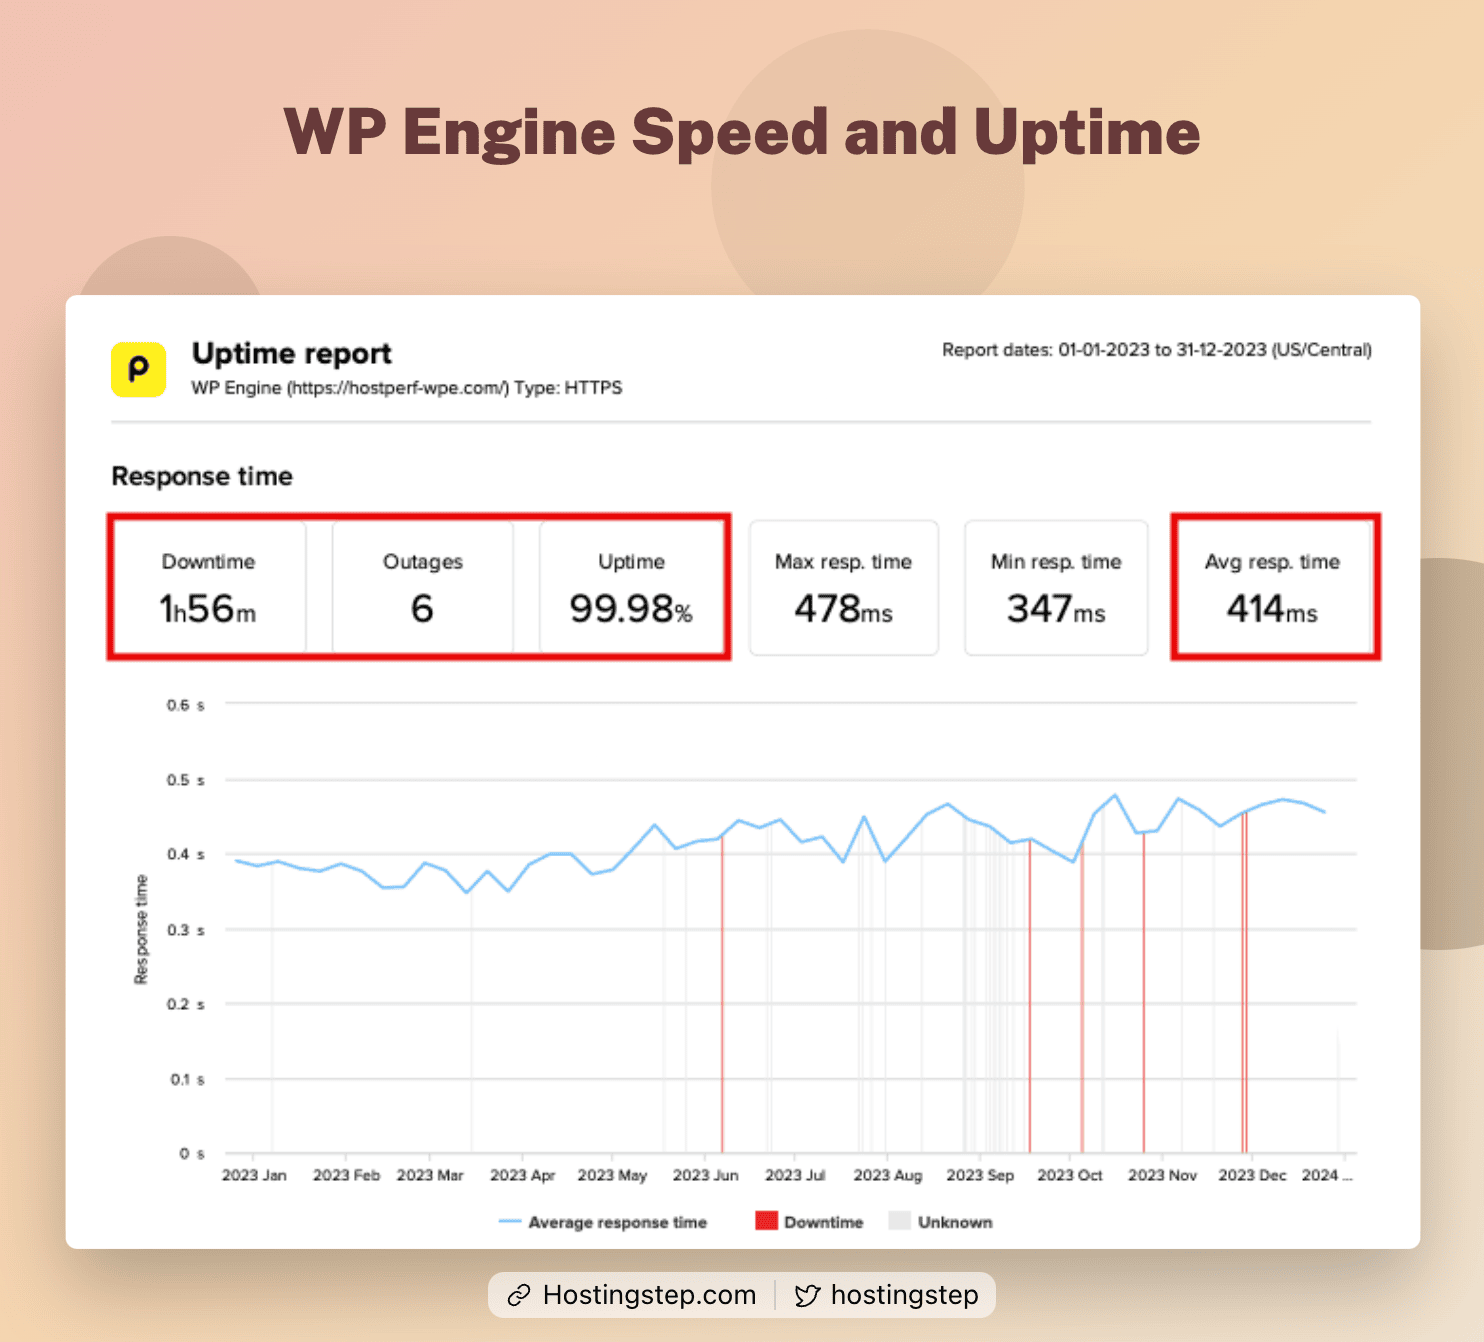
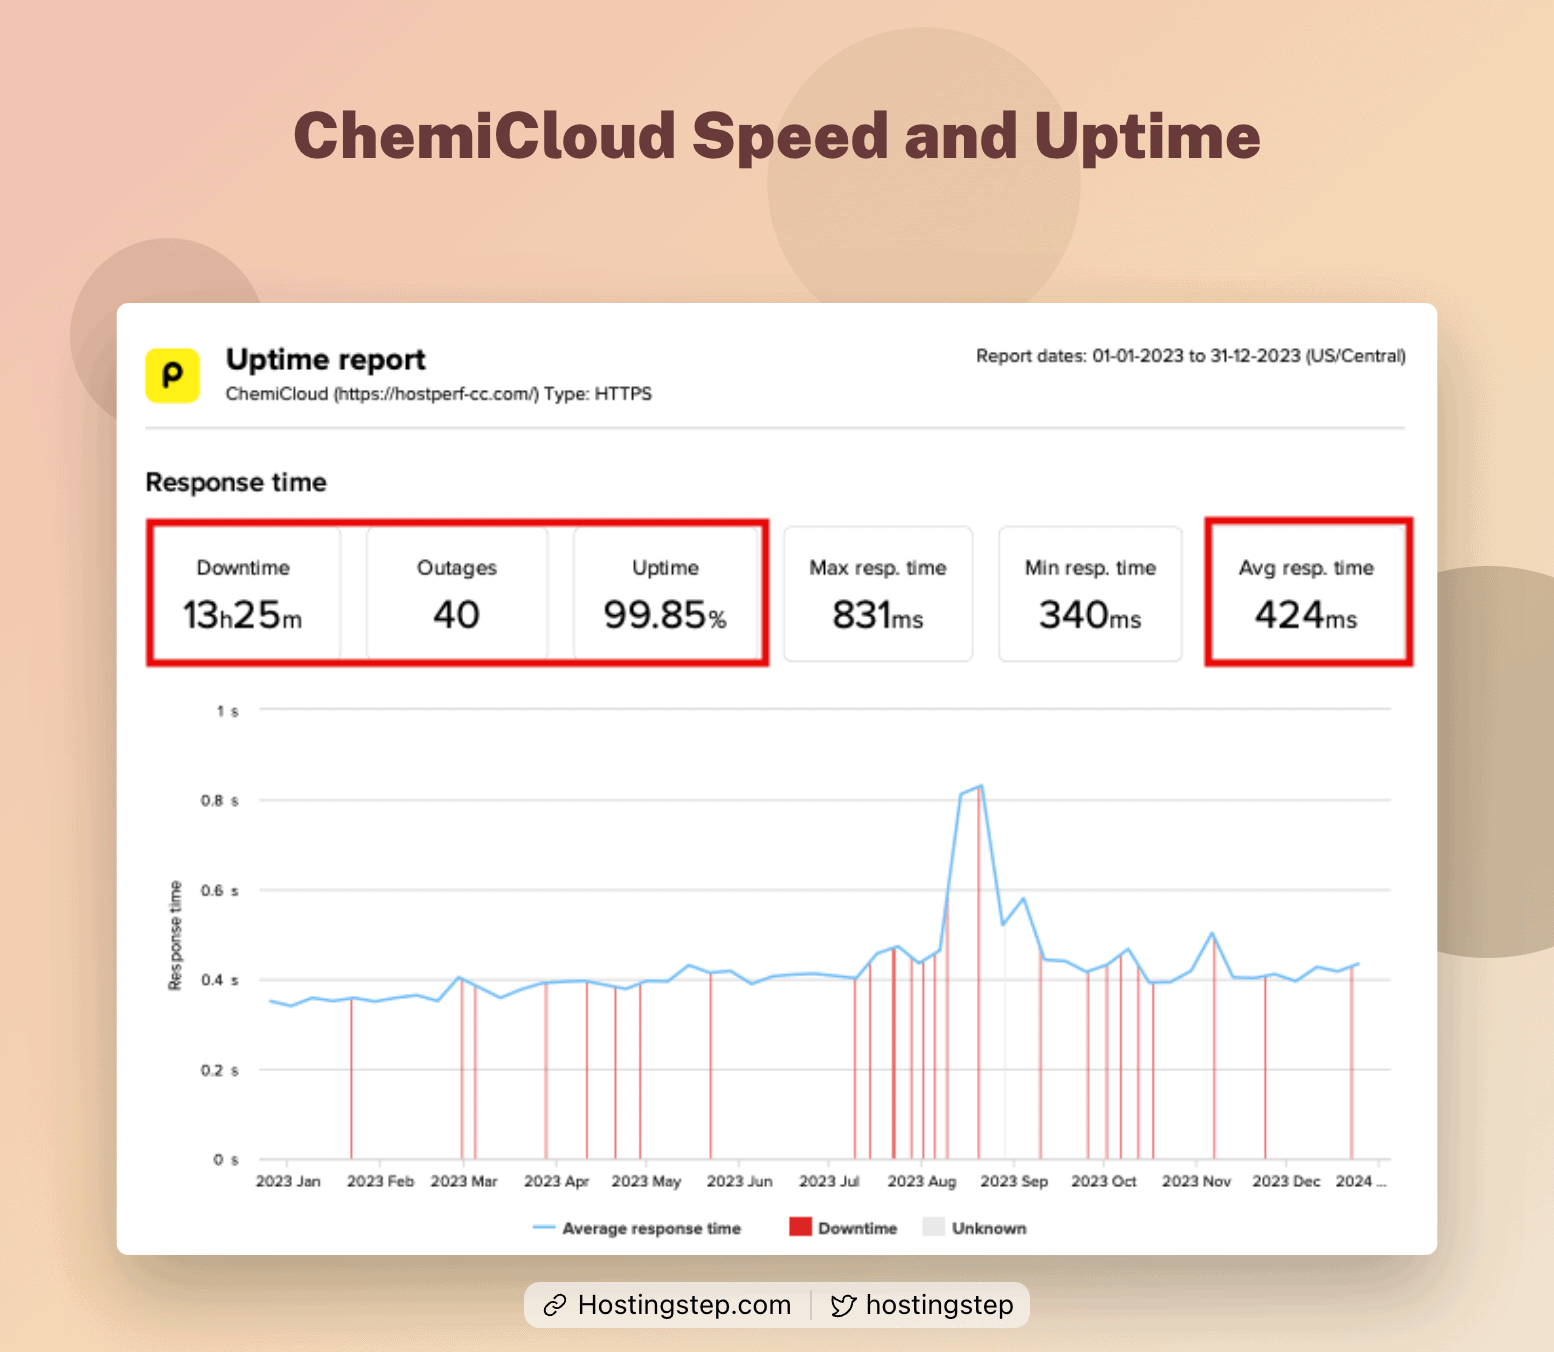
While both Bluehost and SiteGround scored 409 ms TTFB, WP Engine recorded 414 ms response time, which is pretty disappointing considering its price. ChemiCloud used to be in the top 10 positions in last year’s benchmark, but now it has dropped to the 14th spot.
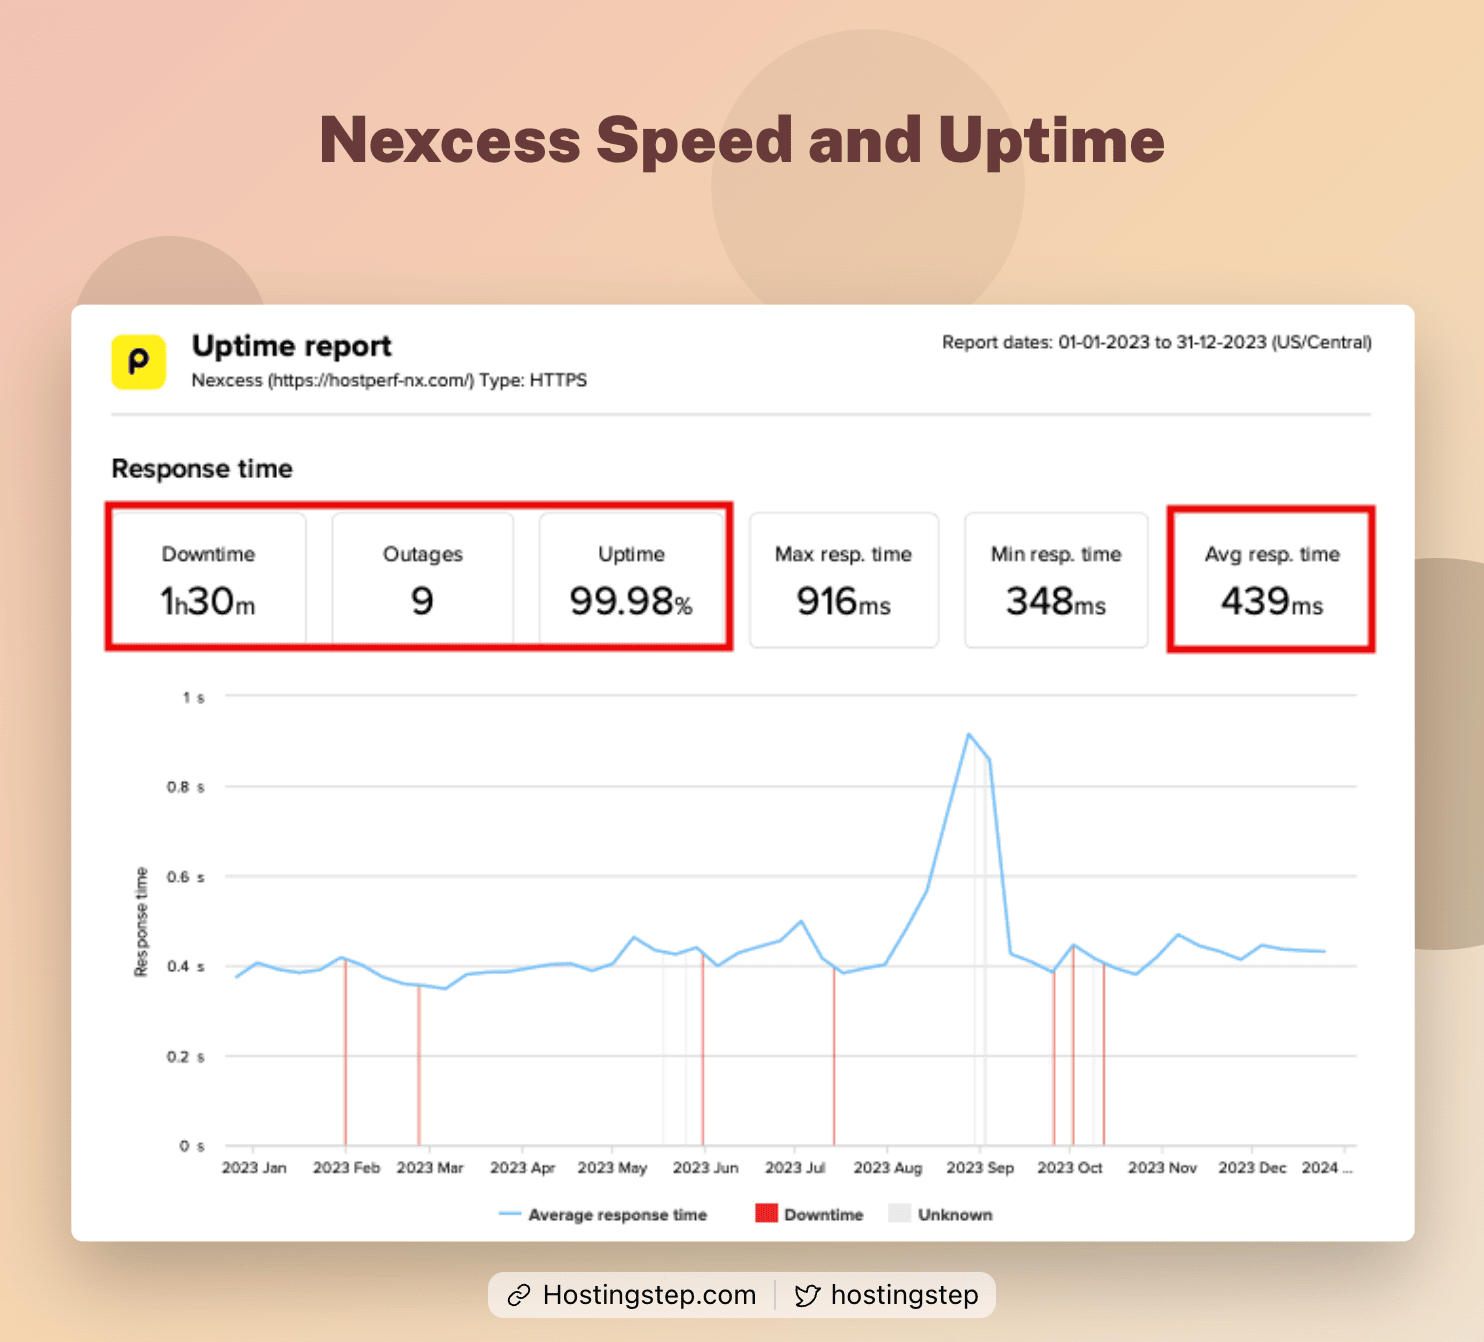
Nexcess looks promising, but their TTFB is a bit of a disappointment.
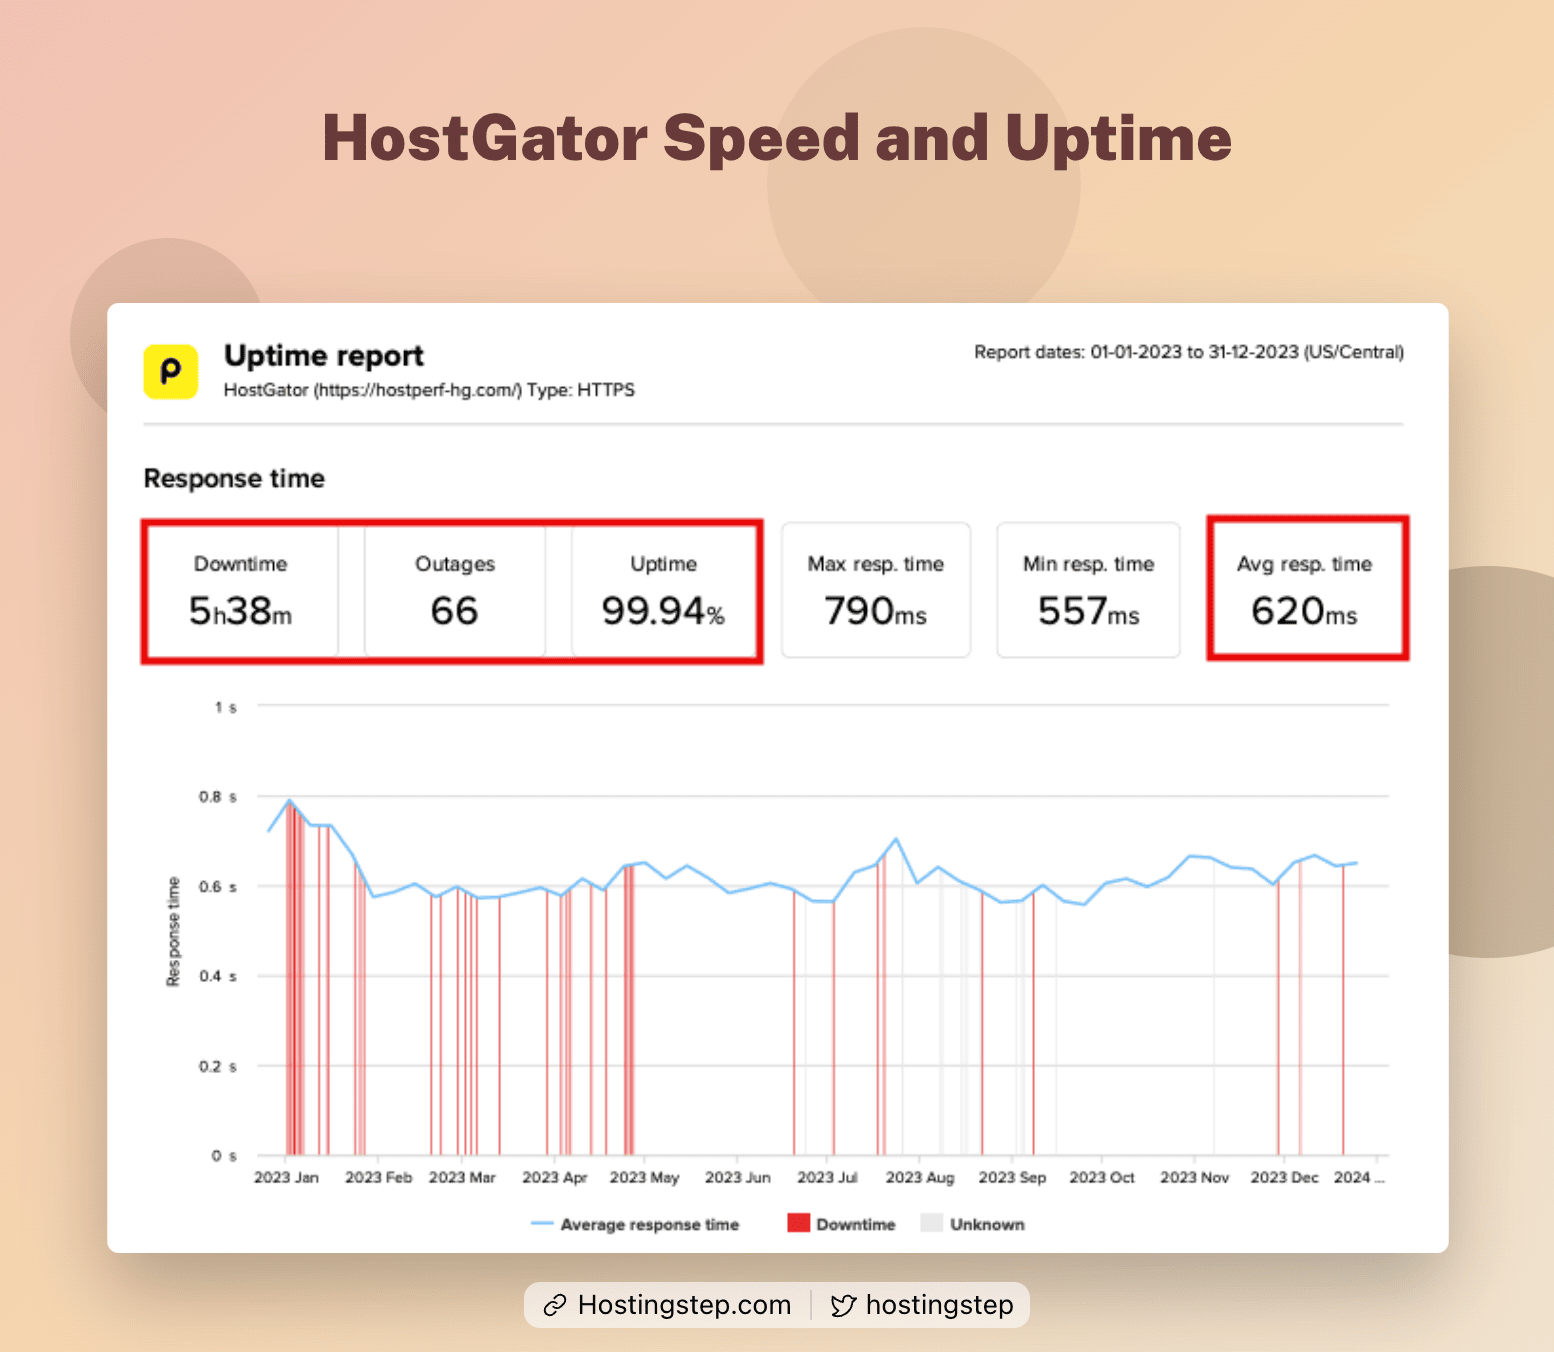
HostGator is one of the slowest hosting services with a massive 620 ms TTFB.
Benchmark Test 2 – Uptime
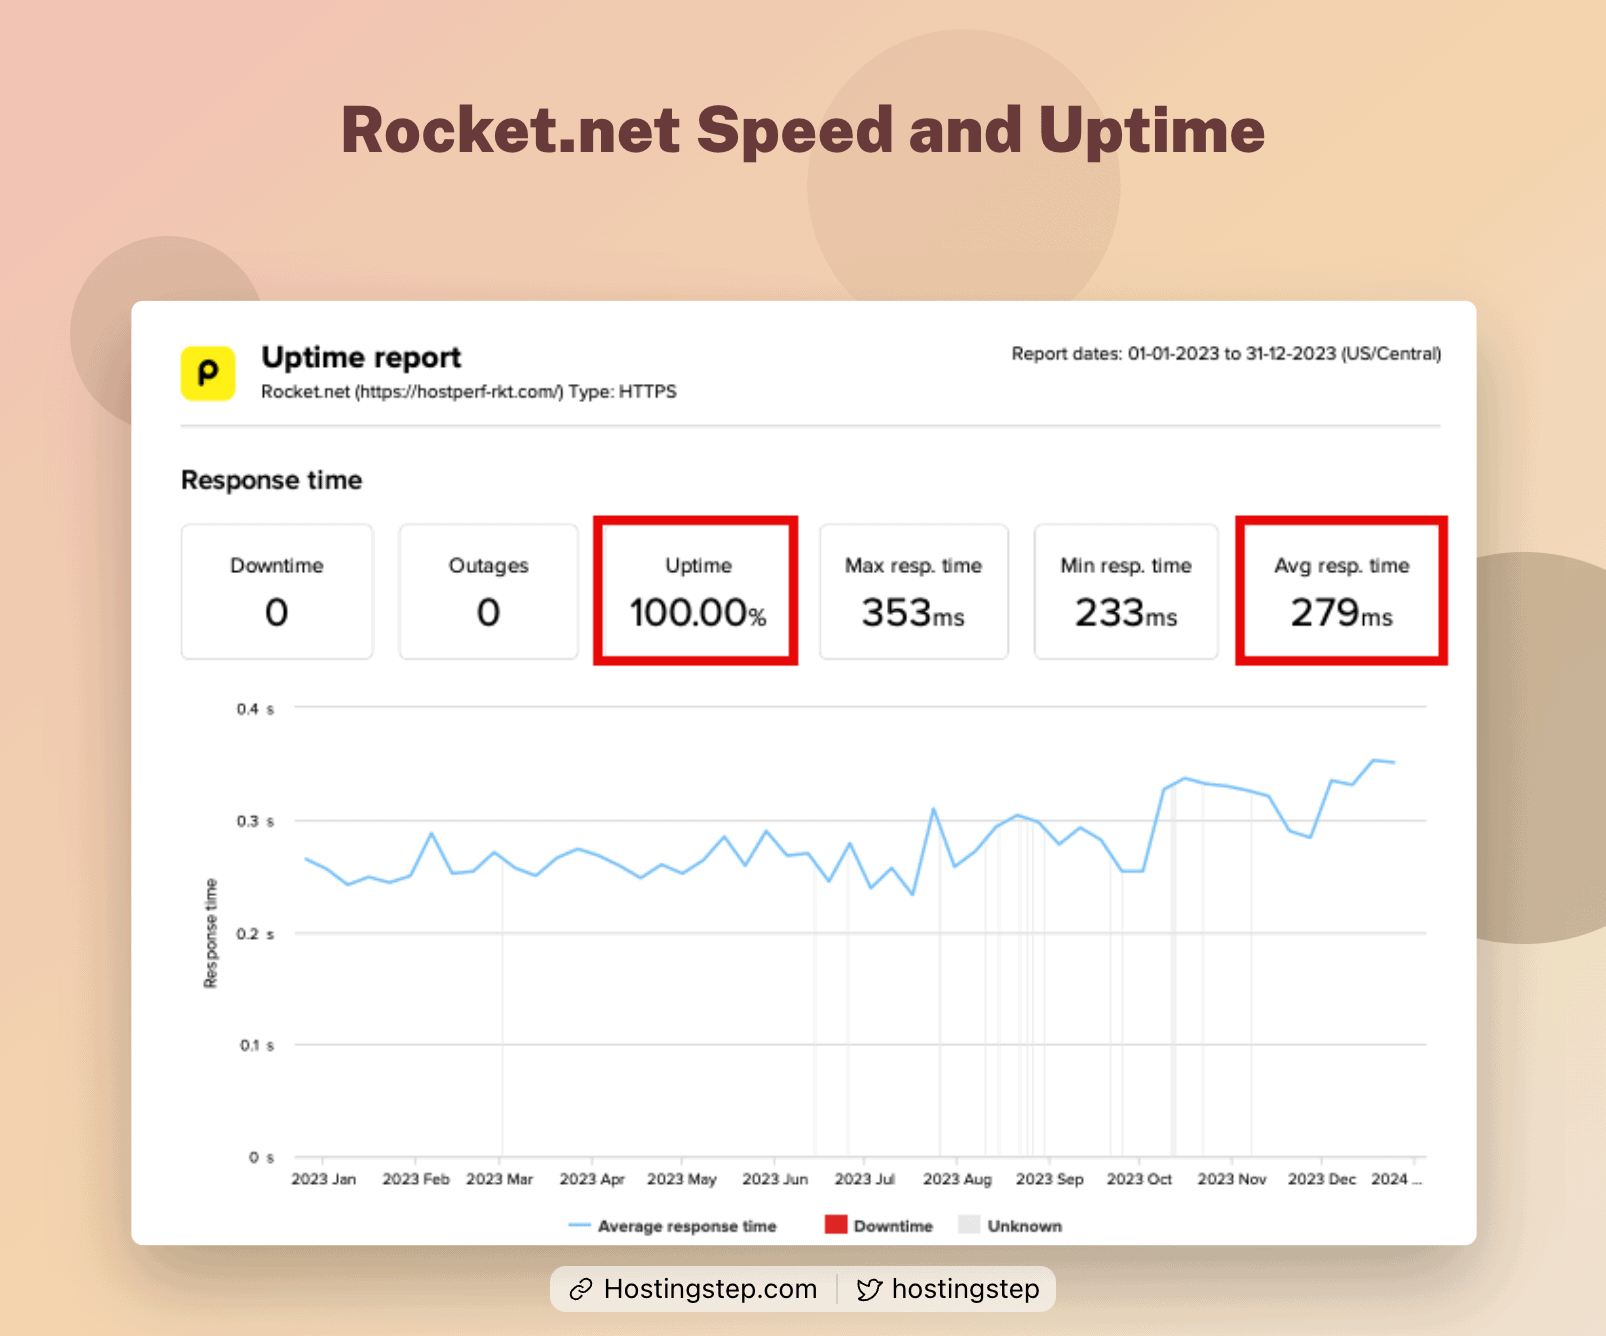
Uptime is a crucial factor in benchmarking WordPress hosting services. The Pingdom Syntentic monitoring tool pings the site for 60 seconds once, and if it is not reachable within 30 seconds, Pingdom records it as downtime.
The uptime is calculated based on 365 days of data (January 1, 2023 – December 31, 2023).
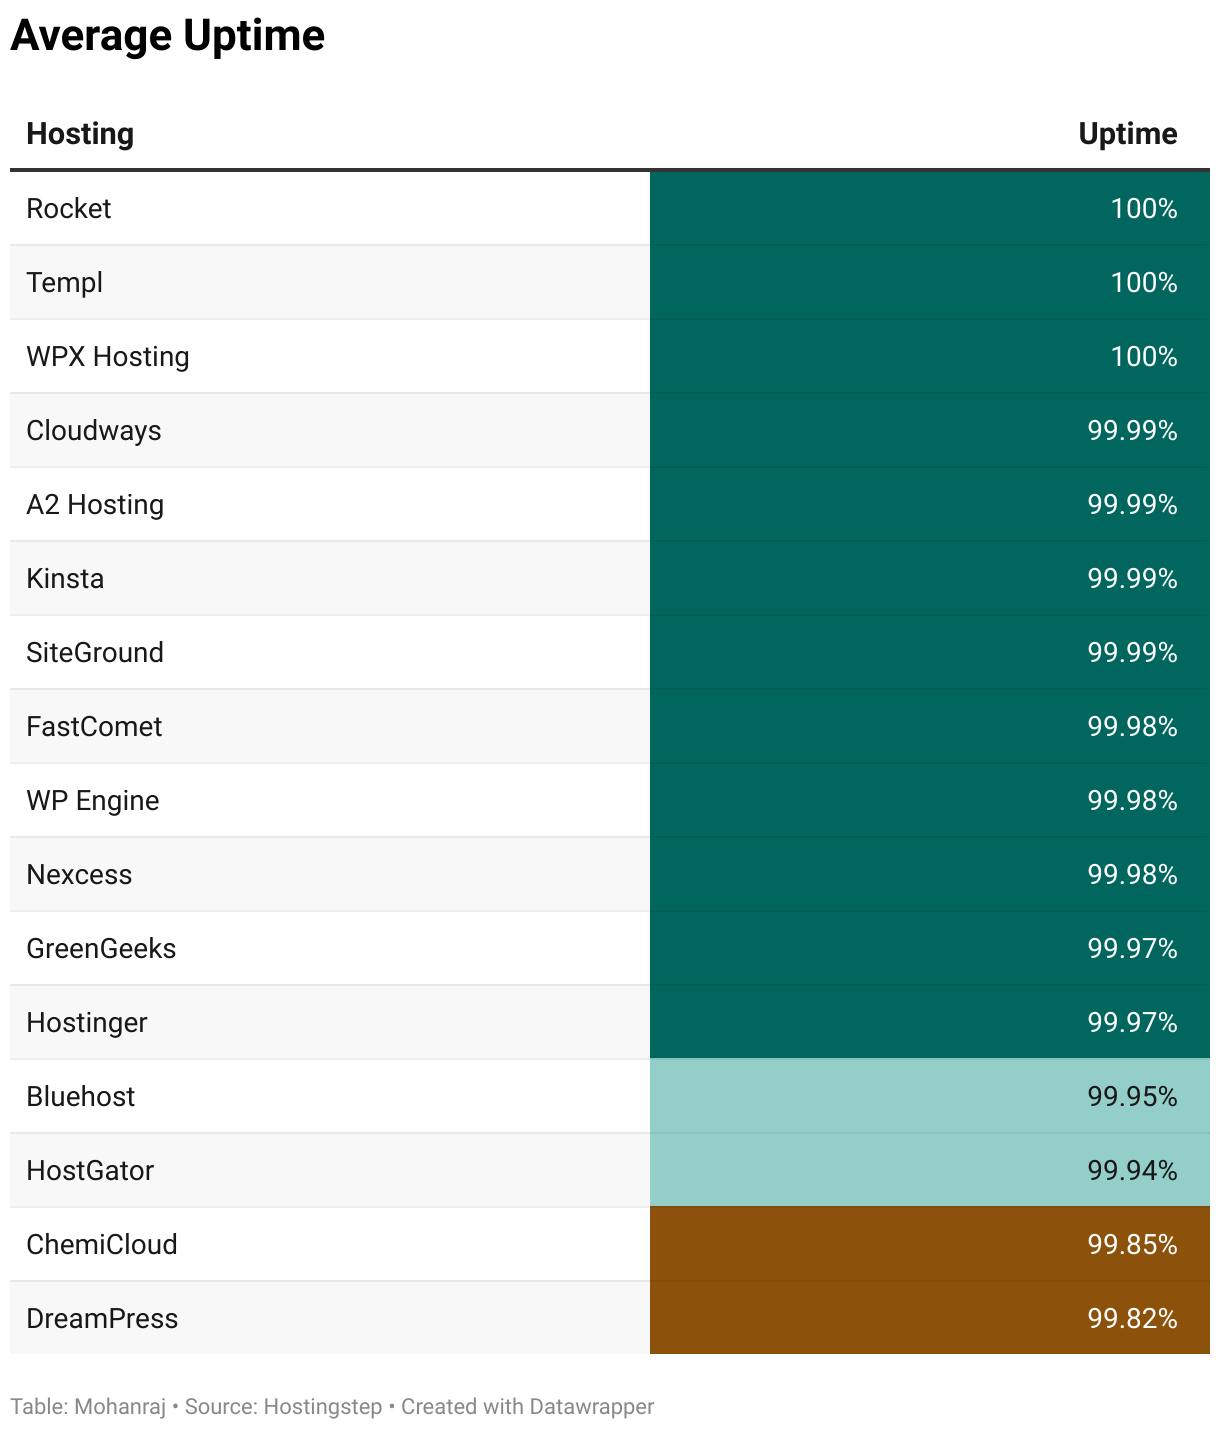
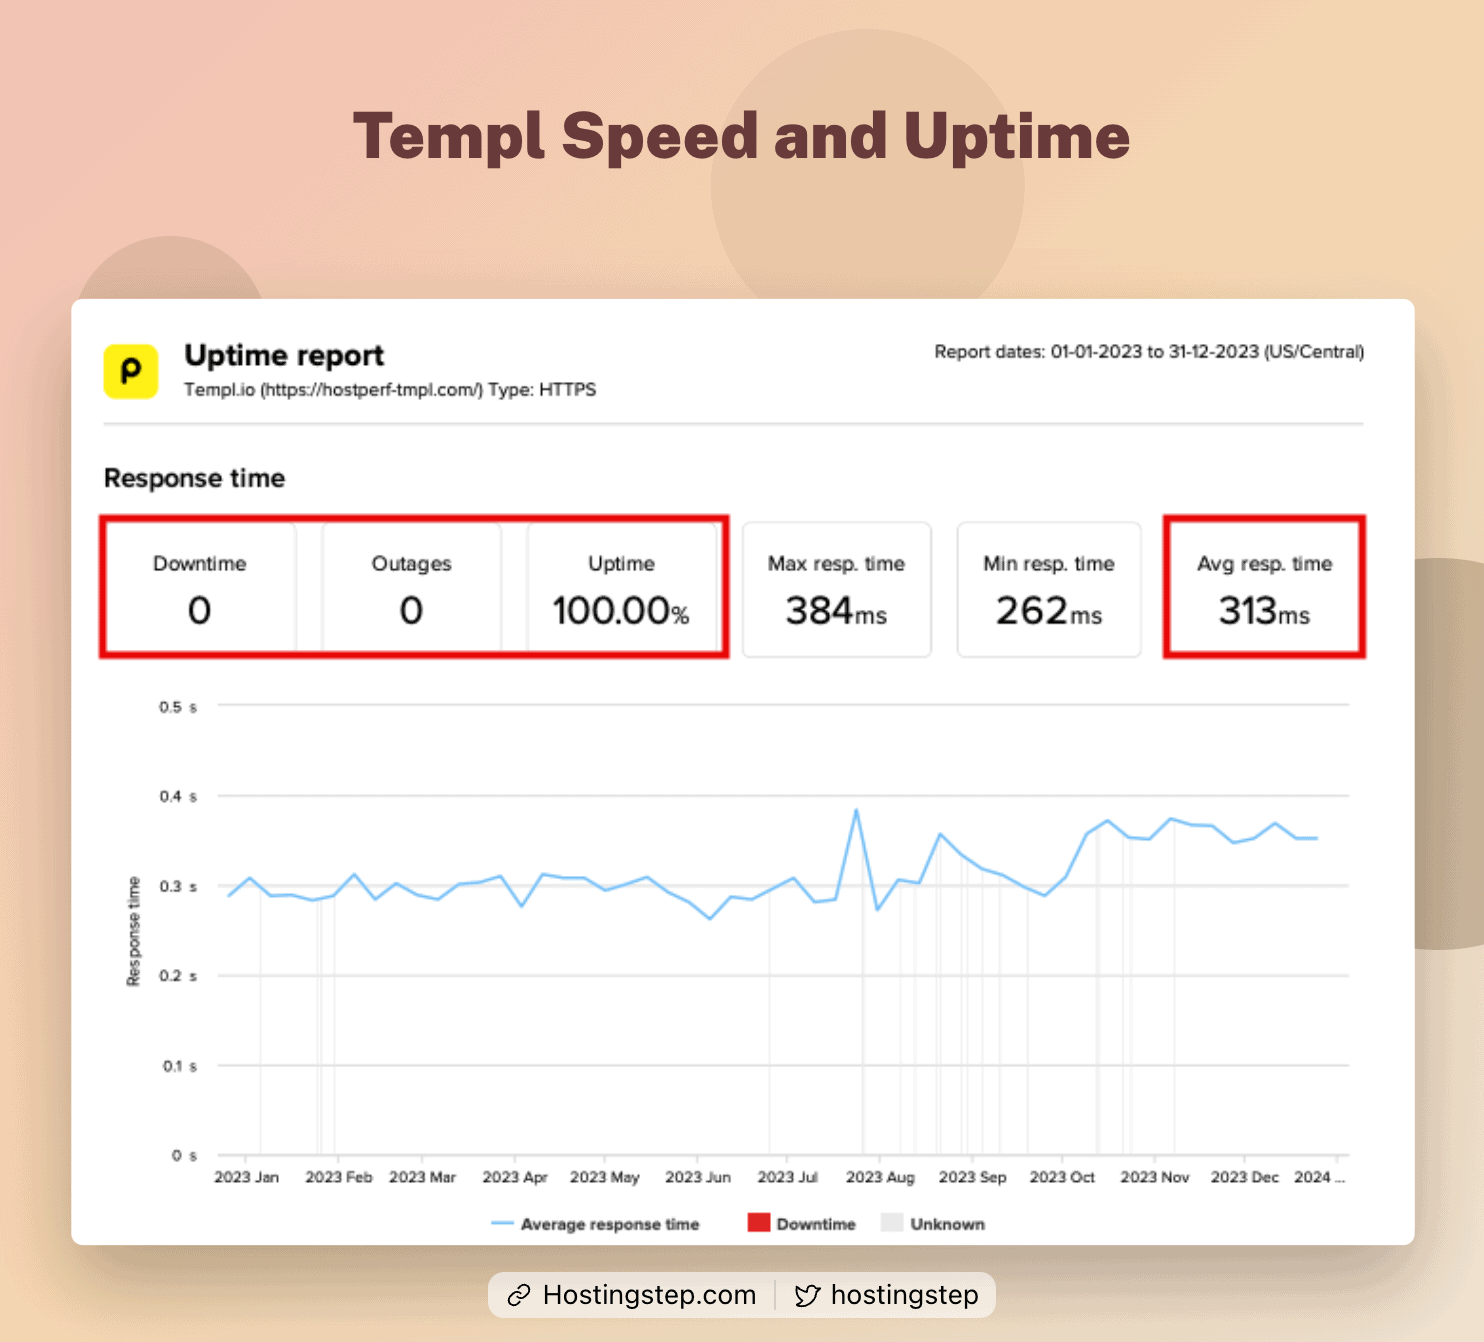
Rocket.net, Templ, and WPX recorded 100% uptime with zero downtime. Kinsta’s 99.99% uptime is also impressive, with just one outage.
Cloudways, A2 Hosting, and SiteGround are the other three hosts that recorded 99.99% uptime.
FastComet, WP Engine, and Nexcess recorded 99.98% uptime. Again, WP Engine is a bit disappointing as most other Managed WordPress hosts offered zero or lesser downtime.
GreenGeeks and Hostinger recorded 99.97% uptime. Bluehost and HostGator are nearly identical, with 99.95% and 99.94% uptime, respectively. ChemiCloud had unimpressive results.
DreamPress is a big disappointment because of its managed WordPress hosting tag, priced at $23.99/month yet merely delivers 99.82% uptime with nearly 16 hours downtime.
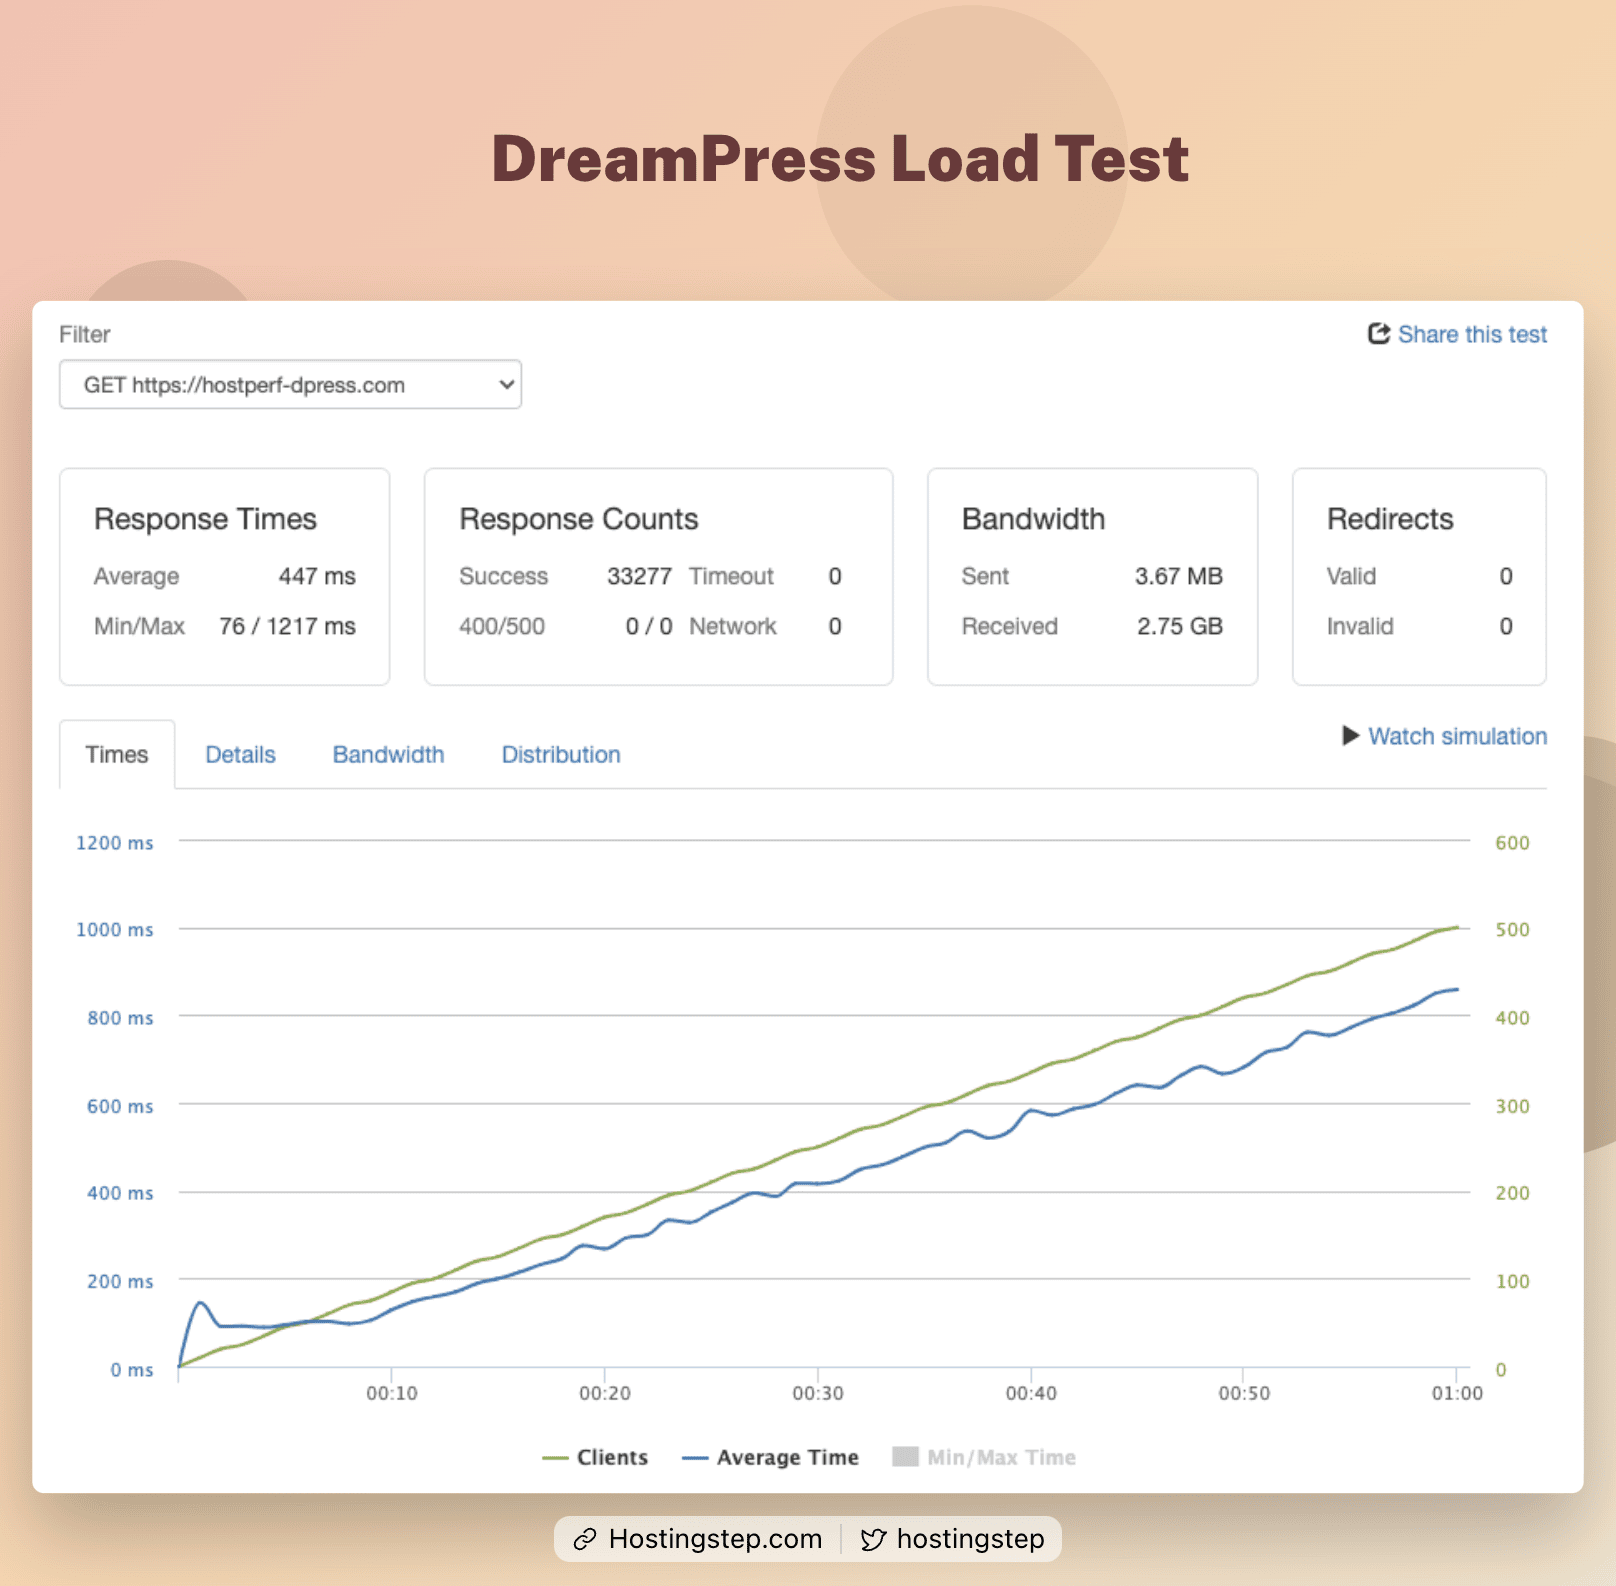
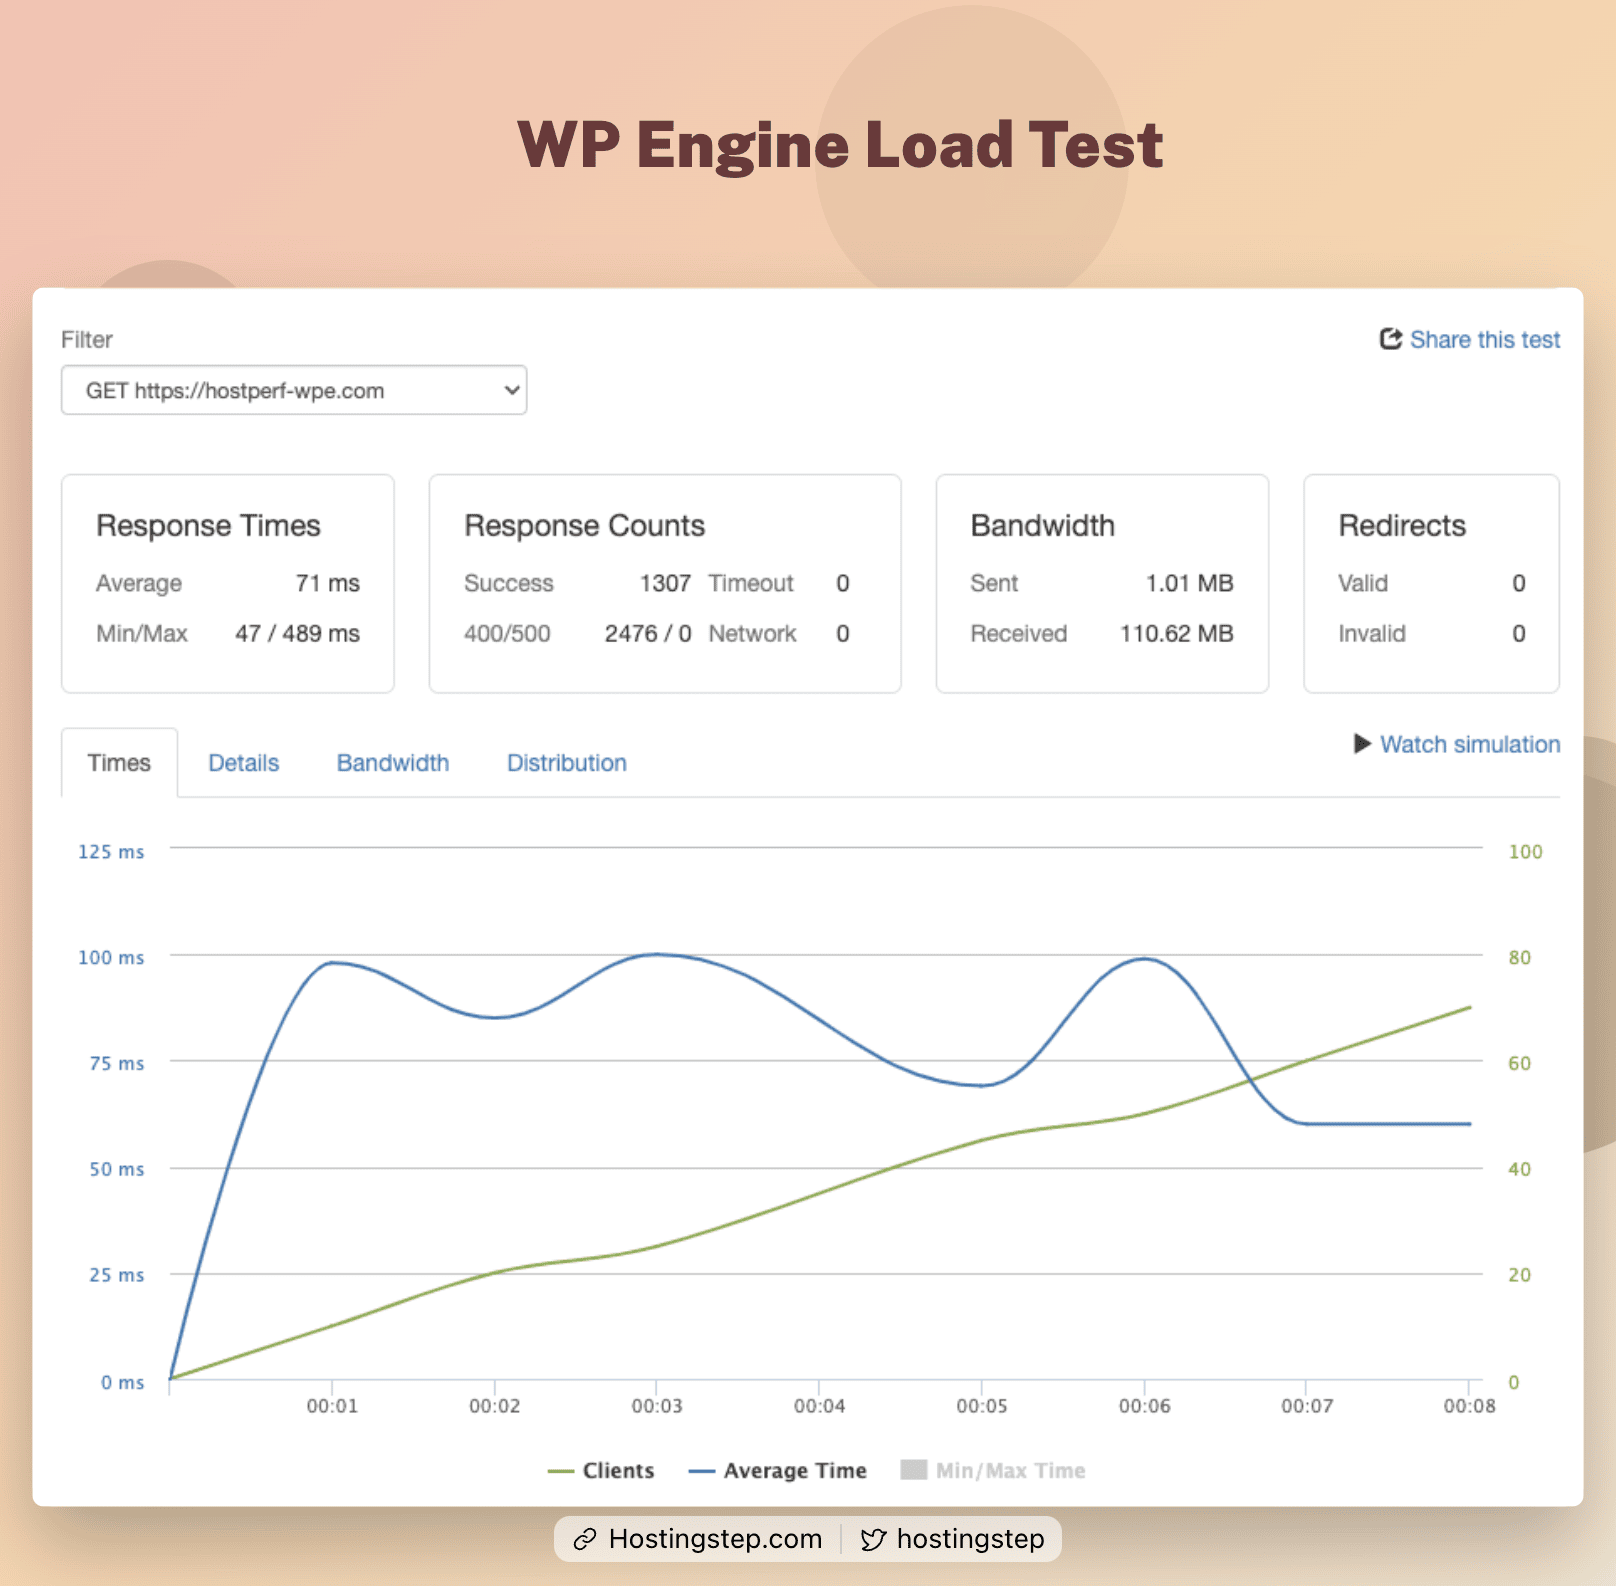
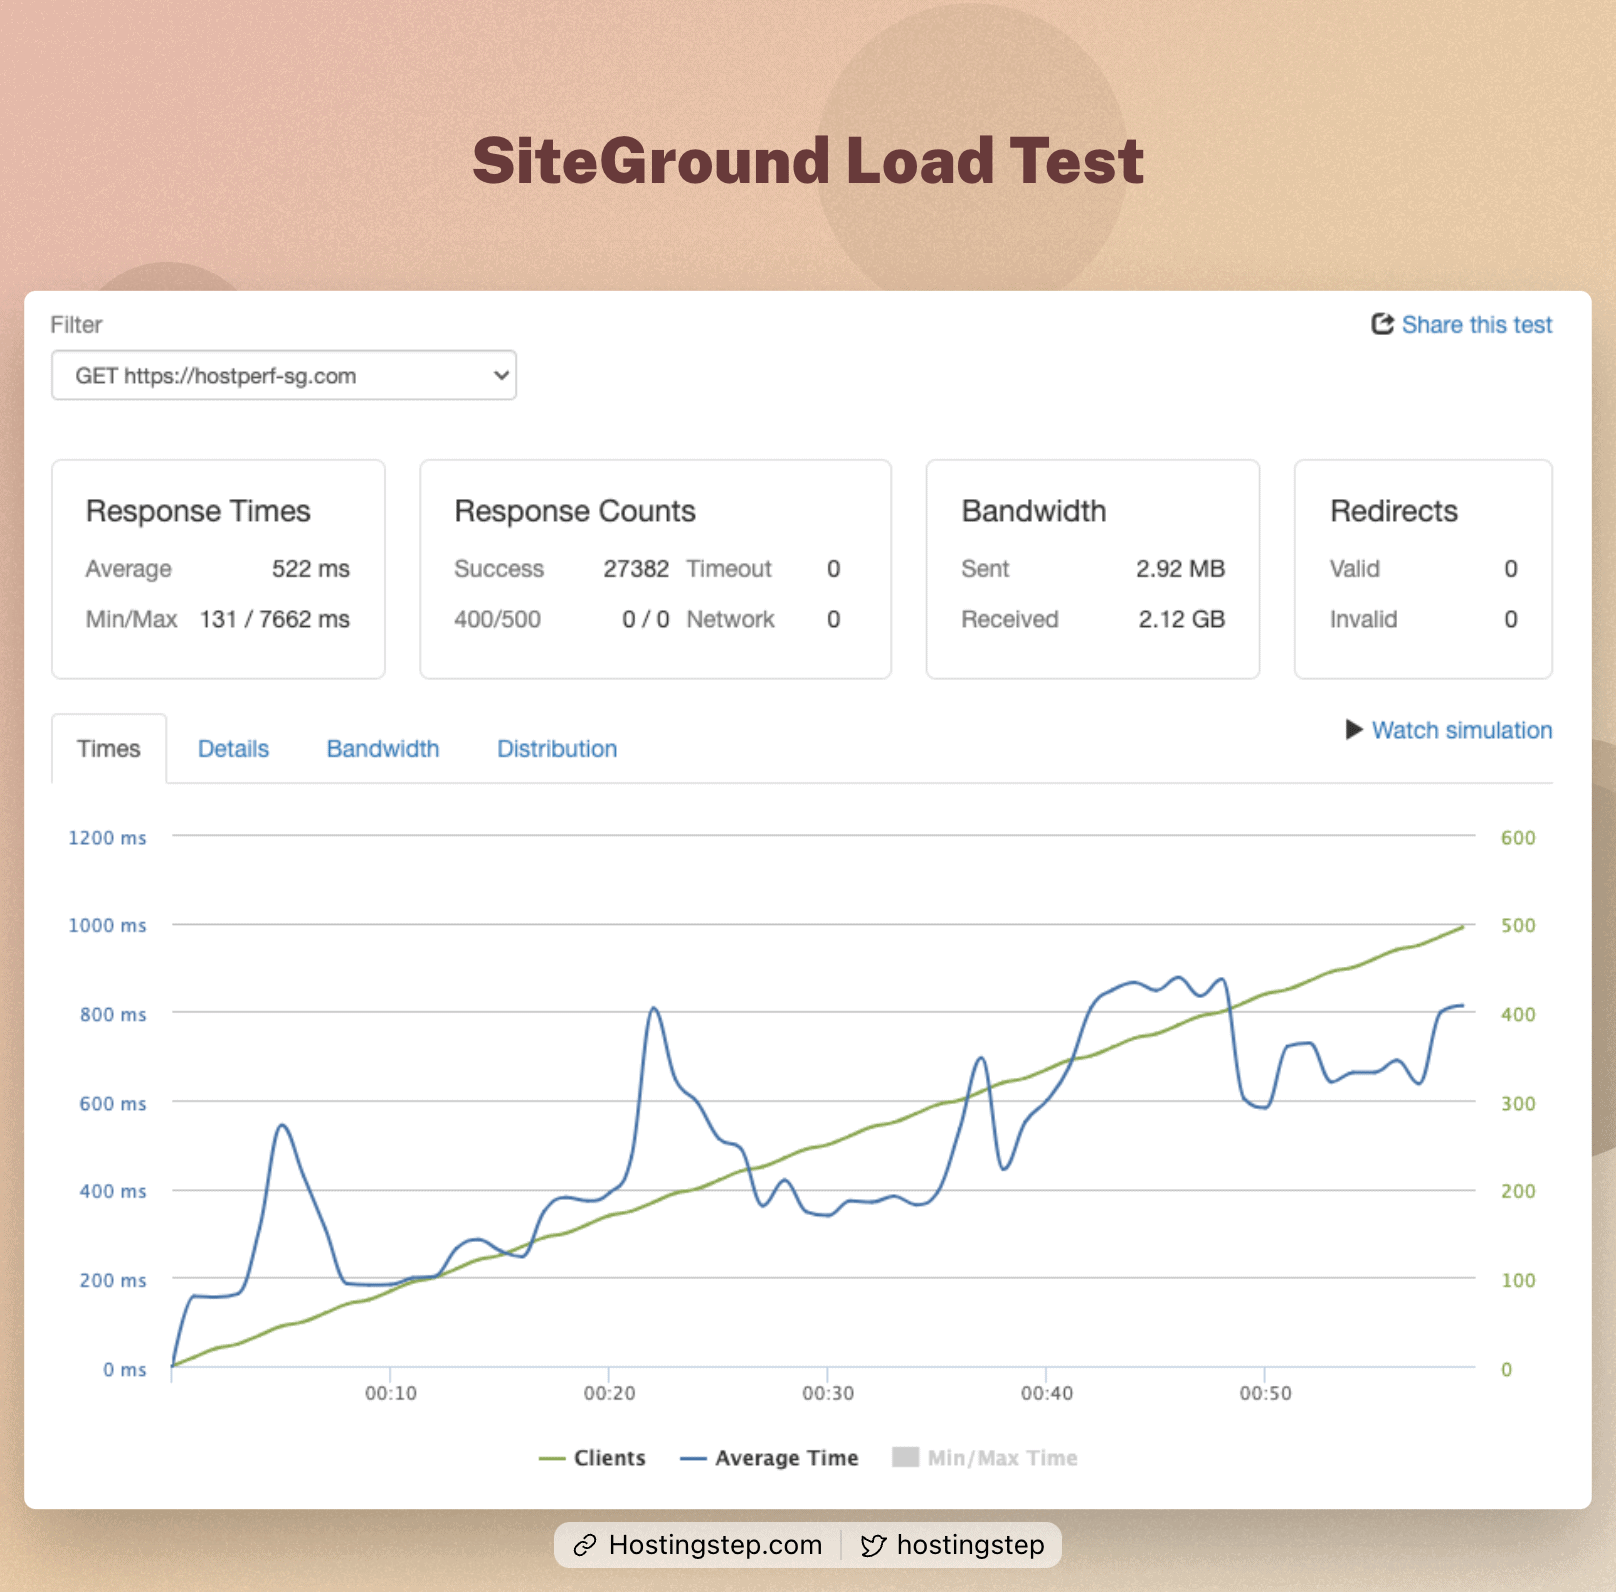
Benchmark Test 3 – Load Testing
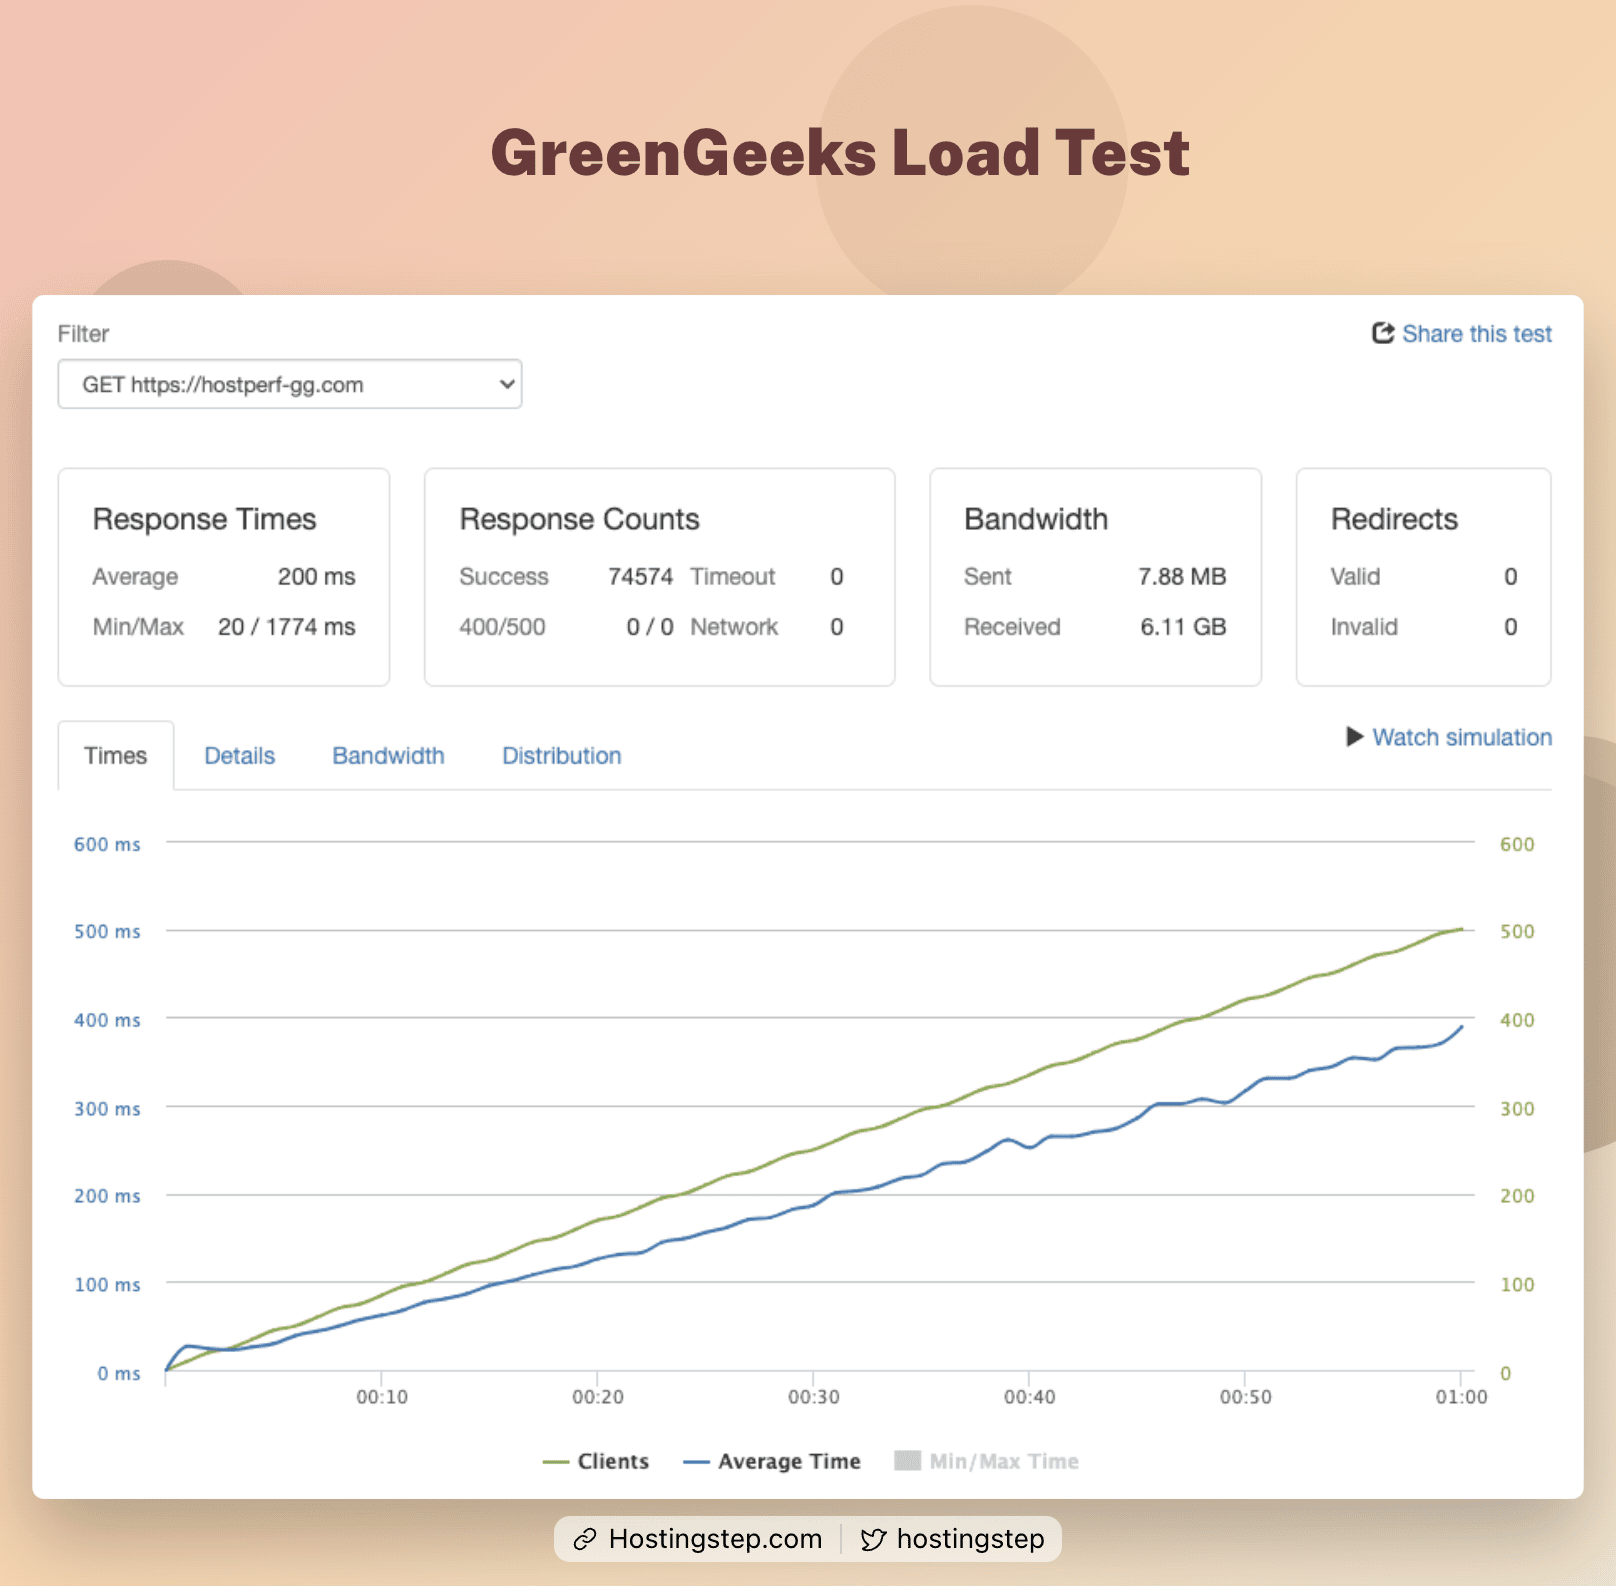
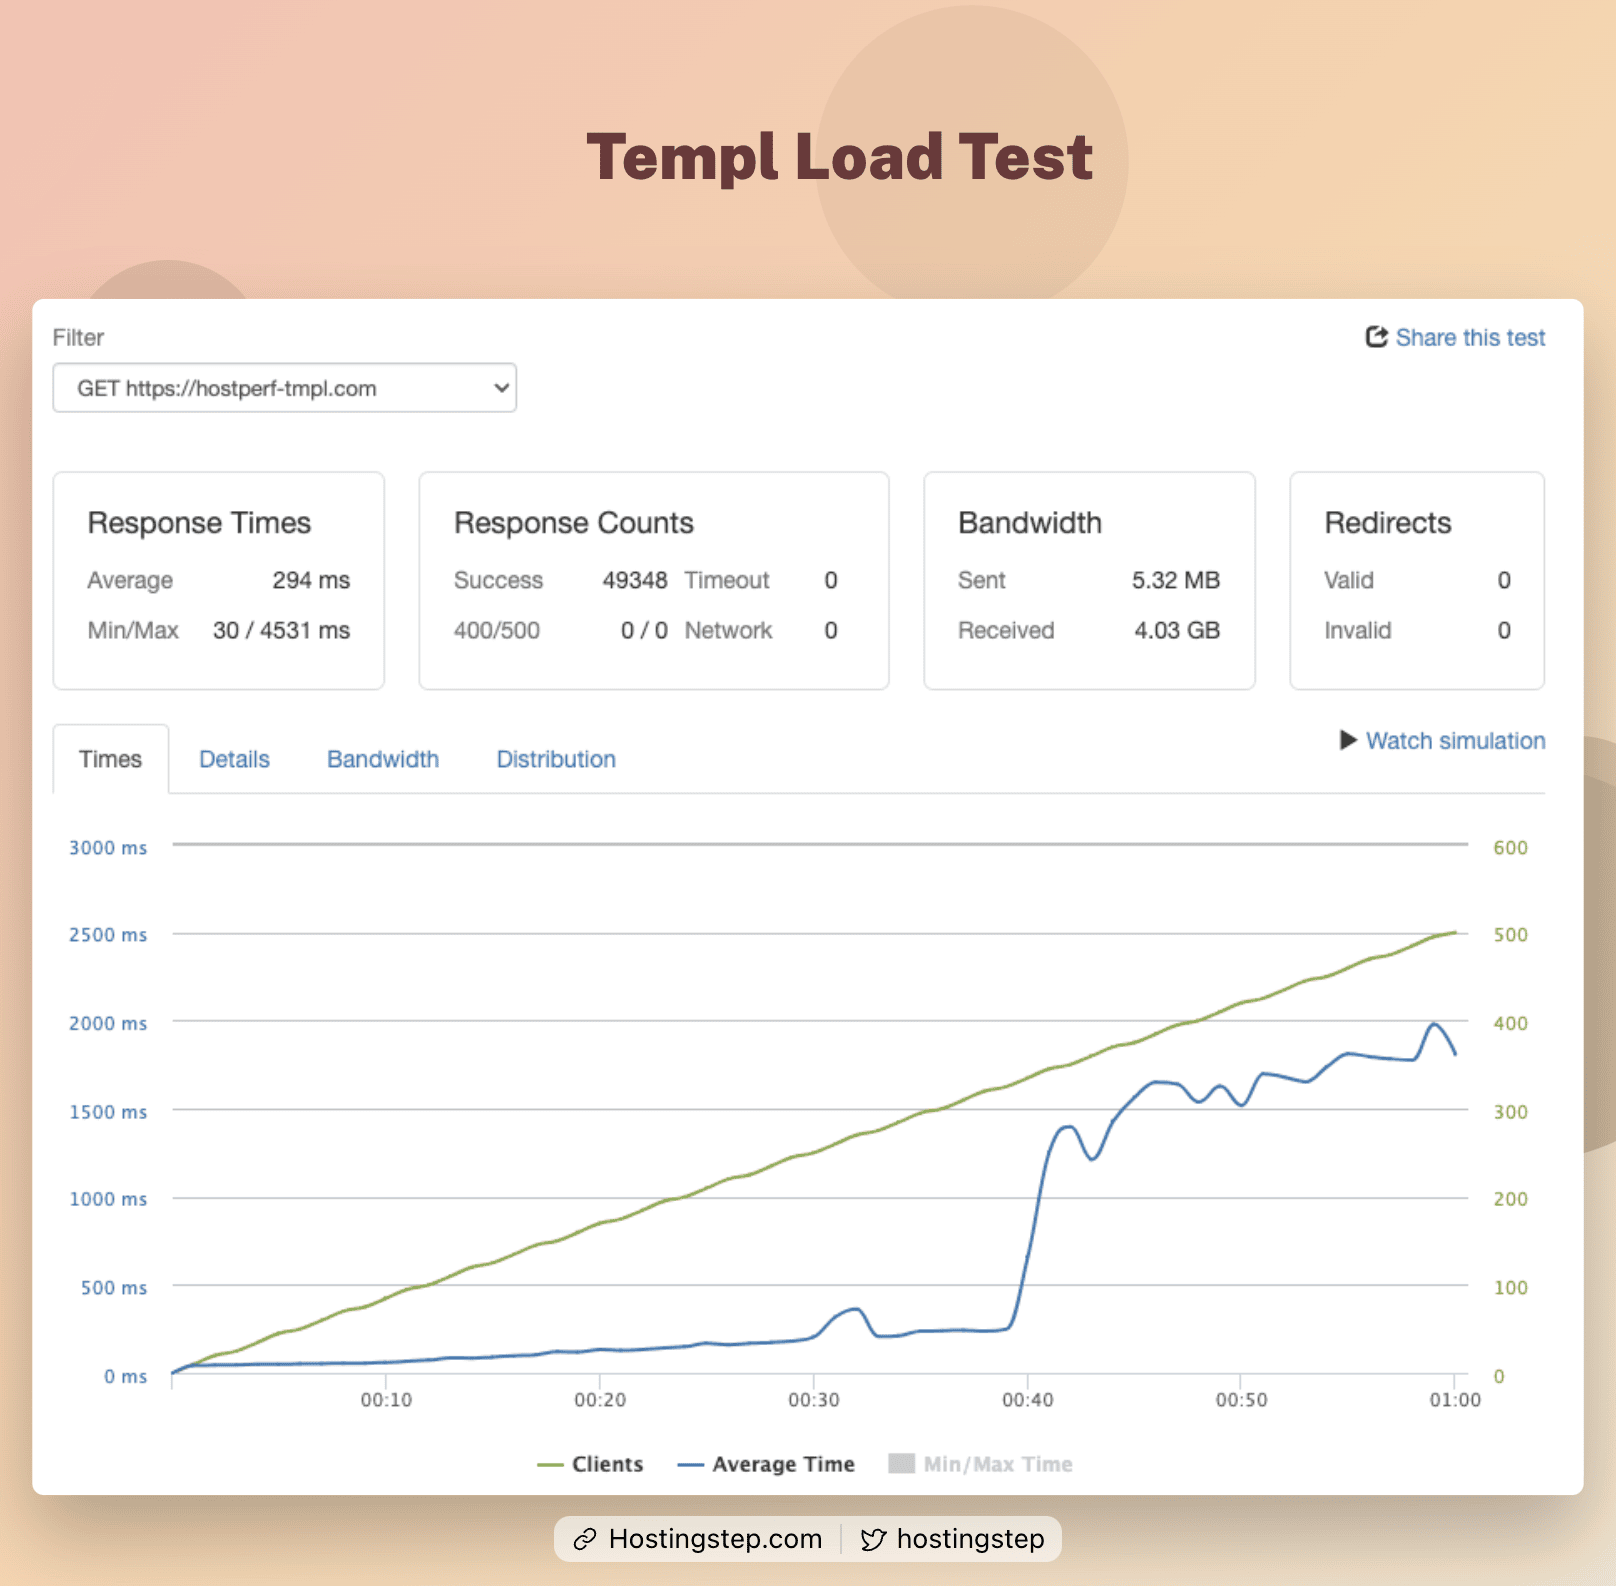
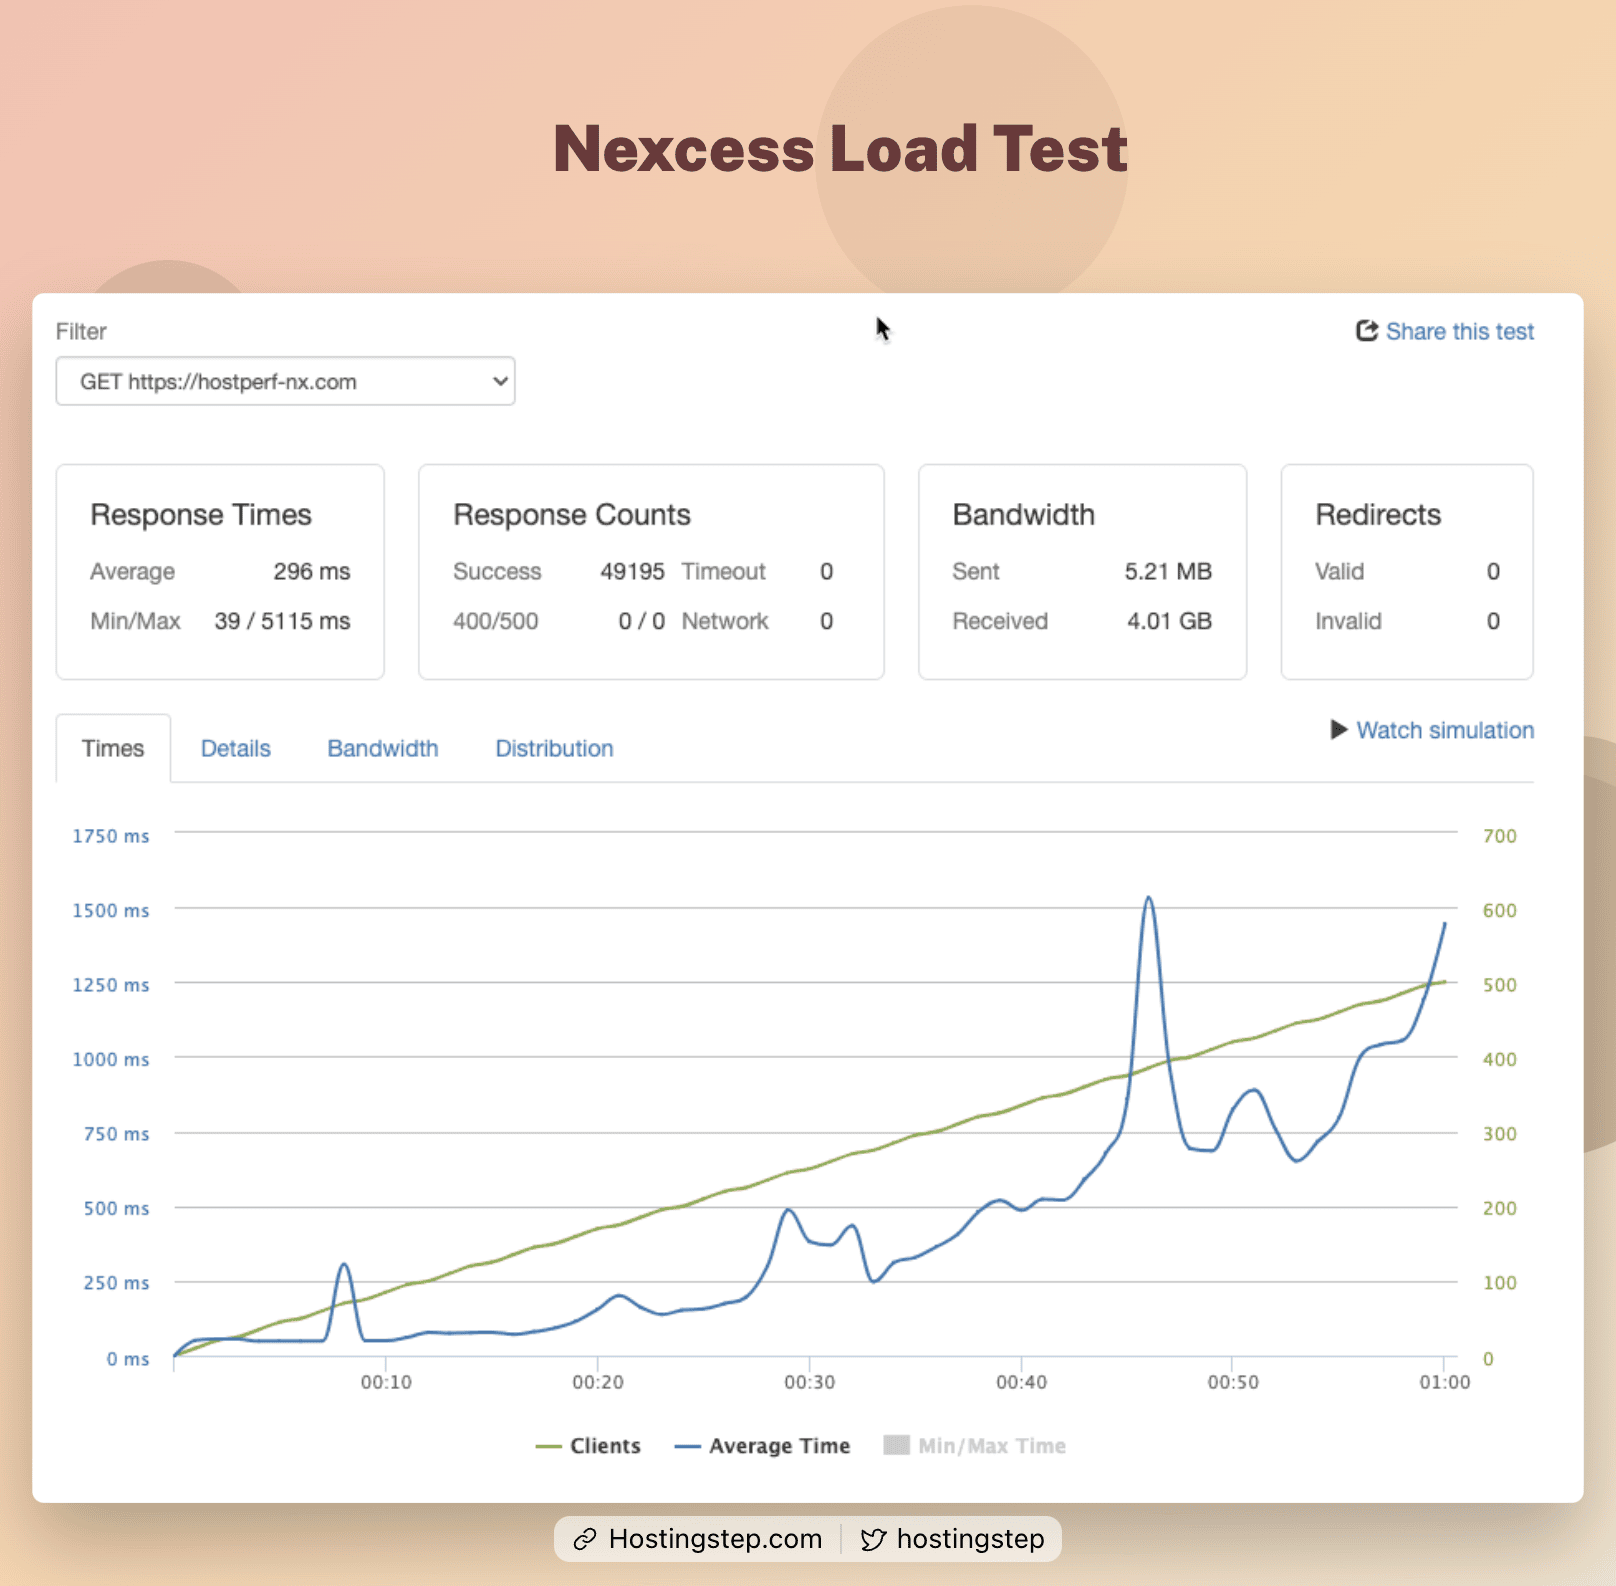
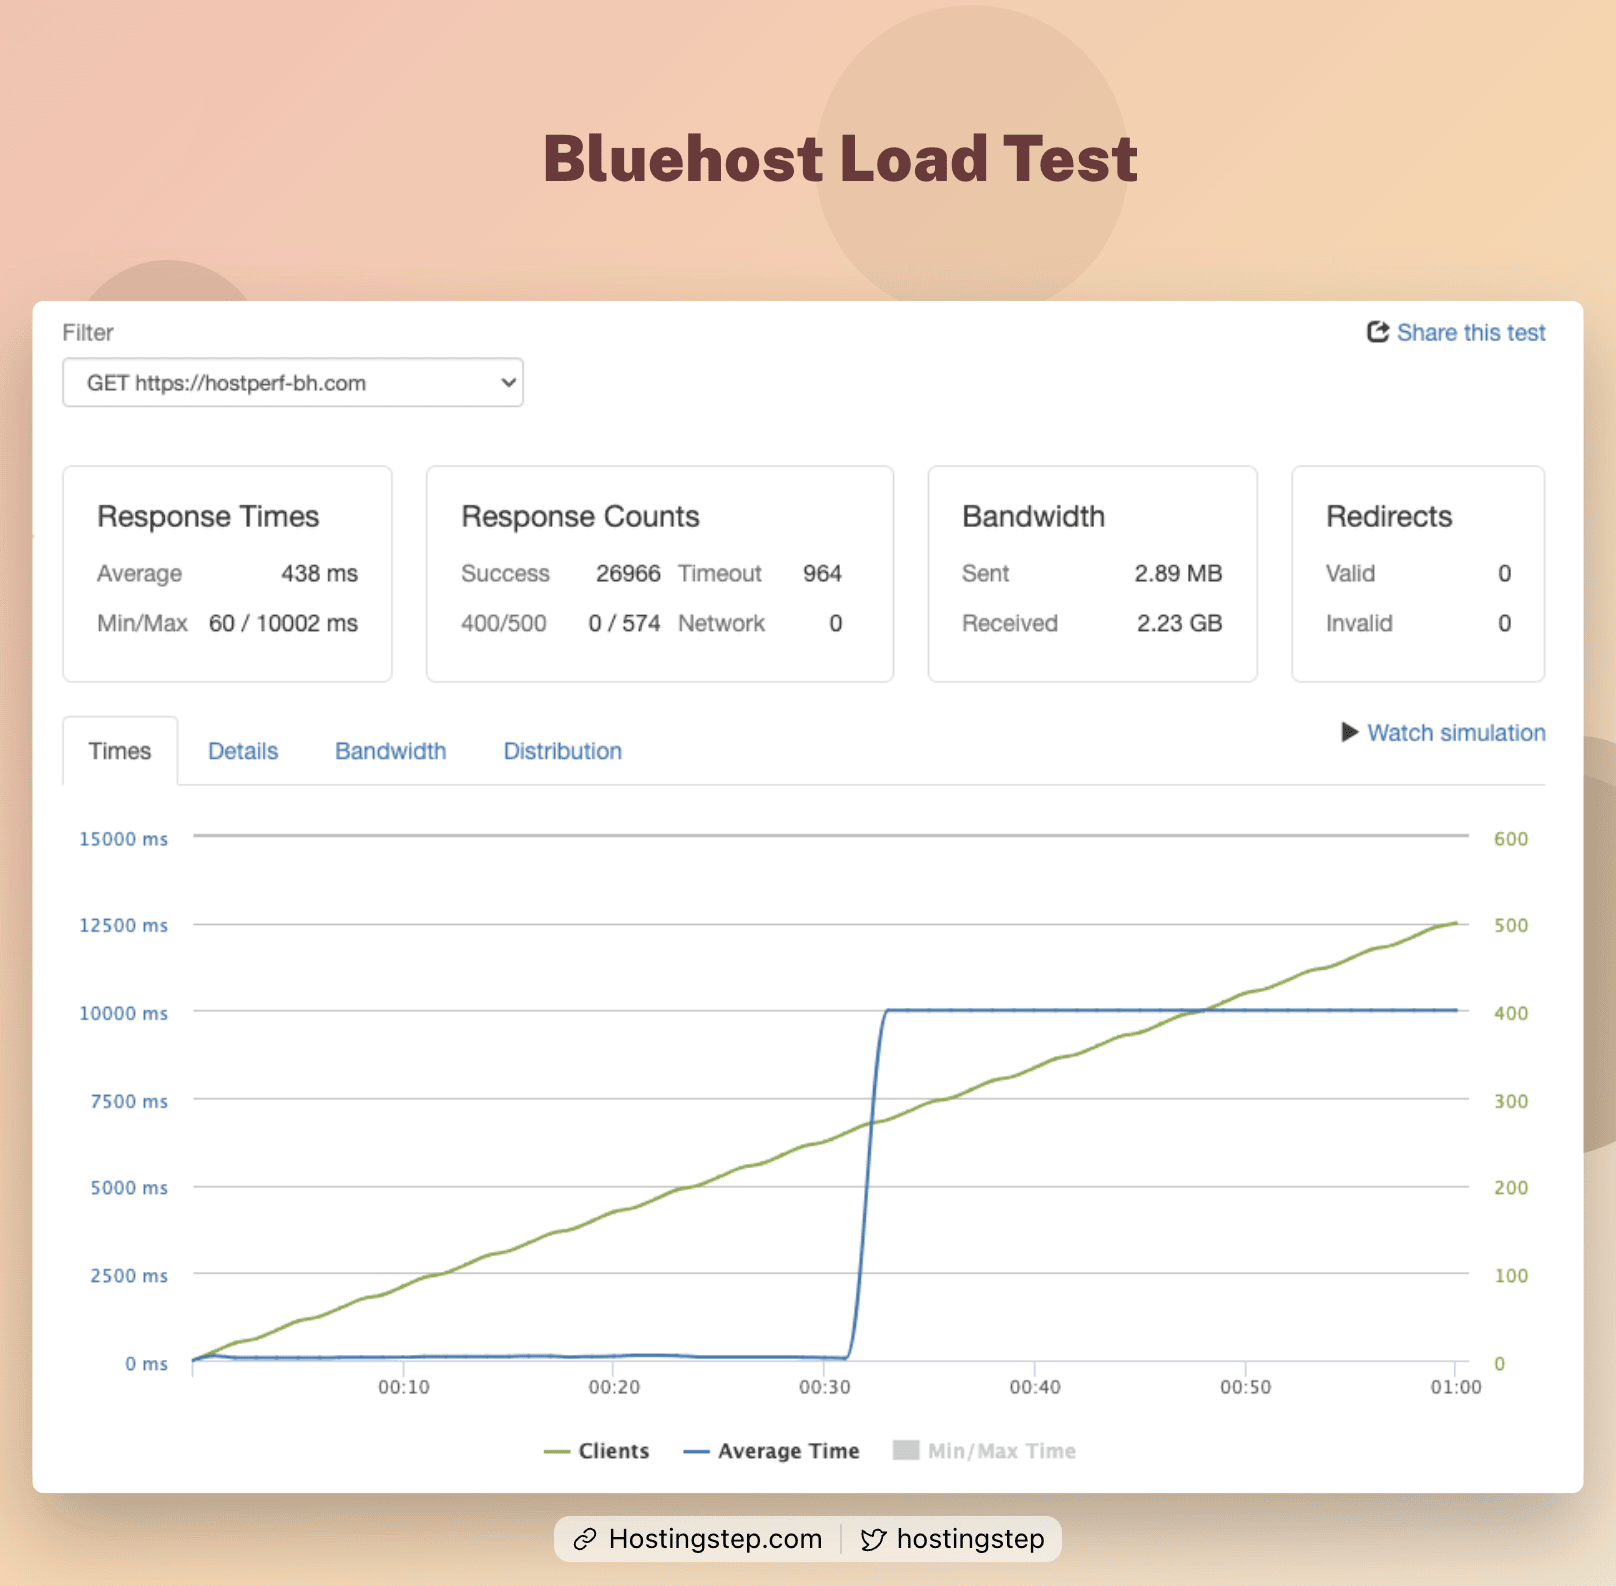
The load testing measures how well the sites can handle the bulk traffic. In this test, 500 Constant client load visitors are sent to the site, and the average response time is calculated. (lower the response time faster the servers)
Results
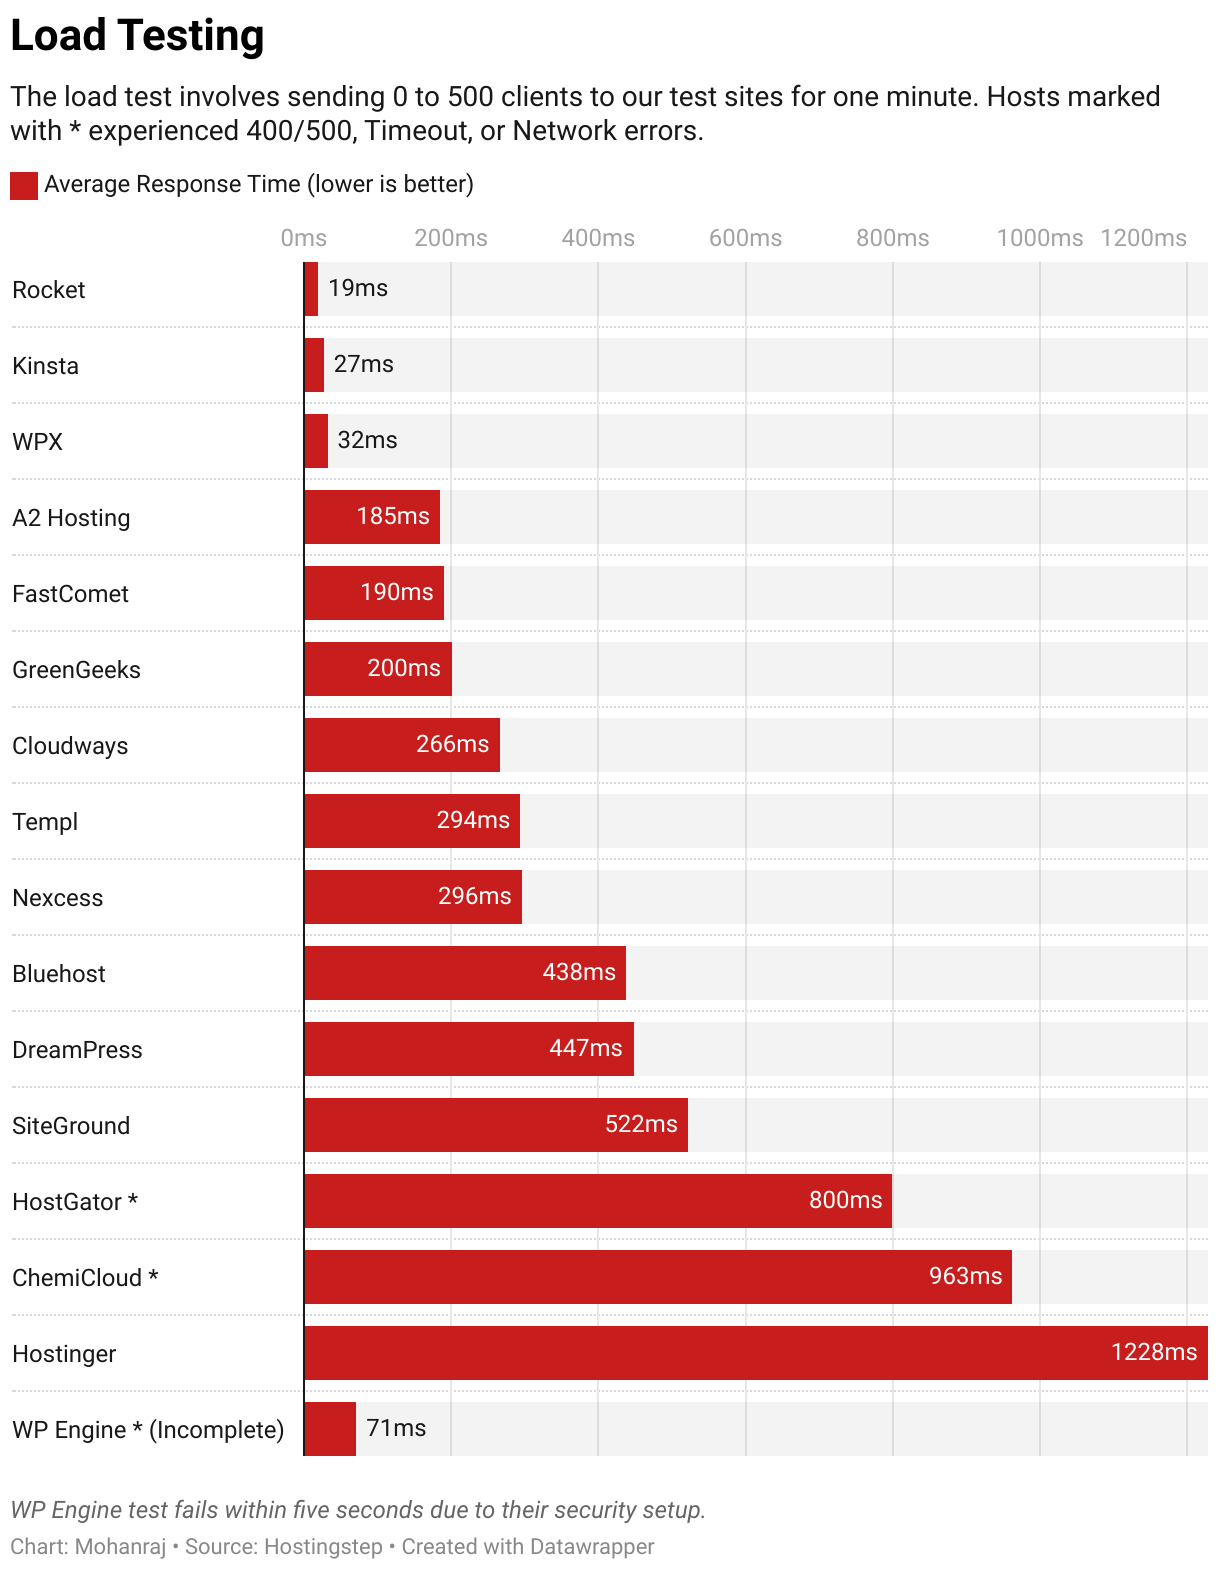
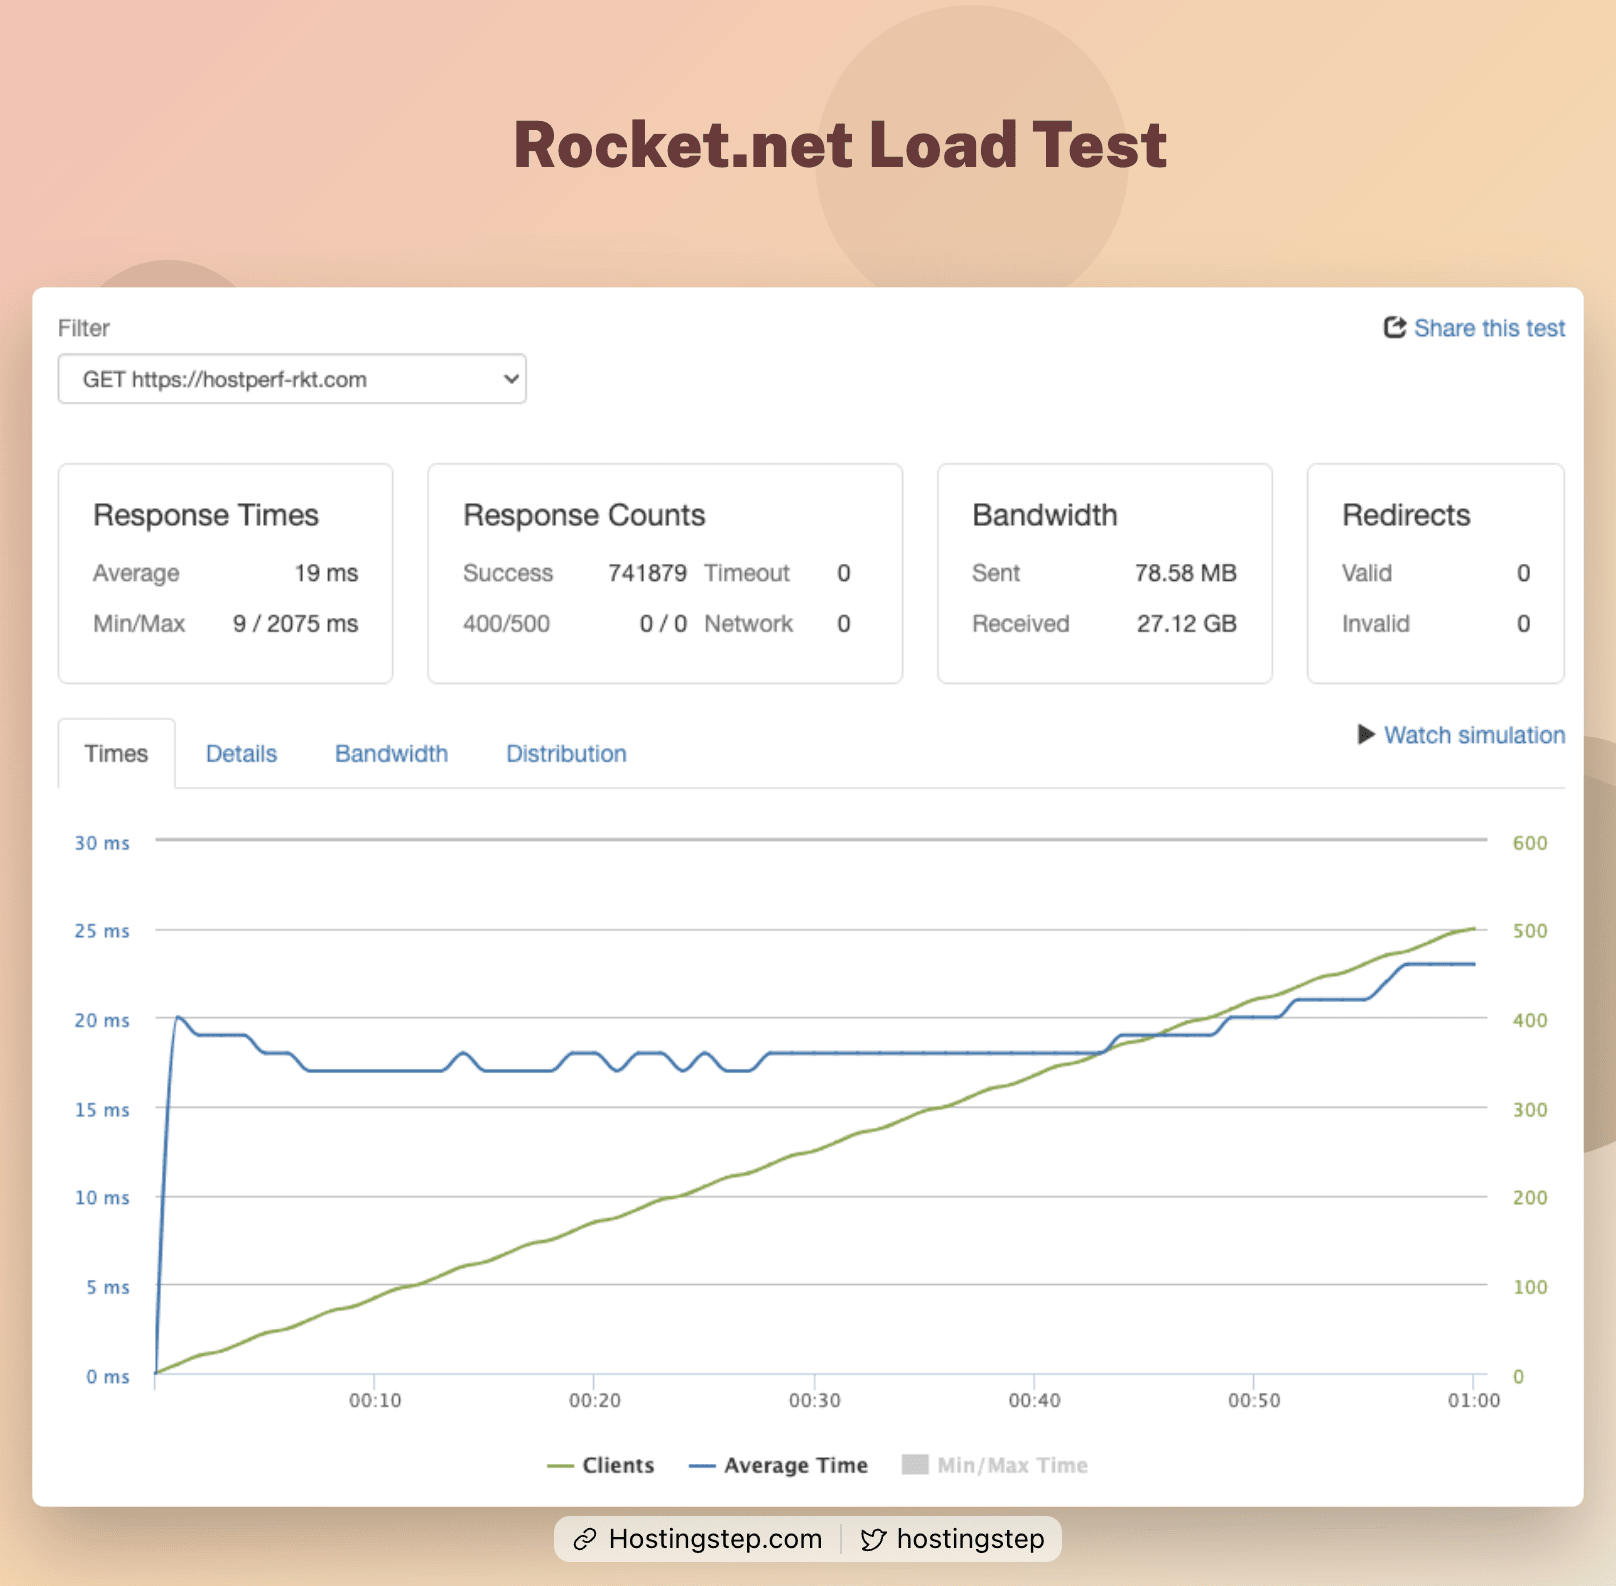

Rocket.net again topped the charts with an average response time of 19ms. The graph is pleasing to watch as the response time remains consistent despite increasing load.
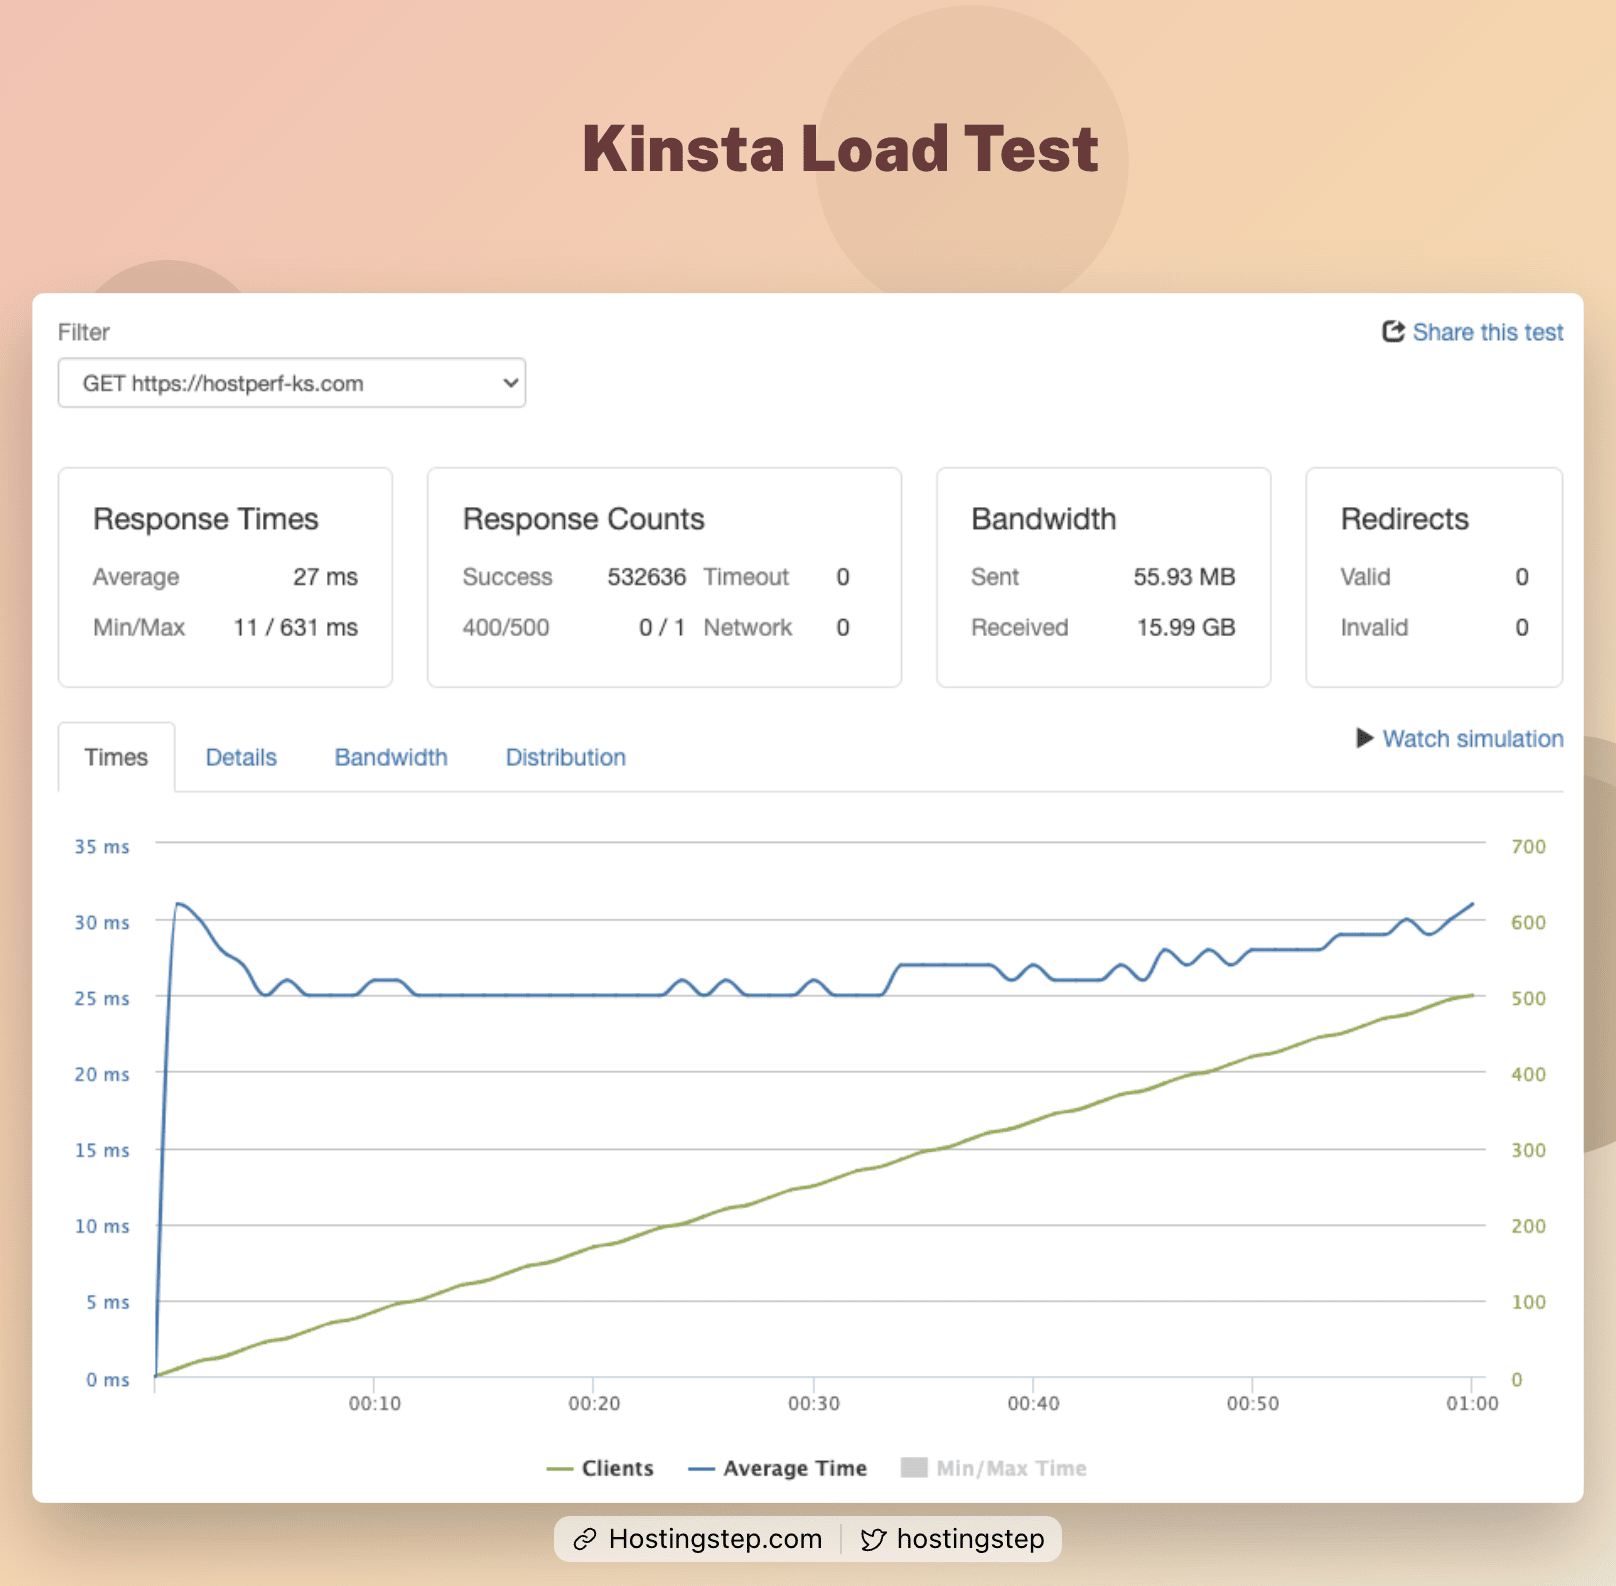
Kinsta took the second spot with 27 ms, although I would like to rate them at the top spot as their maximum response time is 631 ms, while Rocket’s maximum response time is 2075 ms.
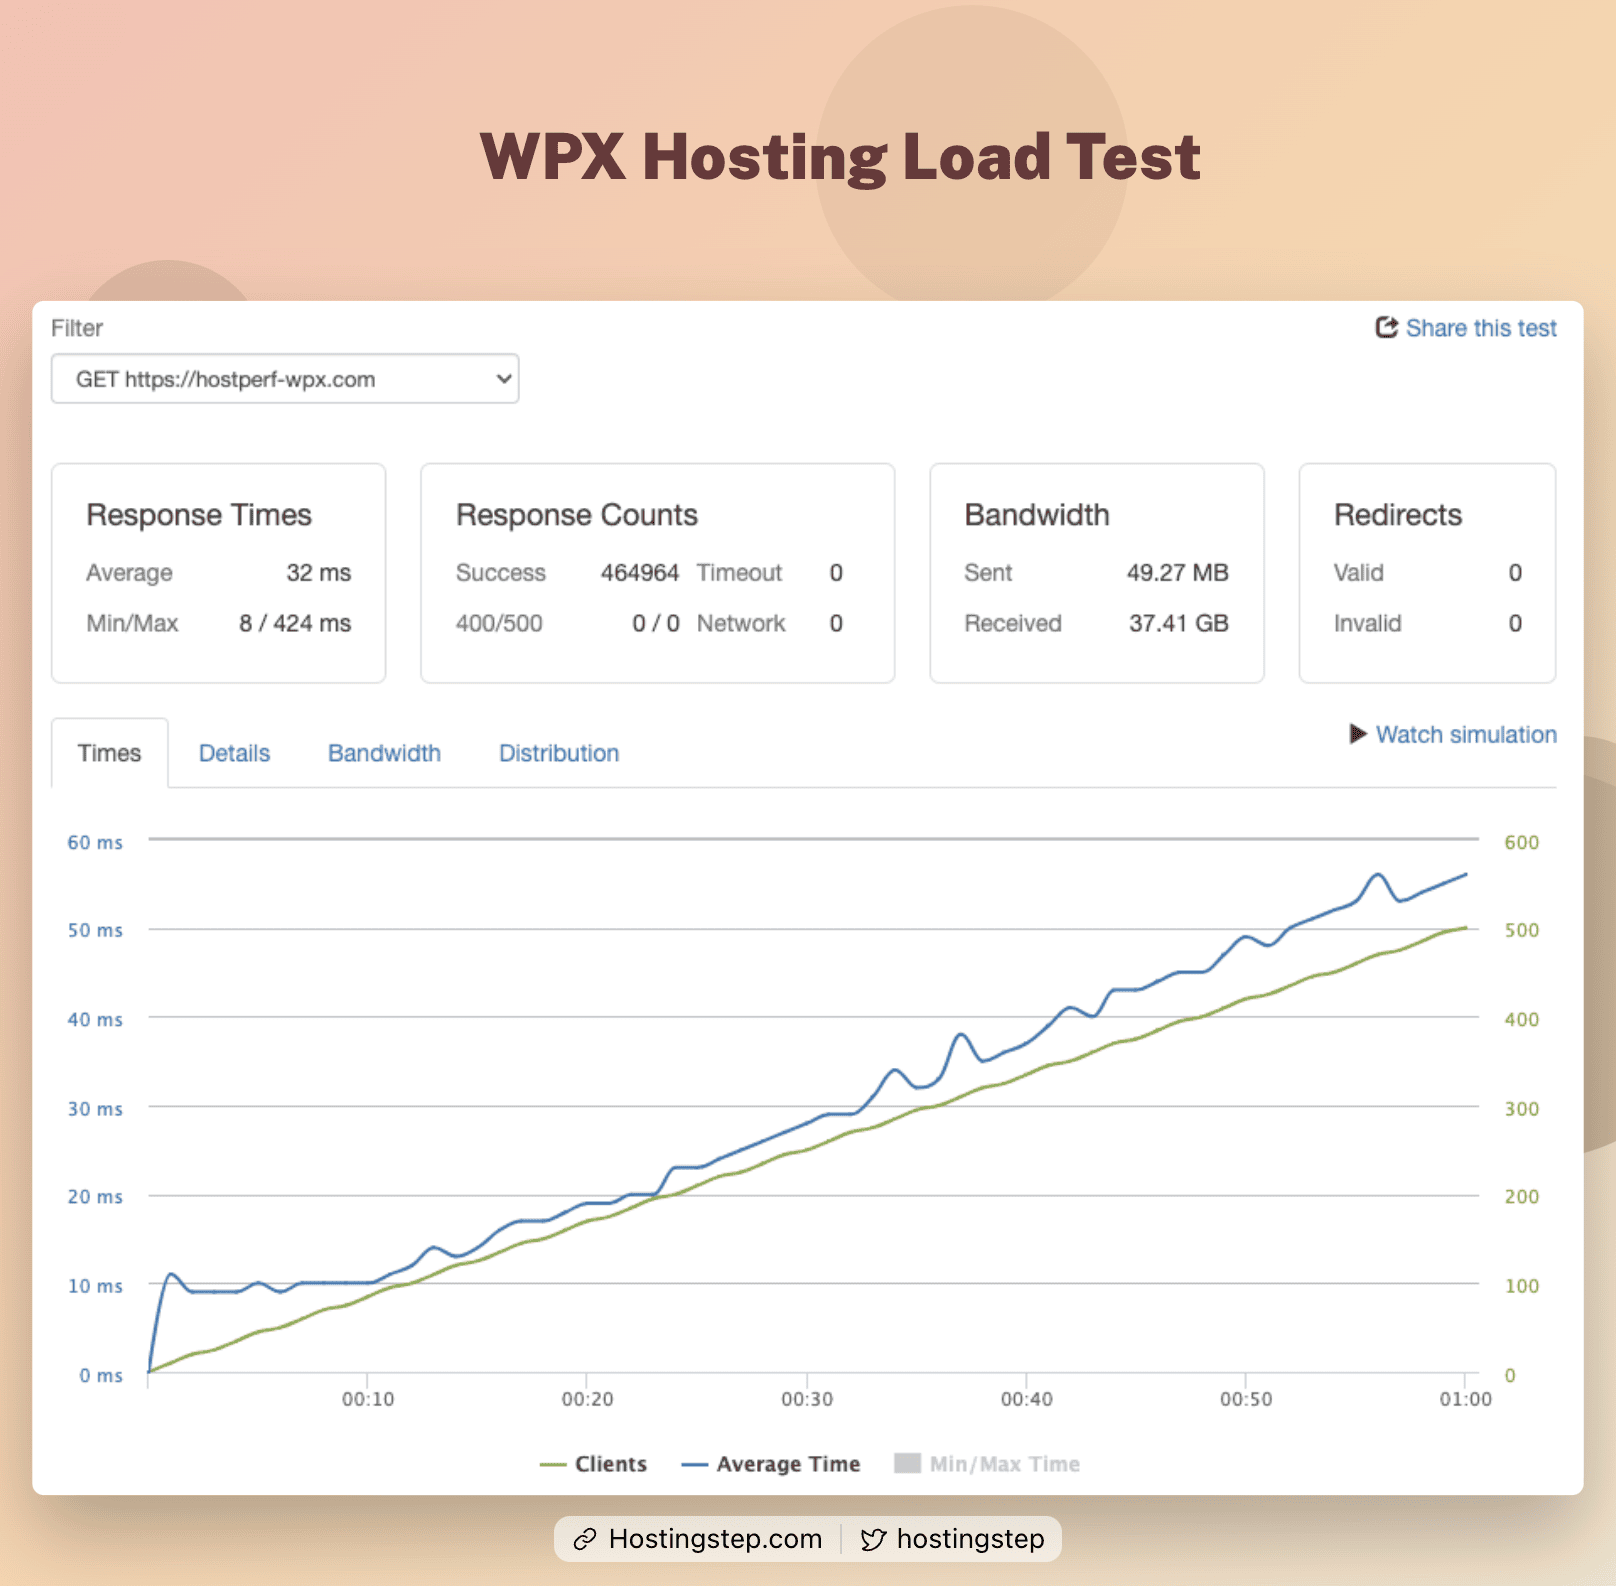
WPX is again impressive with a 32 ms response time. The graph looks good, and it had the lowest maximum response time (424 ms) among all the hosts we tested.
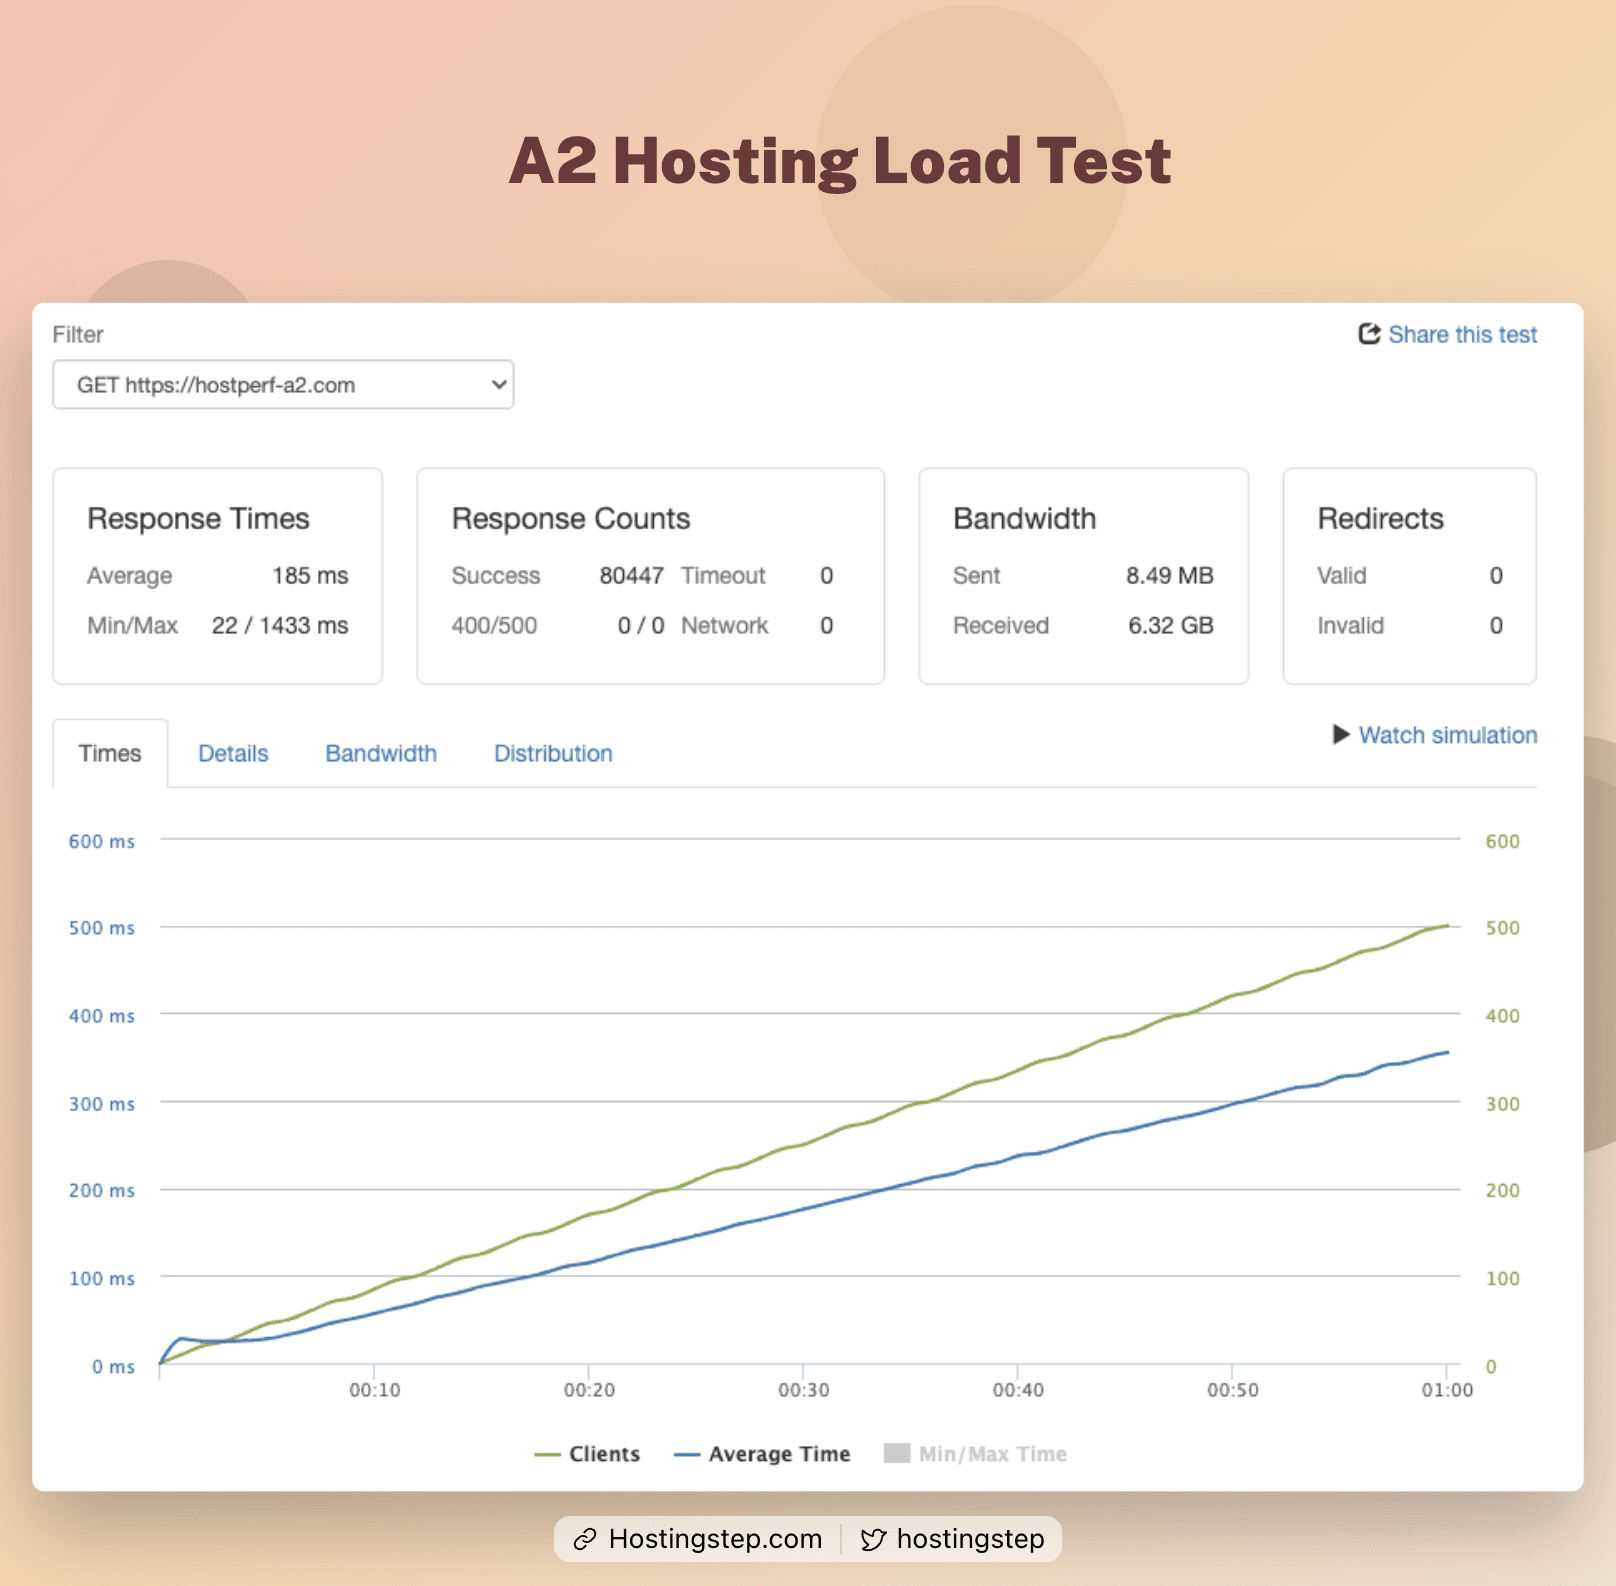
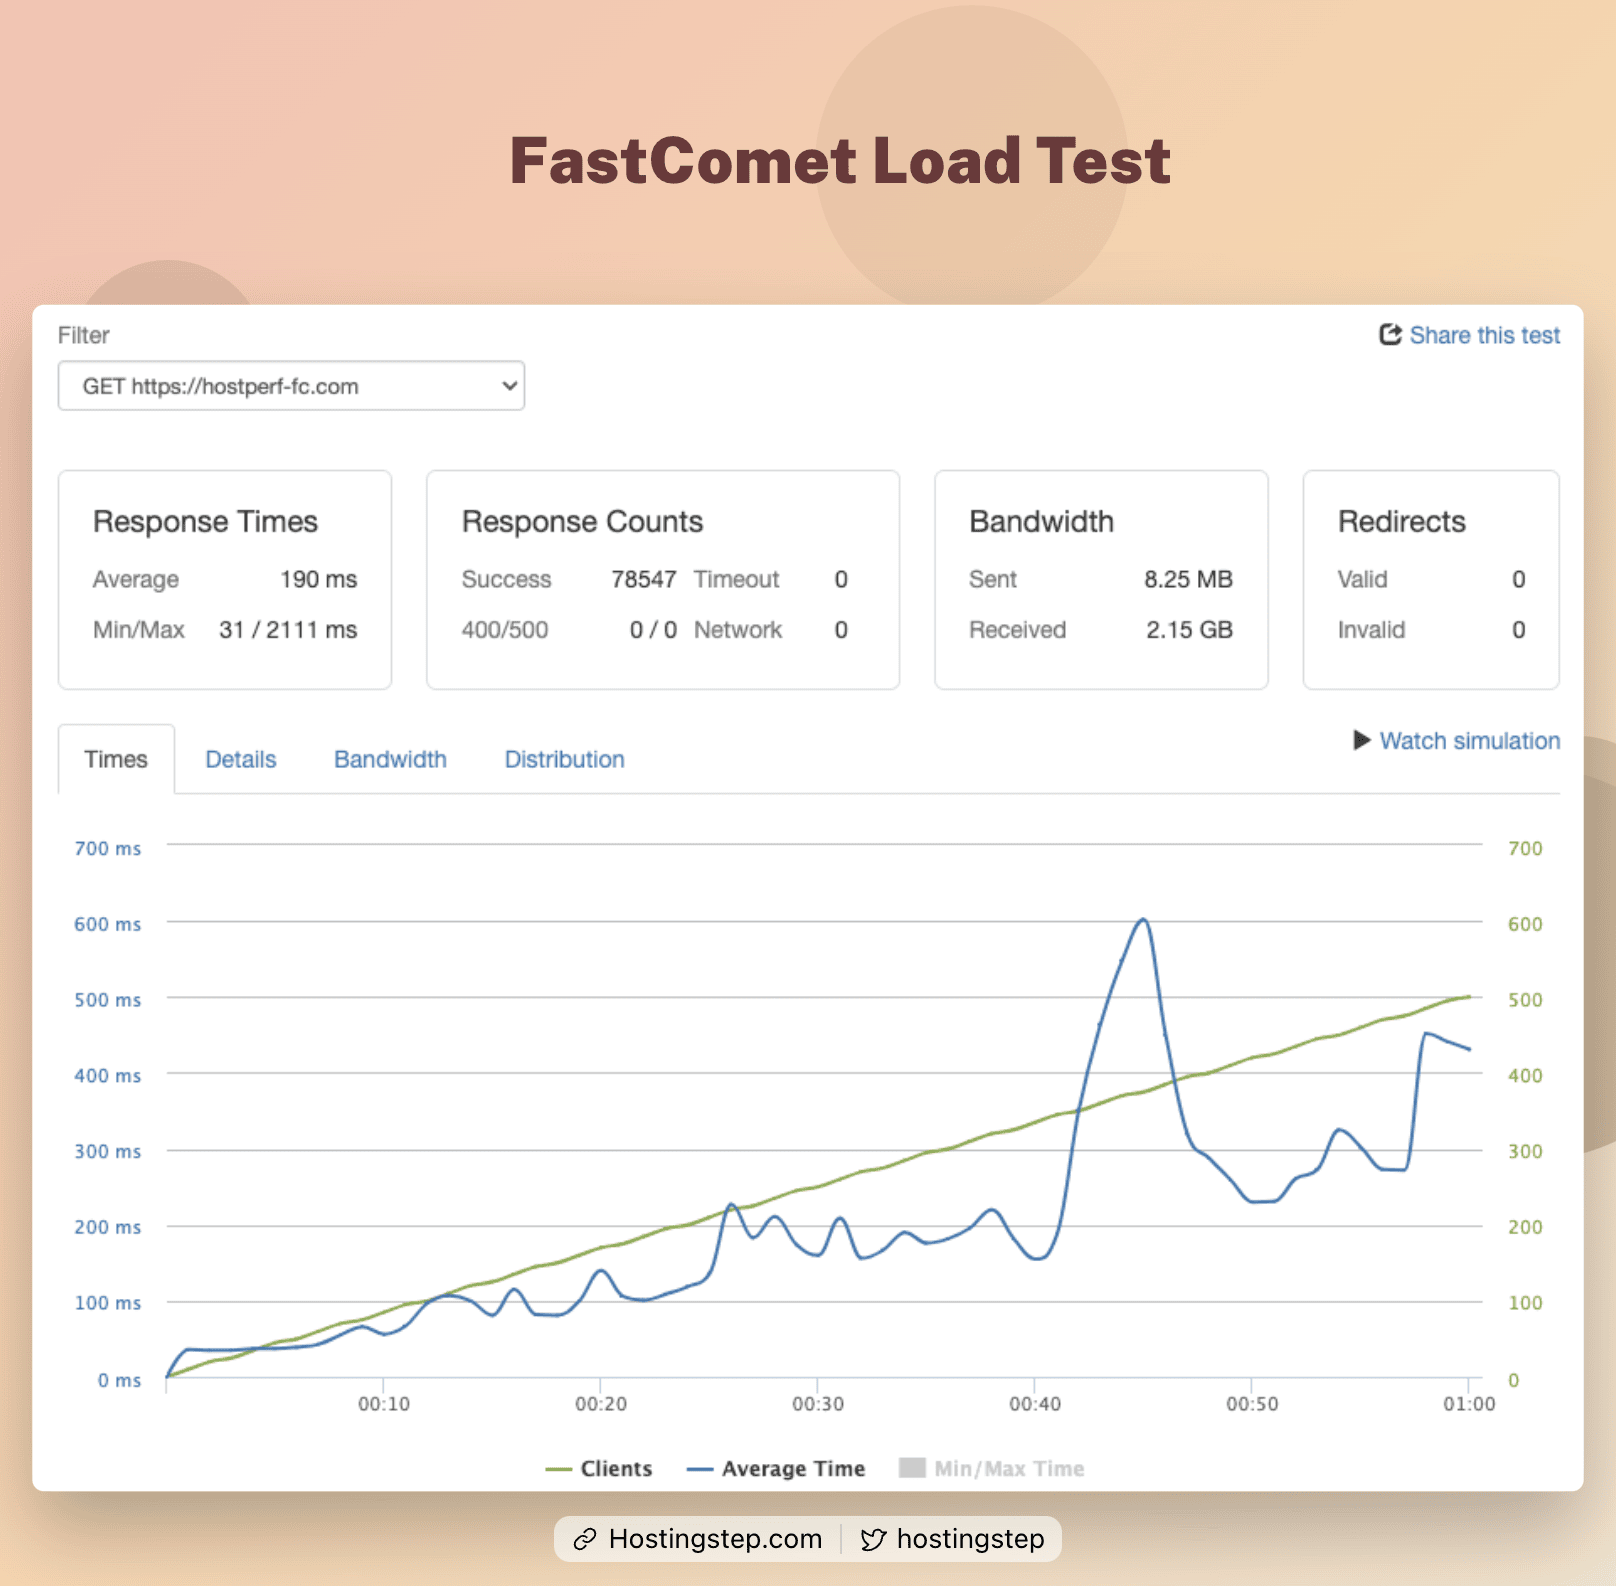
SiteGround comes fourth with a response time of 179 ms. A2 Hosting, FastComet, and GreenGeeks recorded 185 ms, 190 ms, and 200 ms, respectively. It’s good that these shared hosting services performed better than many managed WordPress hosting services in the list.
Cloudways, Templ, and Nexcess, followed with 266 ms, 294 ms, and 296 ms, respectively. These hosts handled all the load with no timeout or network errors.
Bluehost recorded a 438 ms response time, which looks great, but they have a bunch of Timeout and 400/500 errors. DreamPress again recorded an average score of 447 ms. SiteGround again recorded an average performance in load testing with 522 ms response time.
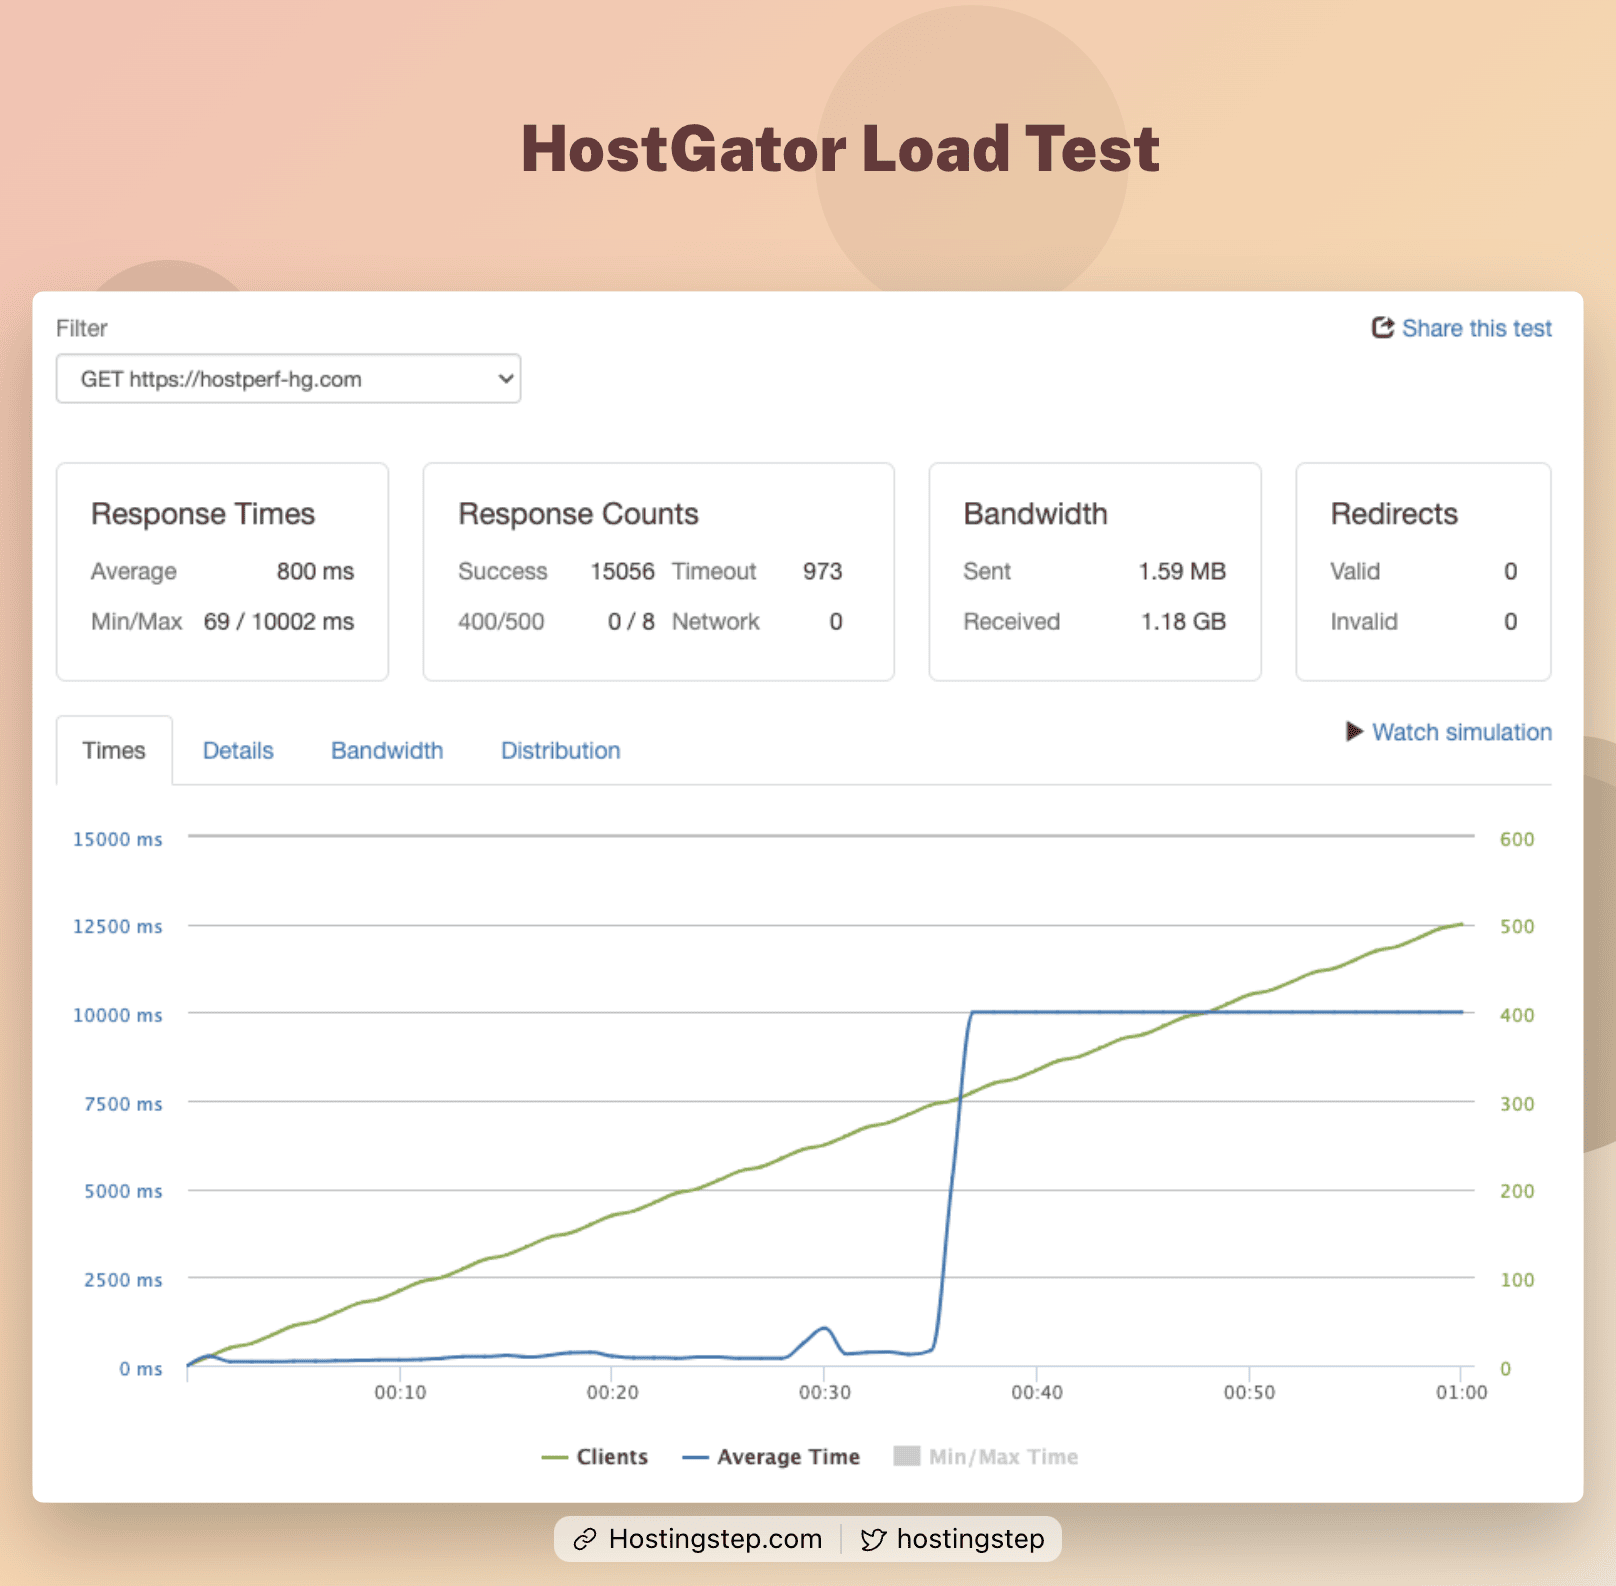
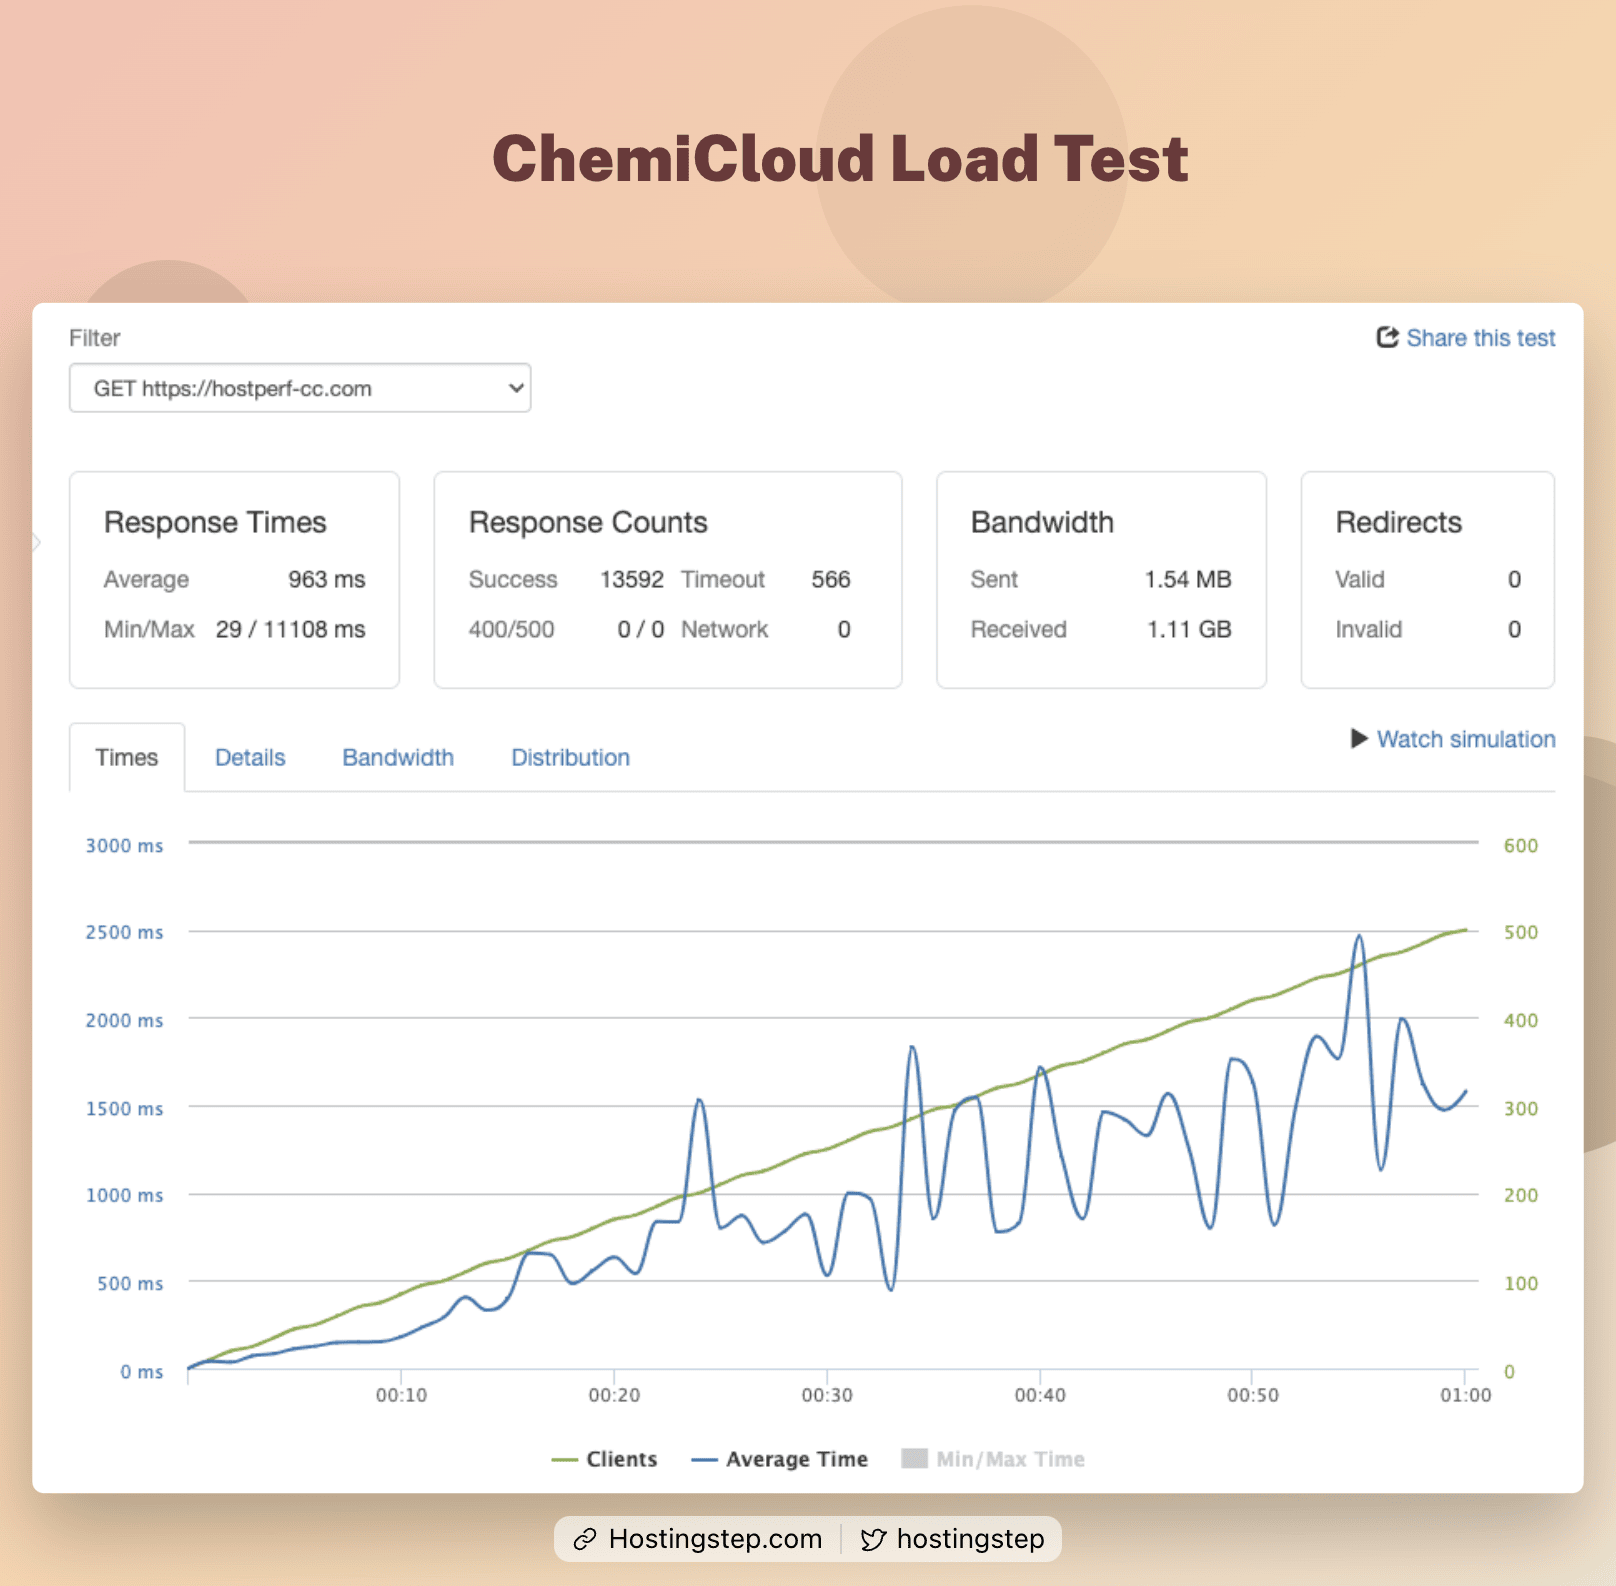
Like Bluehost, HostGator struggled to handle the load with timeout and 500 errors. ChemiCloud, too, sailed in the same boat and scored an average time of 963 ms.
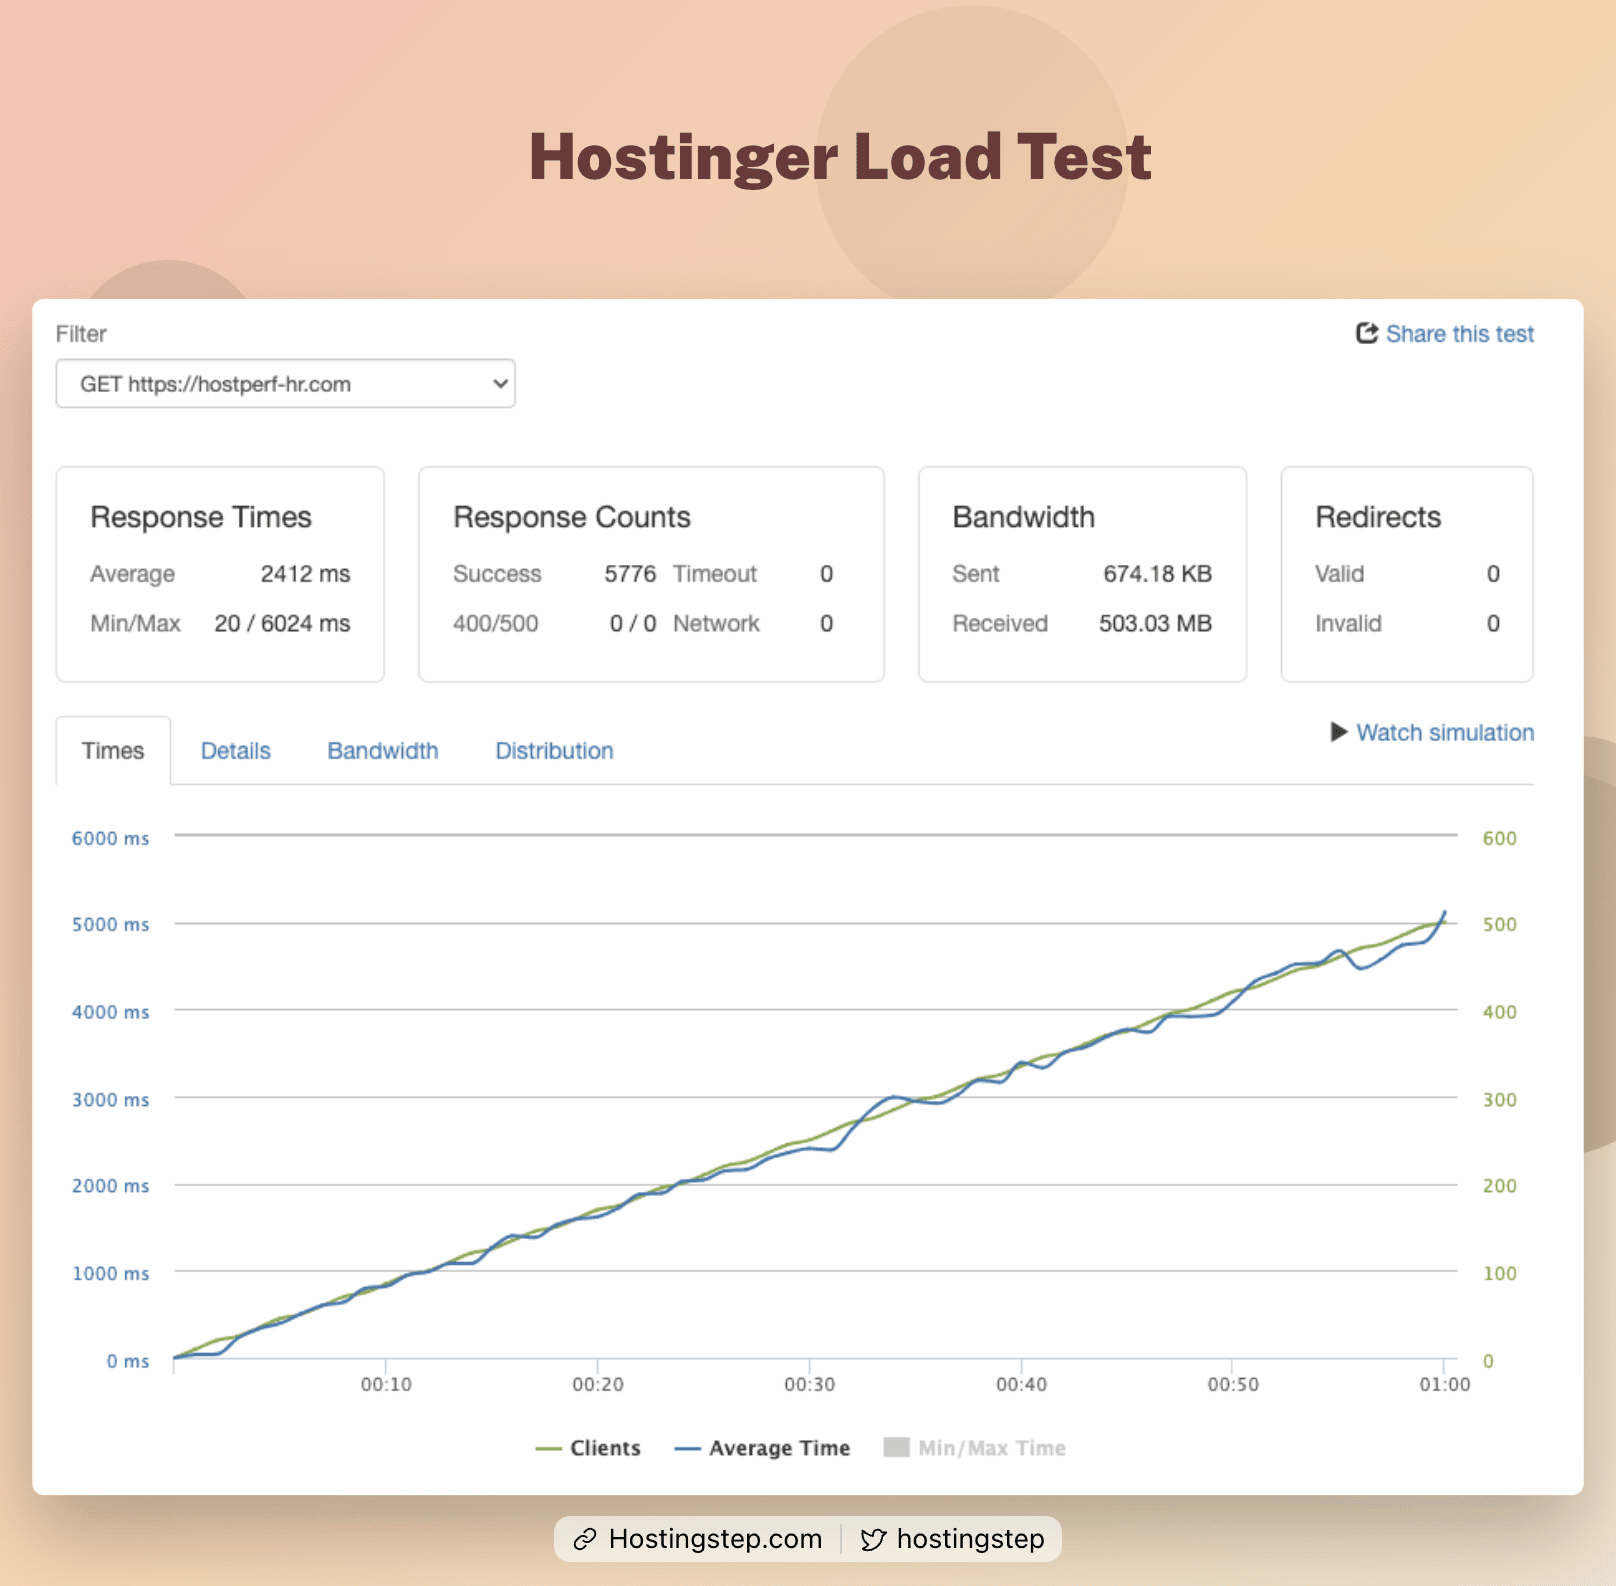
Hostinger, though it passed all the load requests, came last with a 2412 ms response time.
WP Engine’s security firewalls are enabled, so the test fails within 10 seconds.
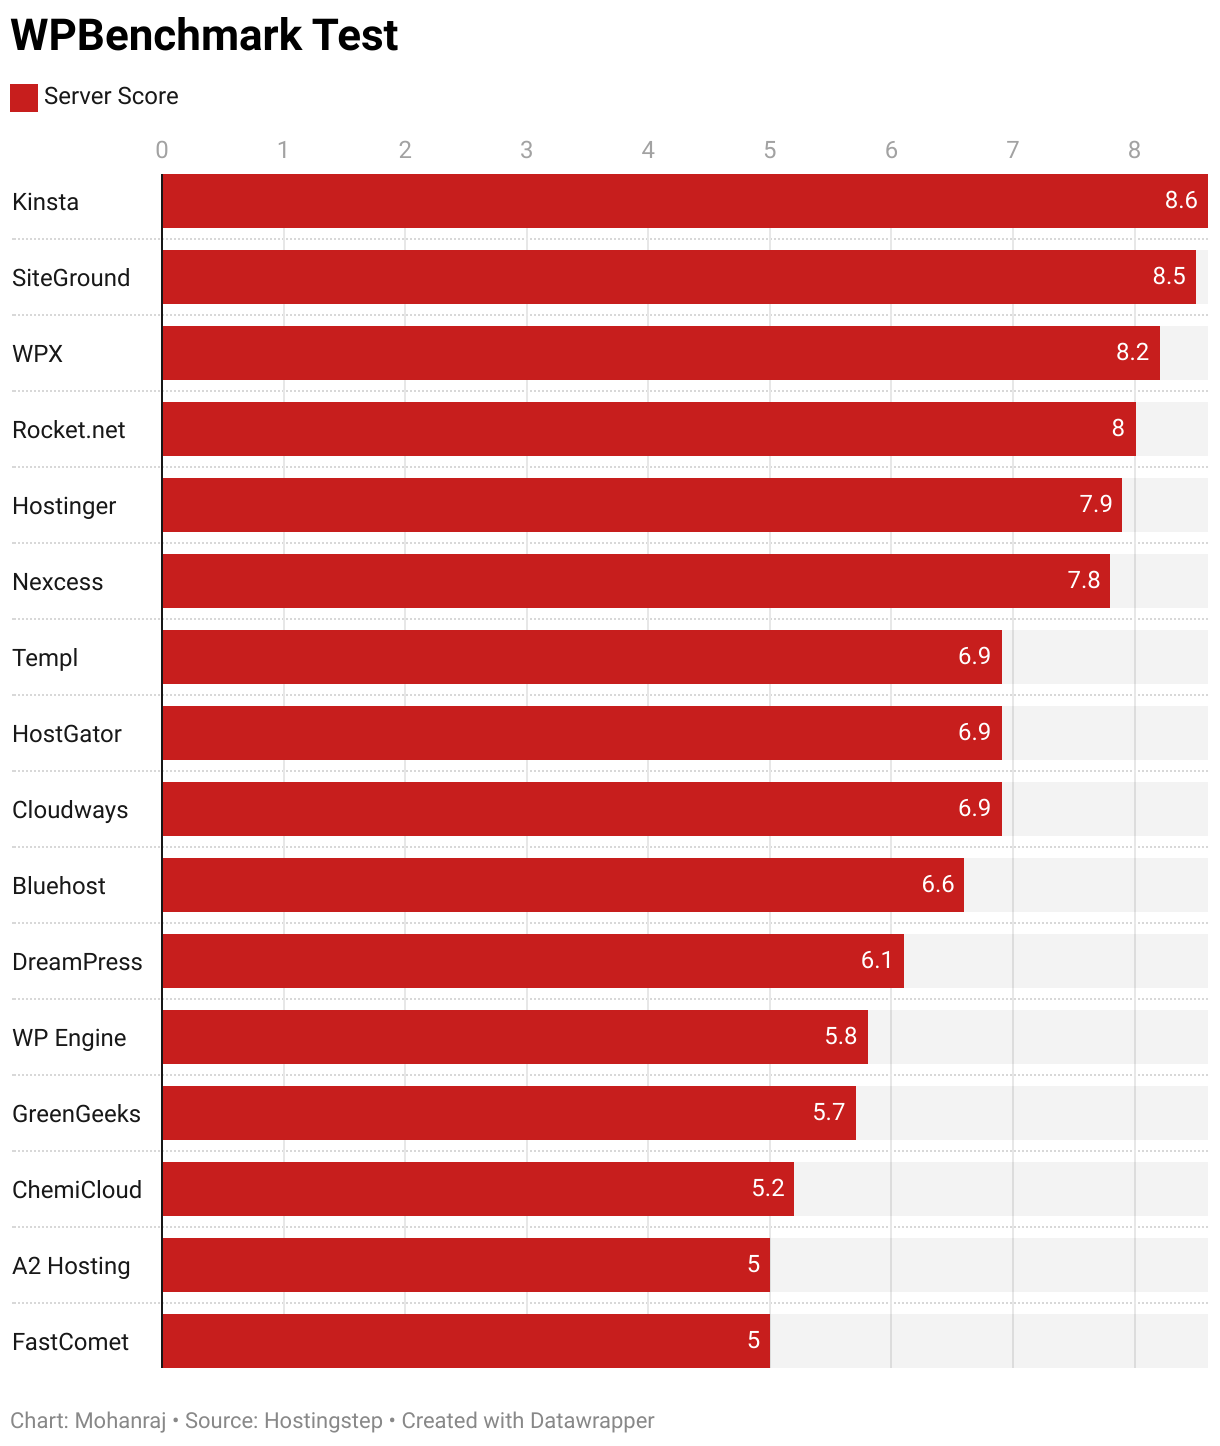
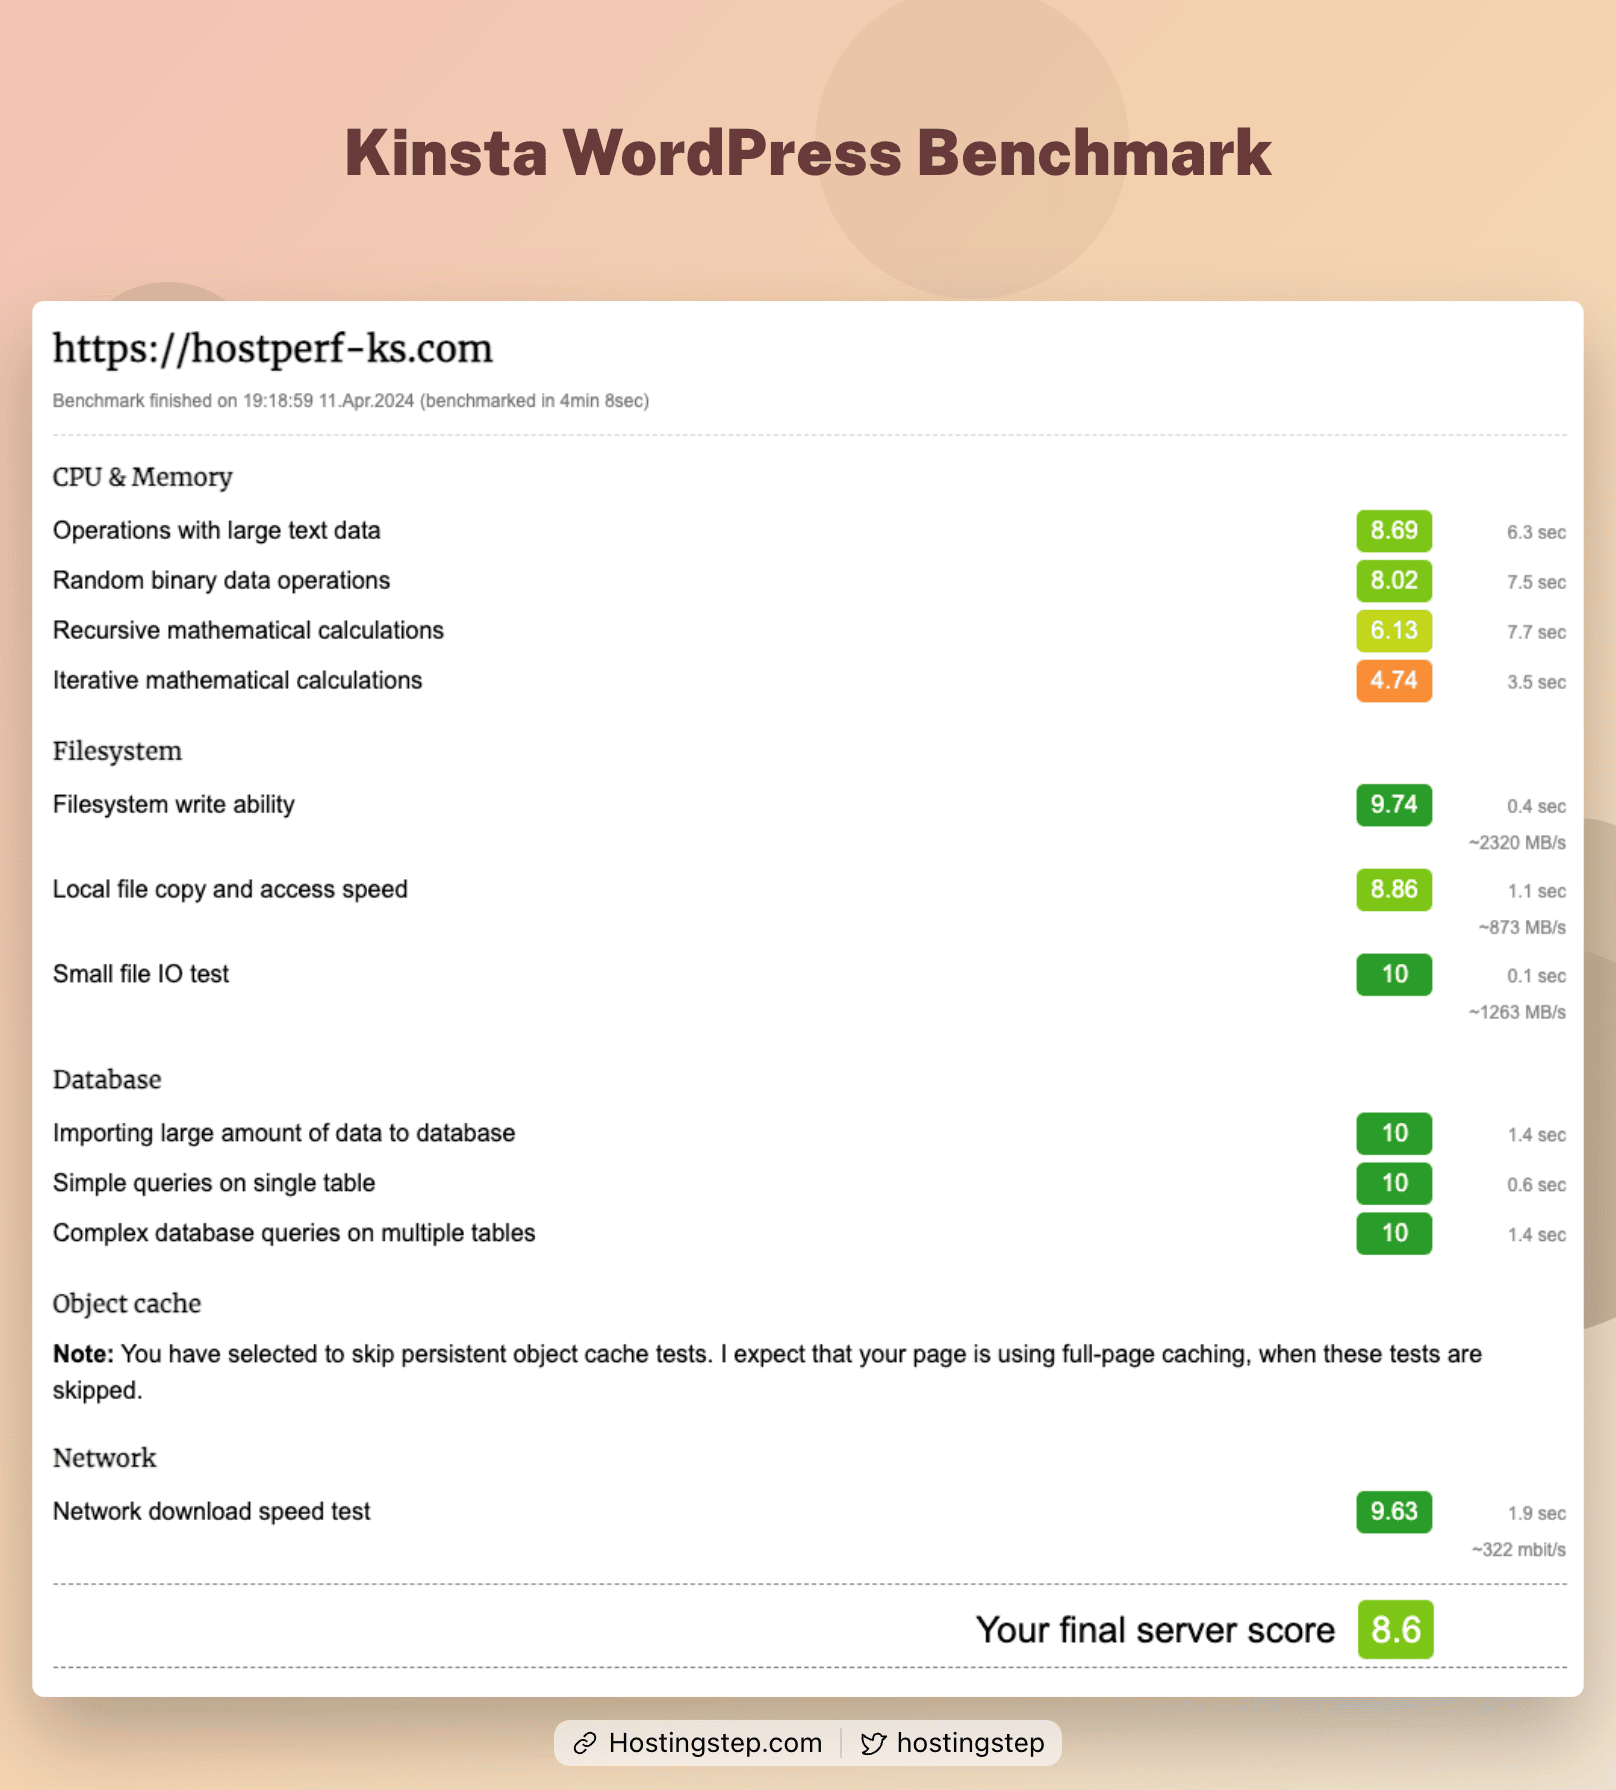
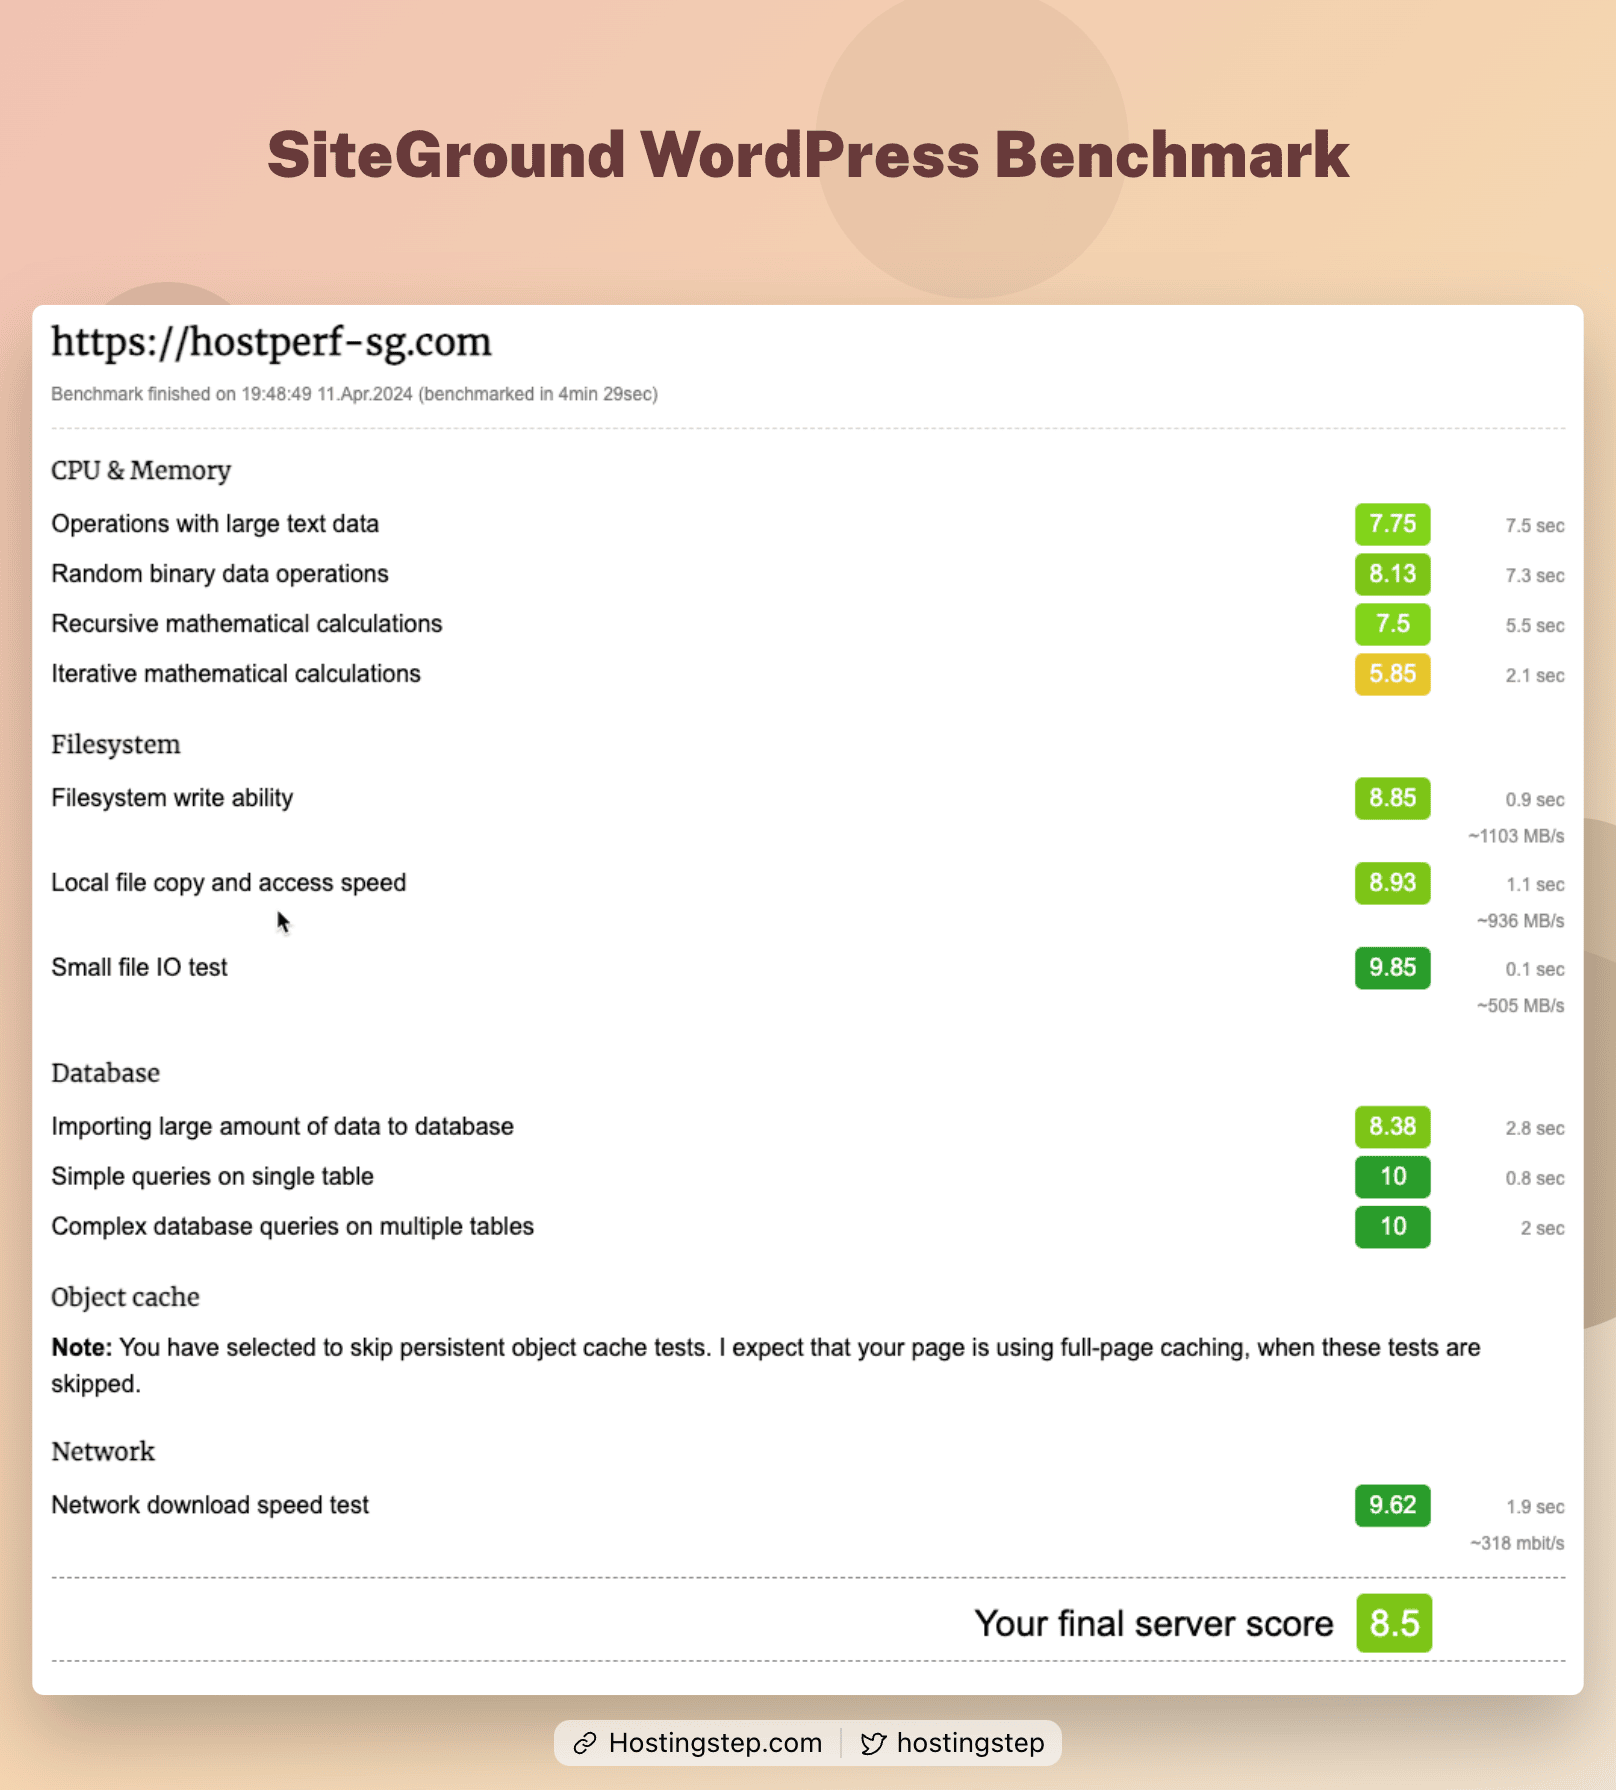
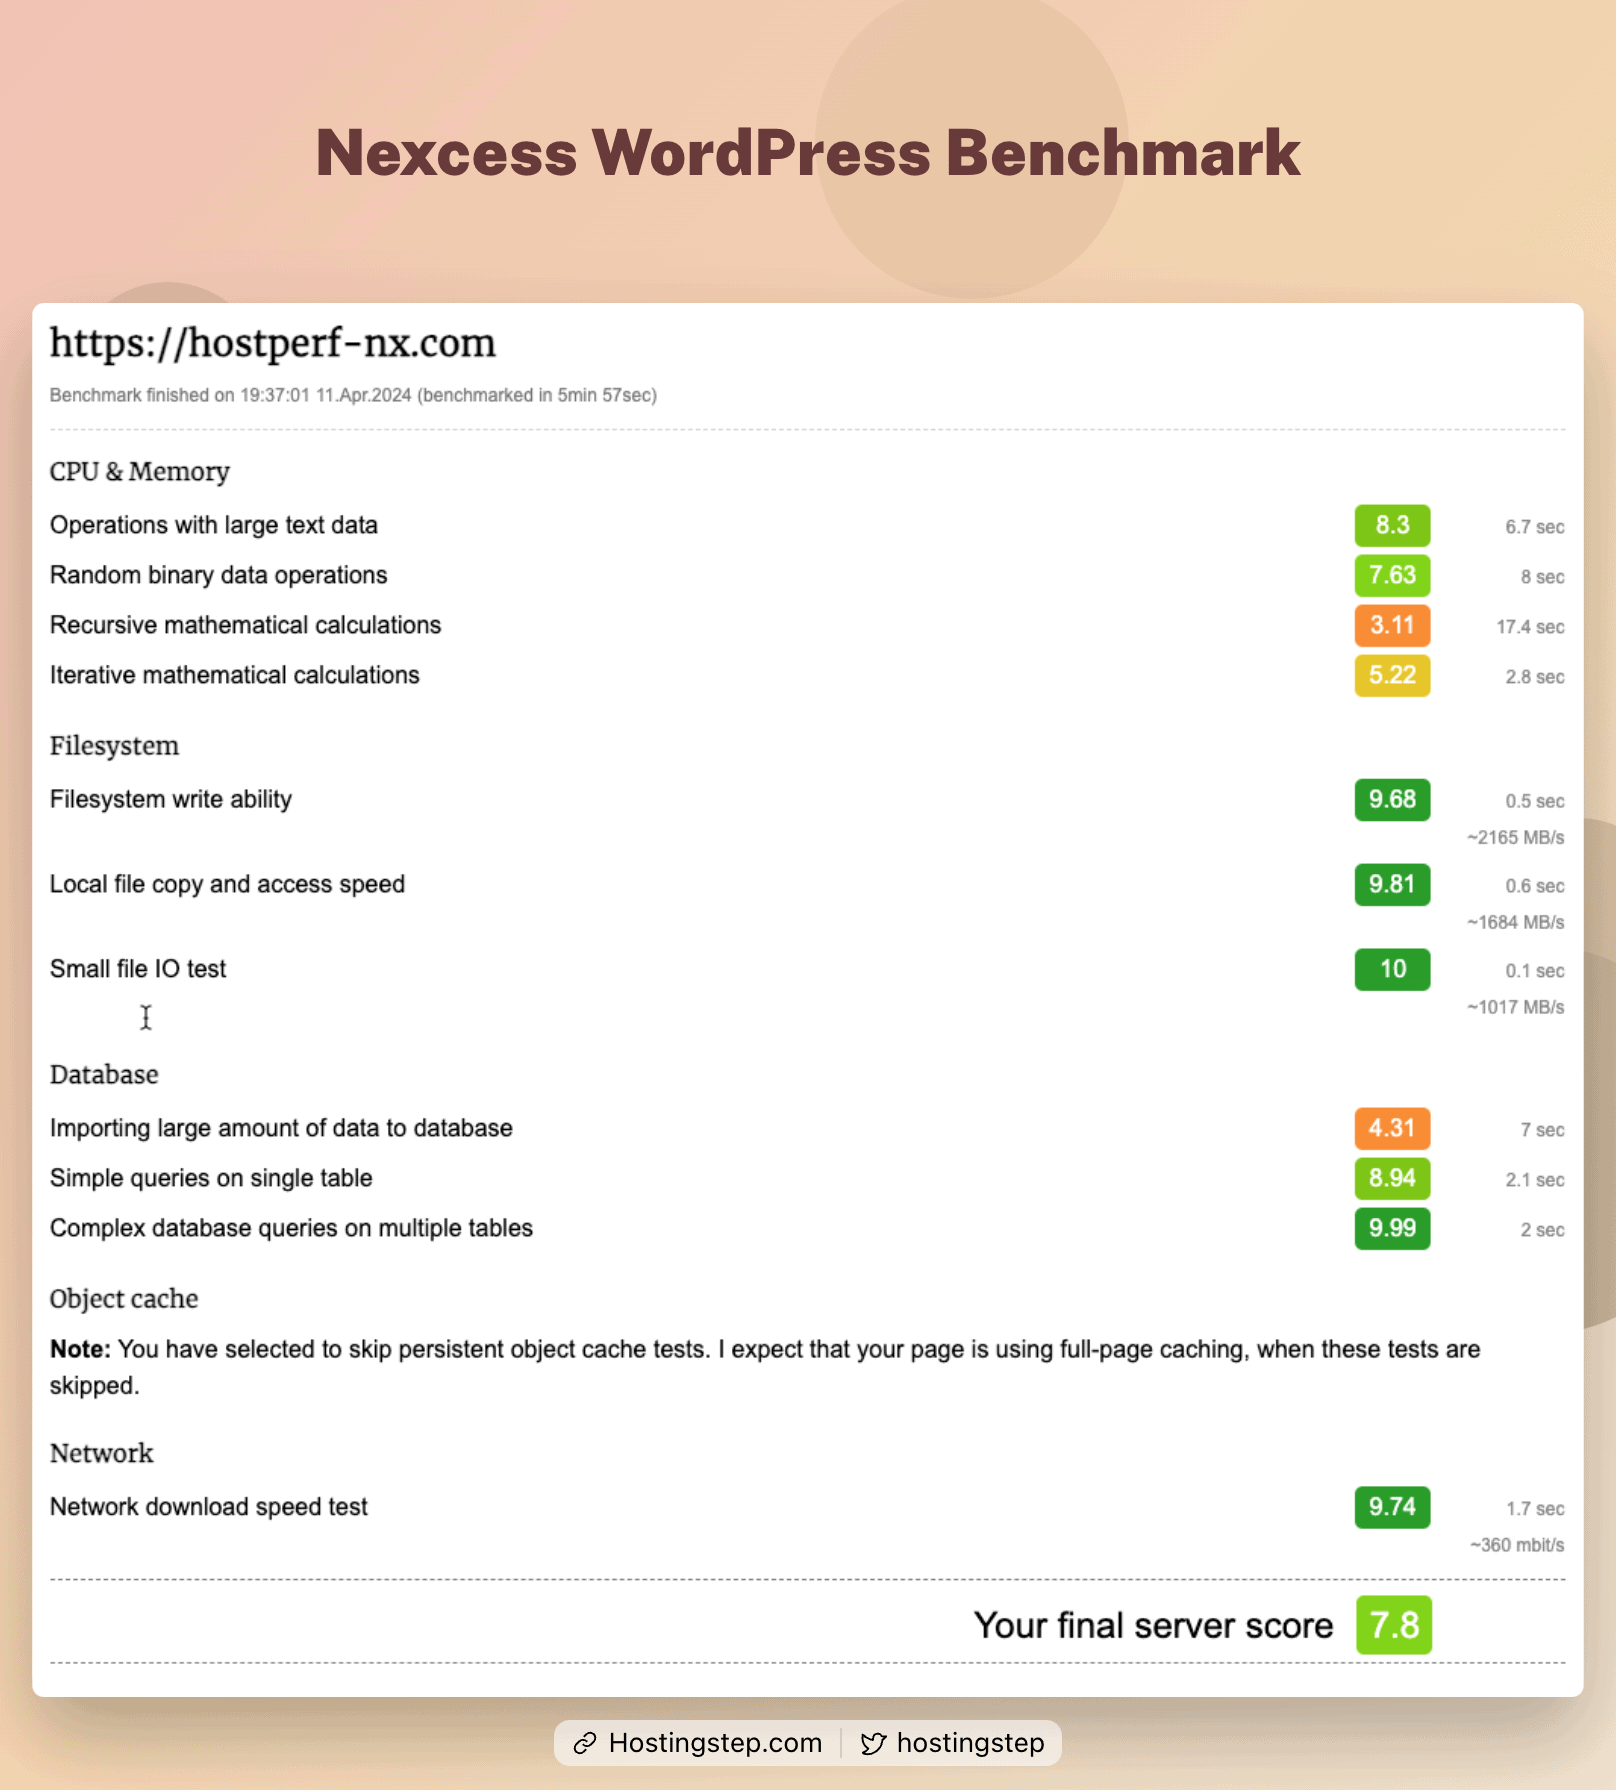
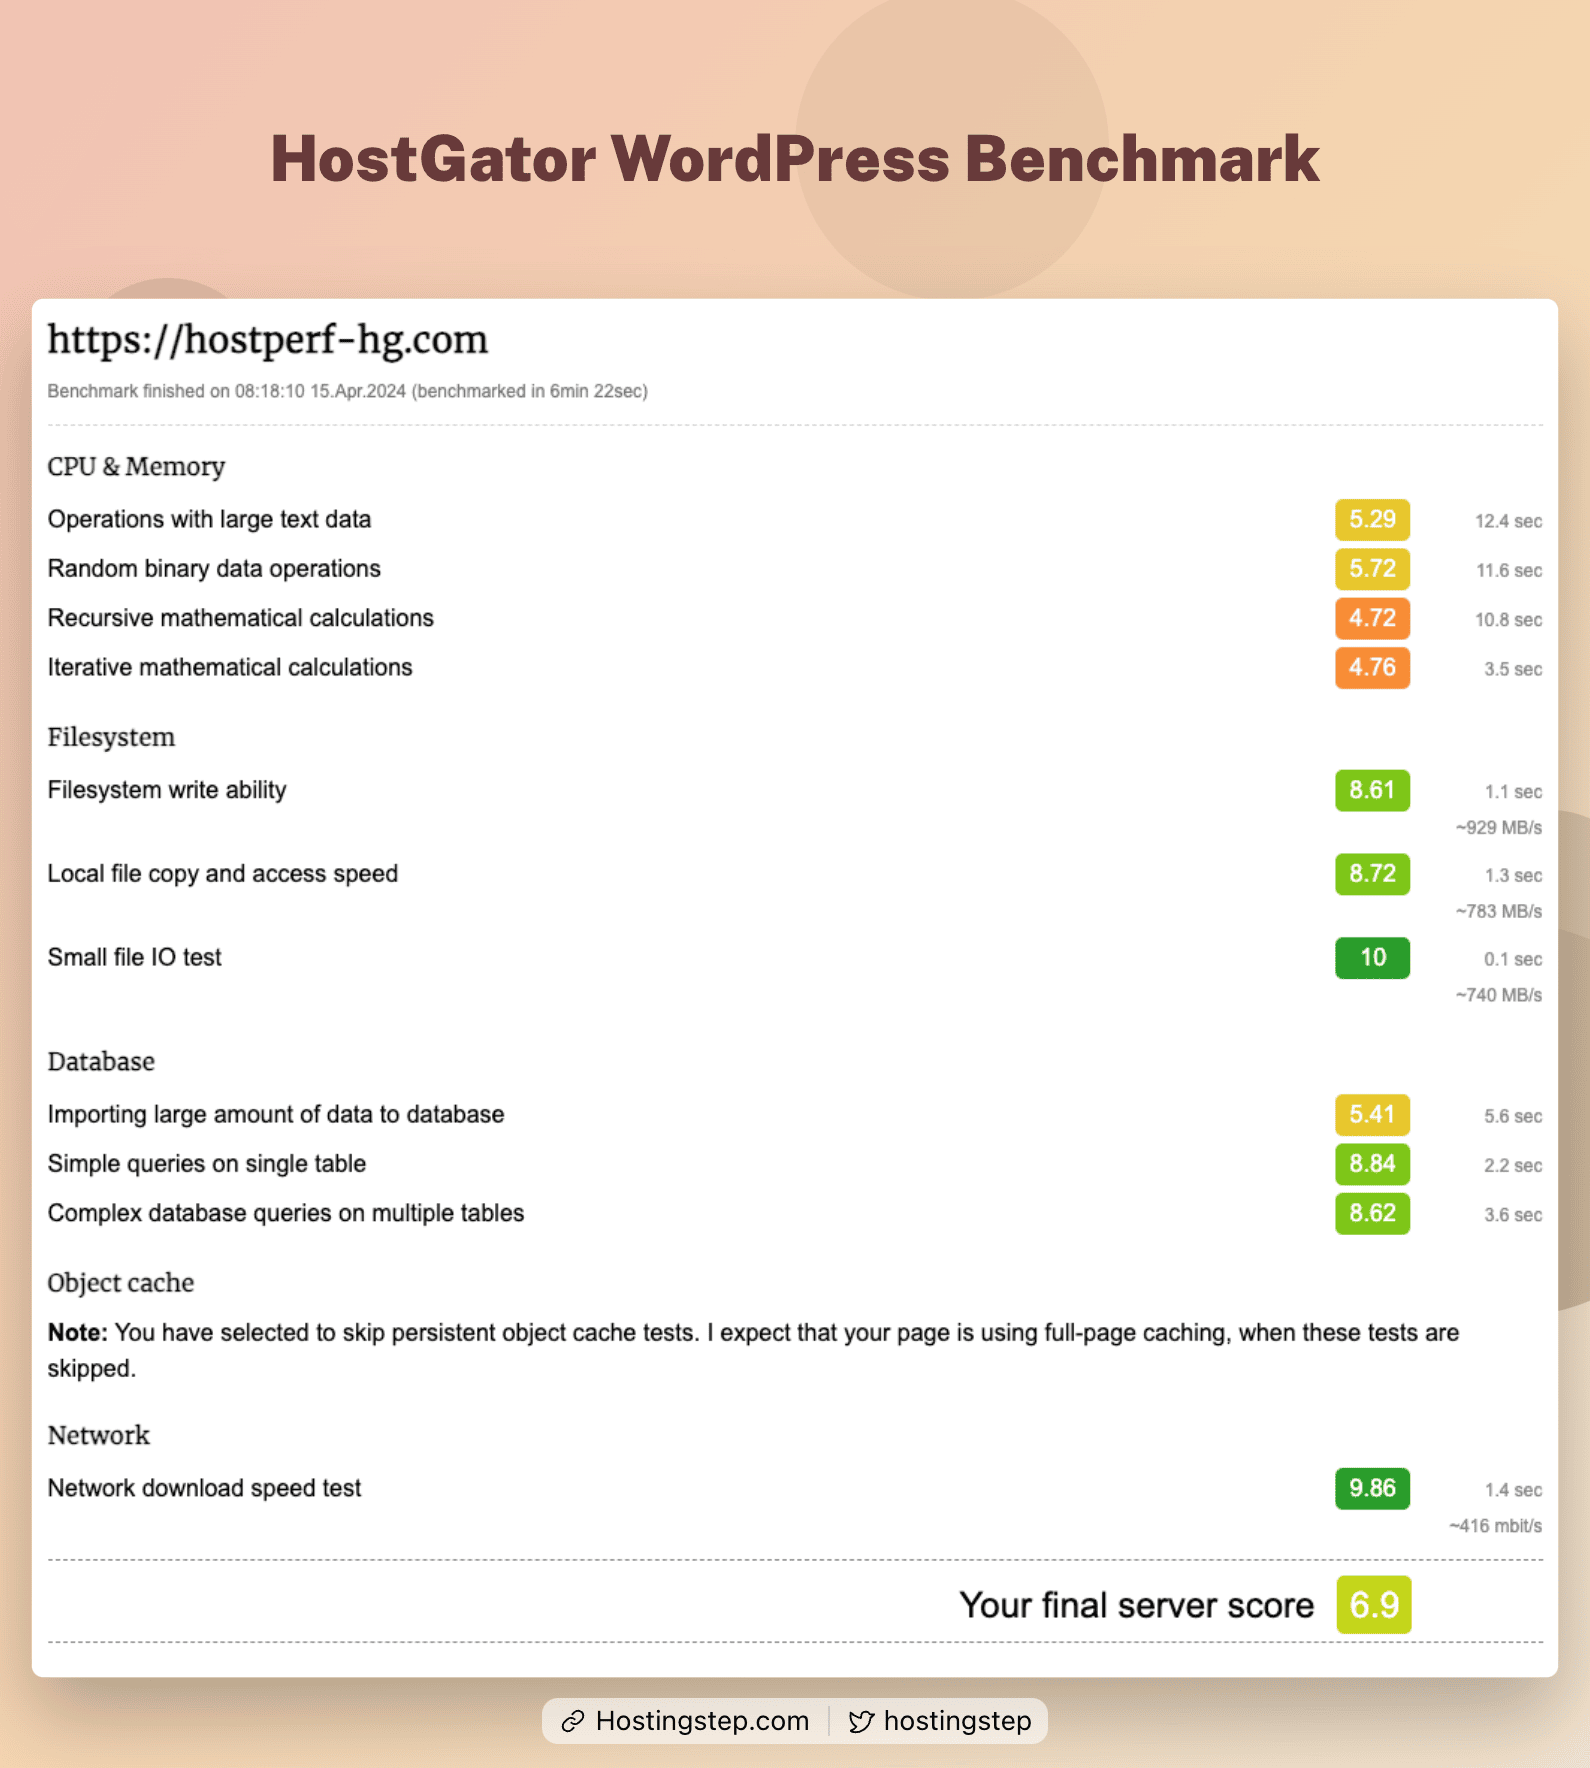
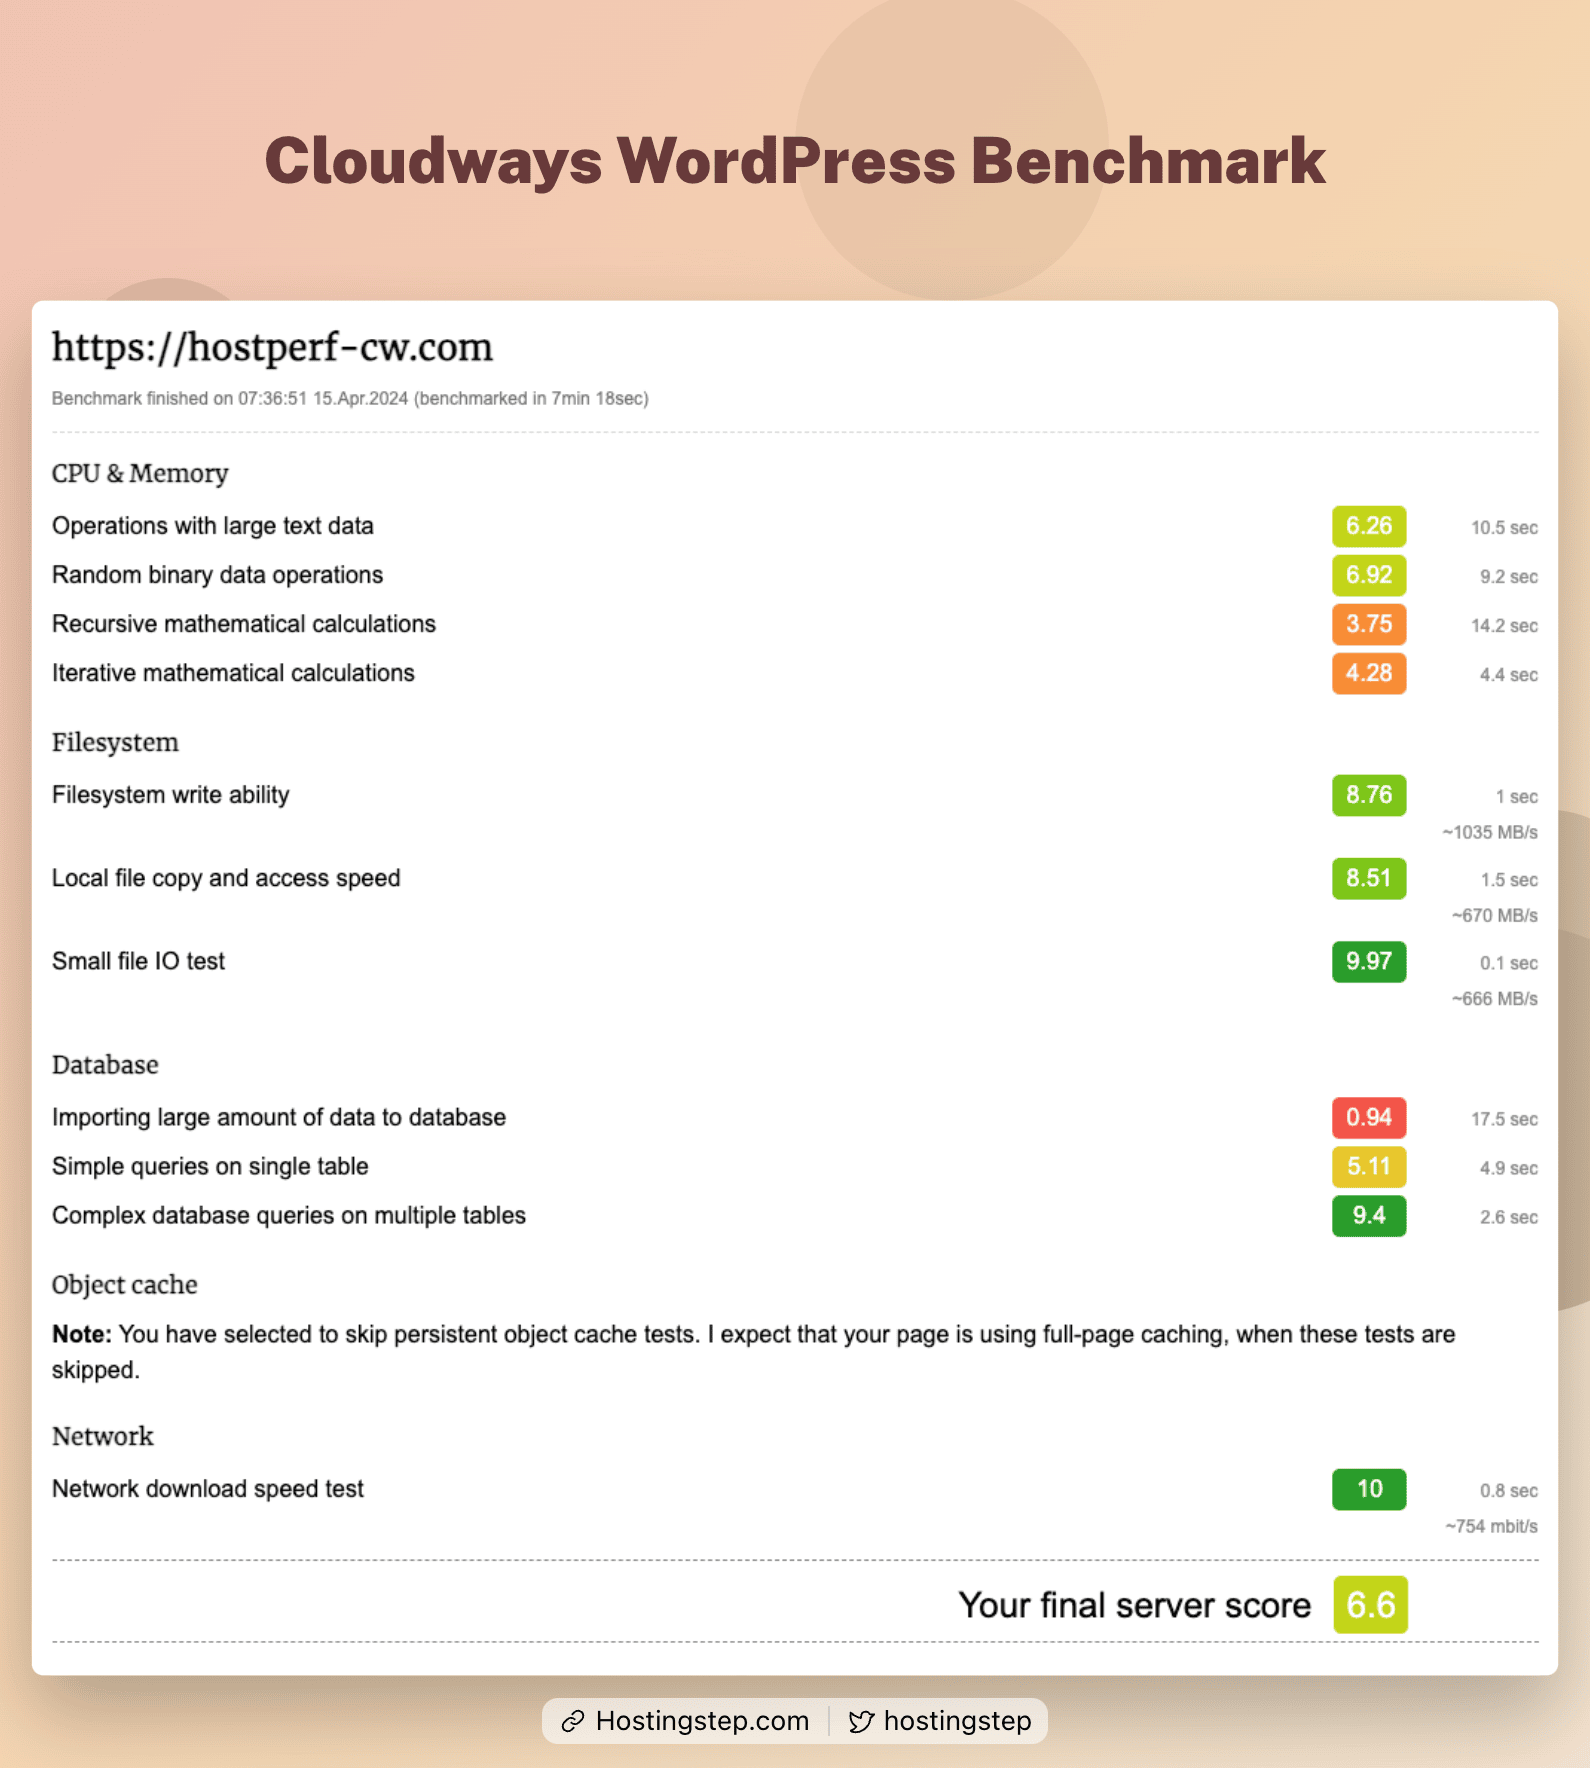
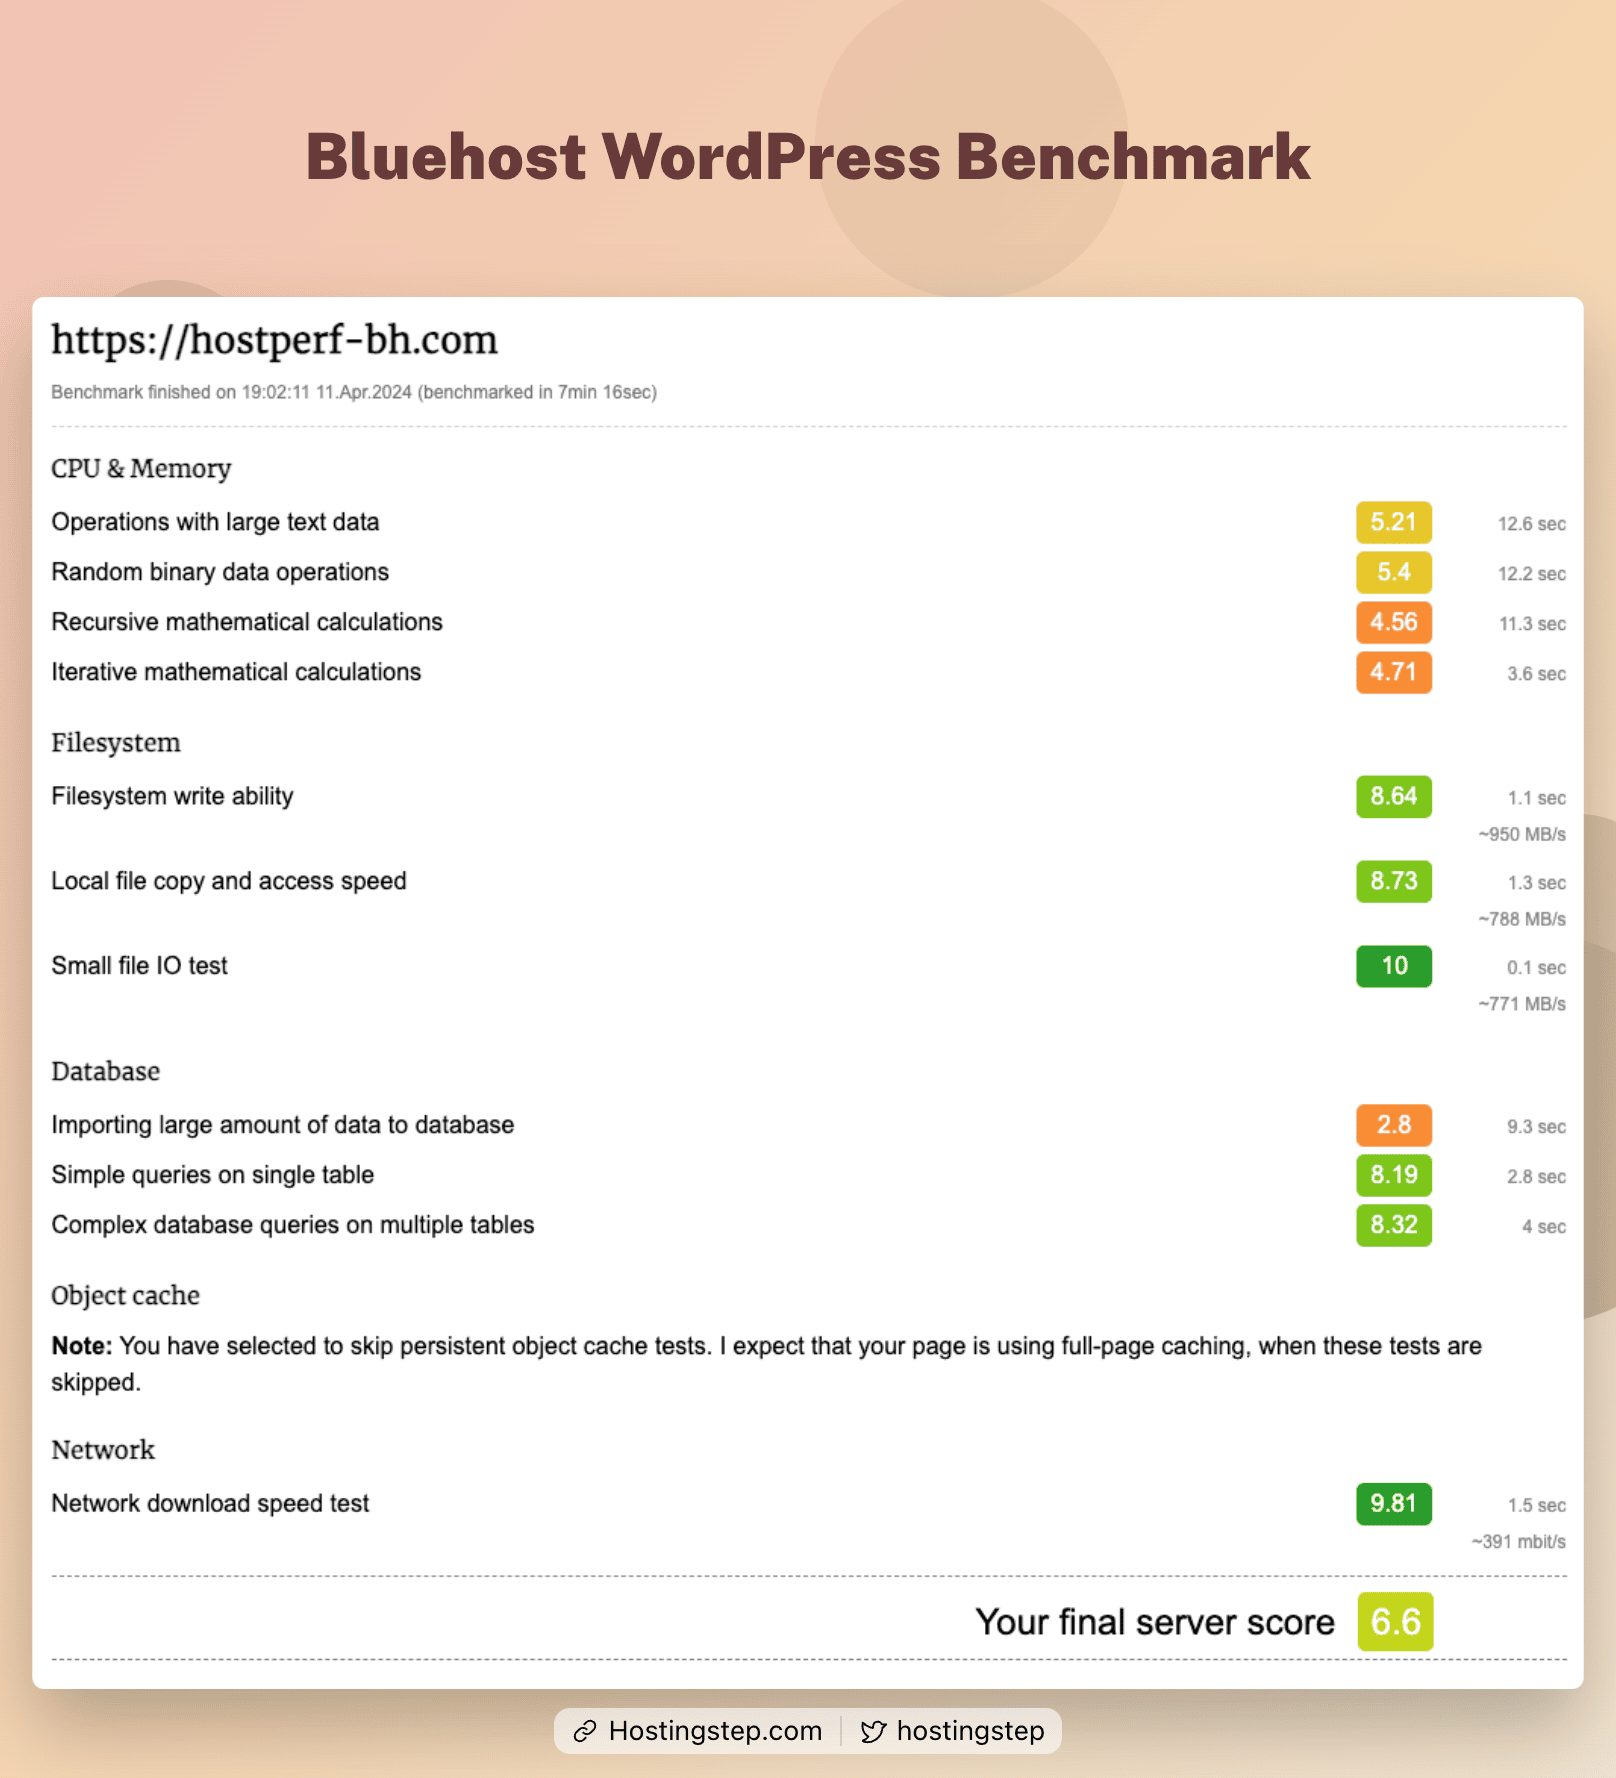
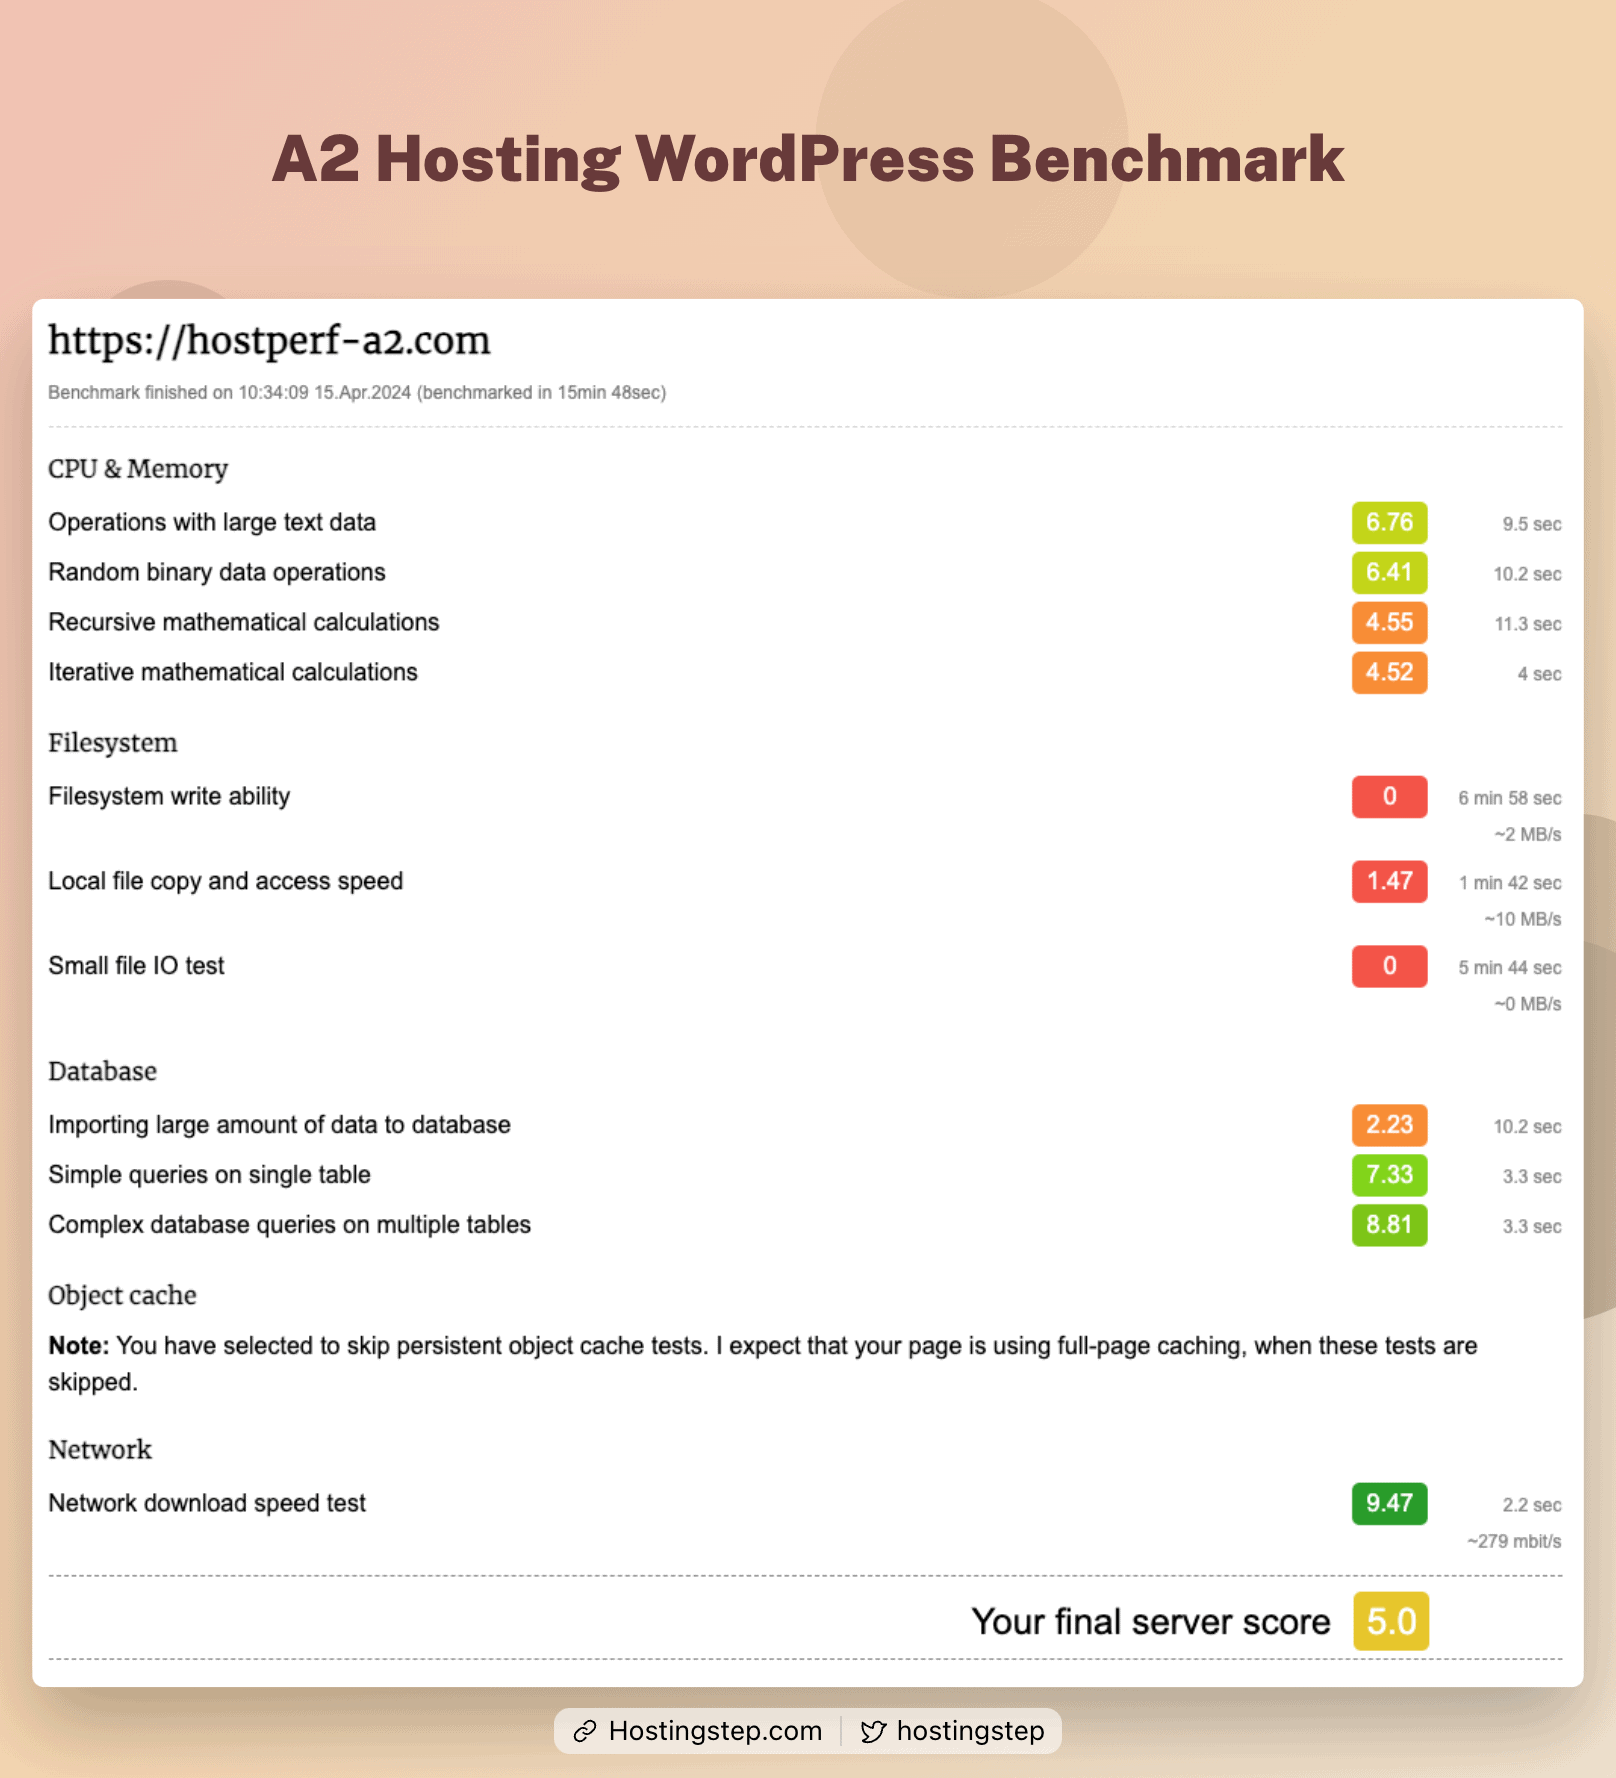
Benchmark Test 4 – WPBenchmark
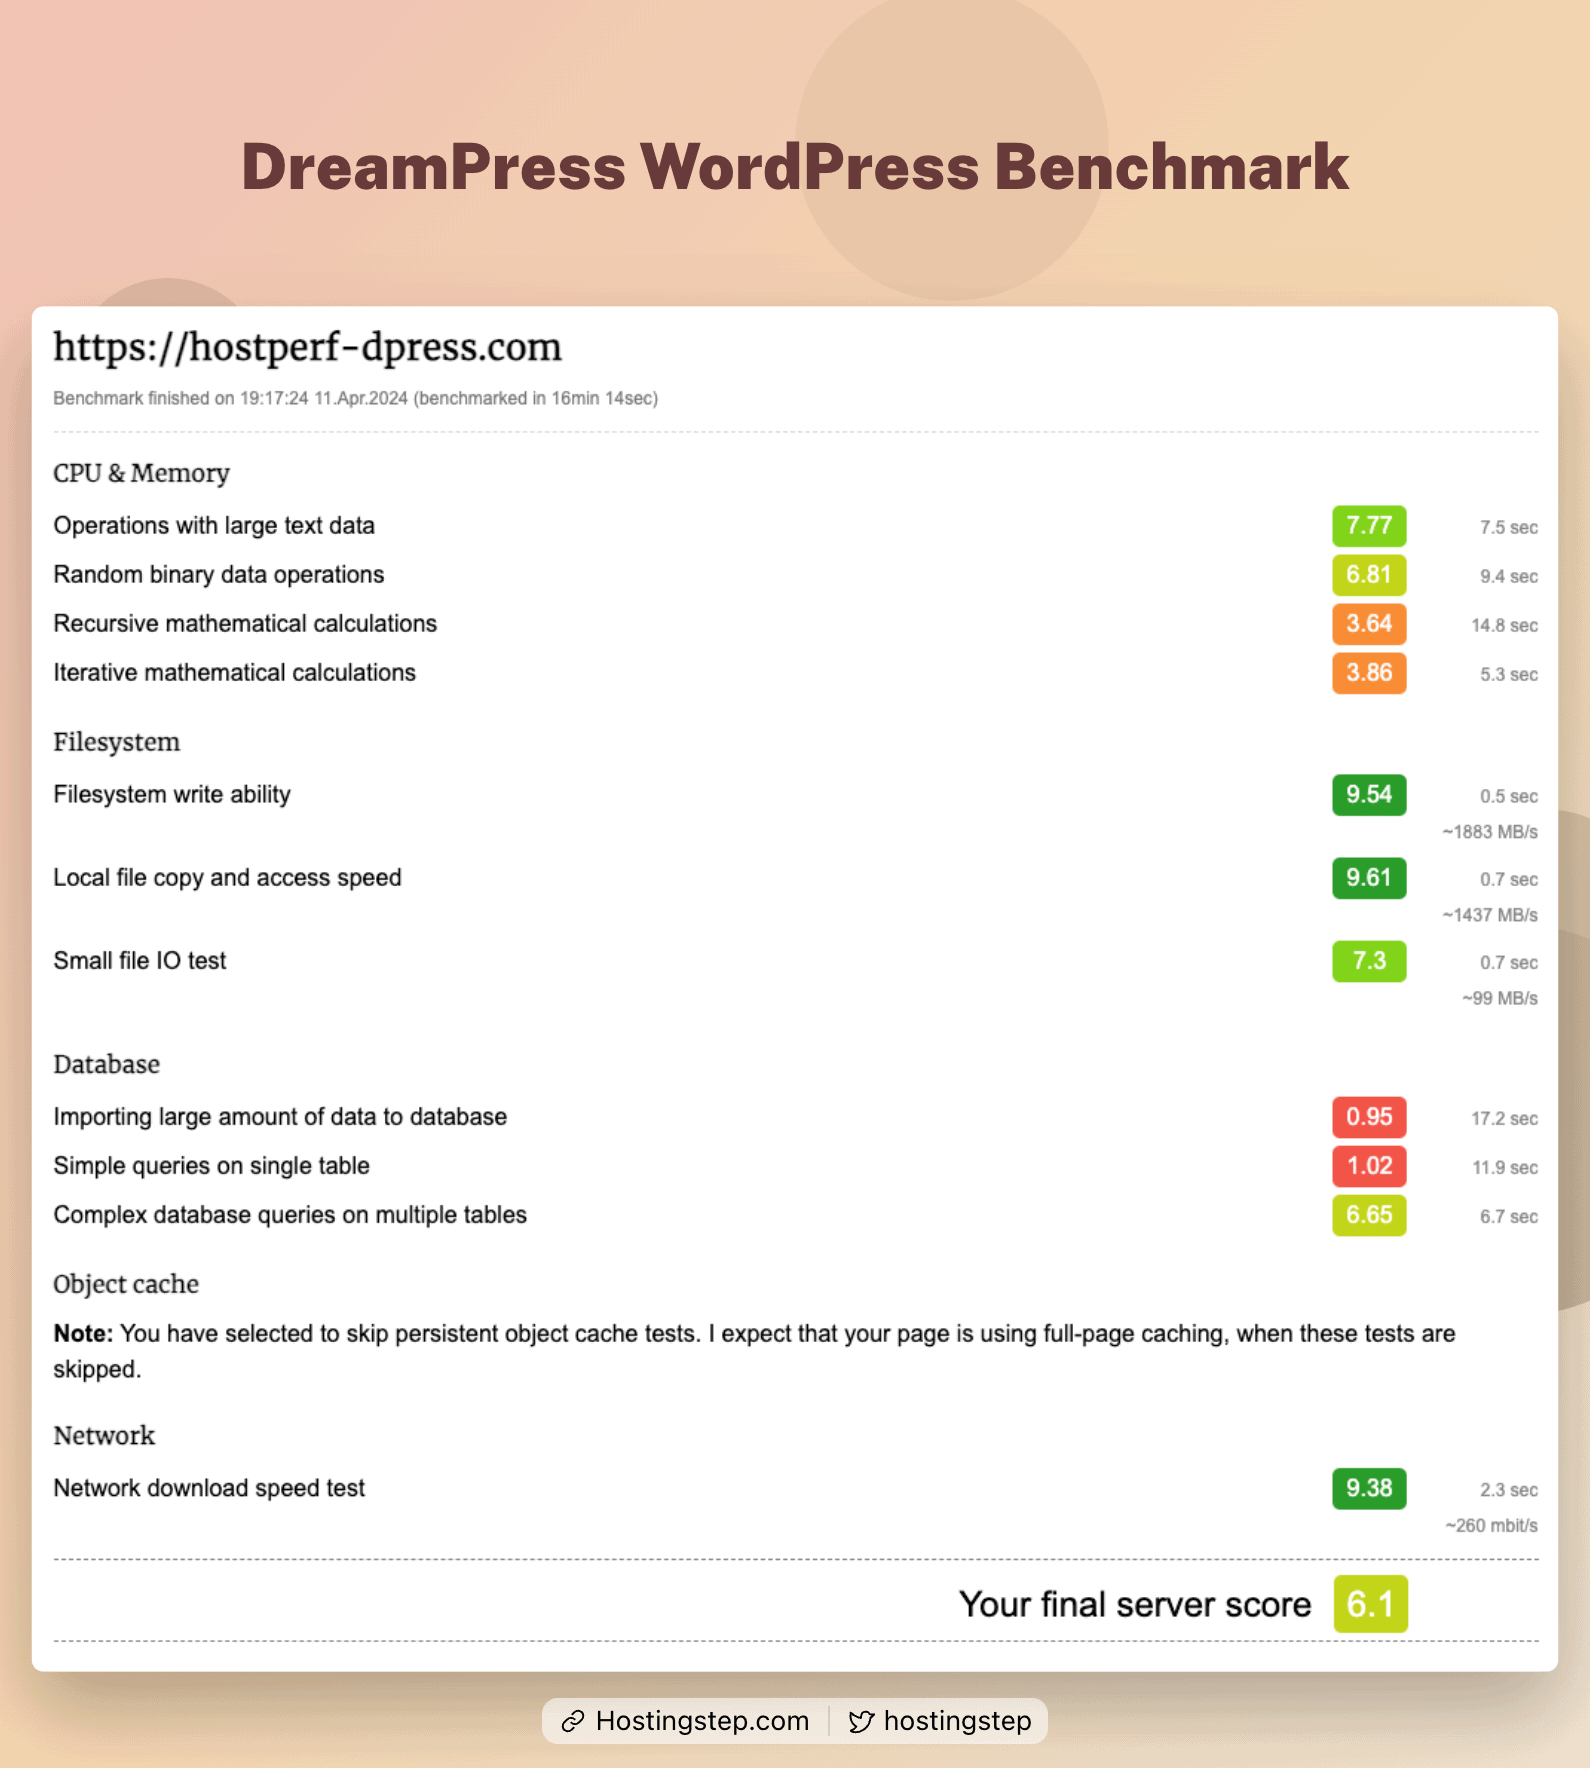
WPBenchmark is our latest addition of tests in 2024. WPBenchmark does CPU, Memory, File system, database performance, and network speed tests. The plugin gives an overall score out of 10.
Results:


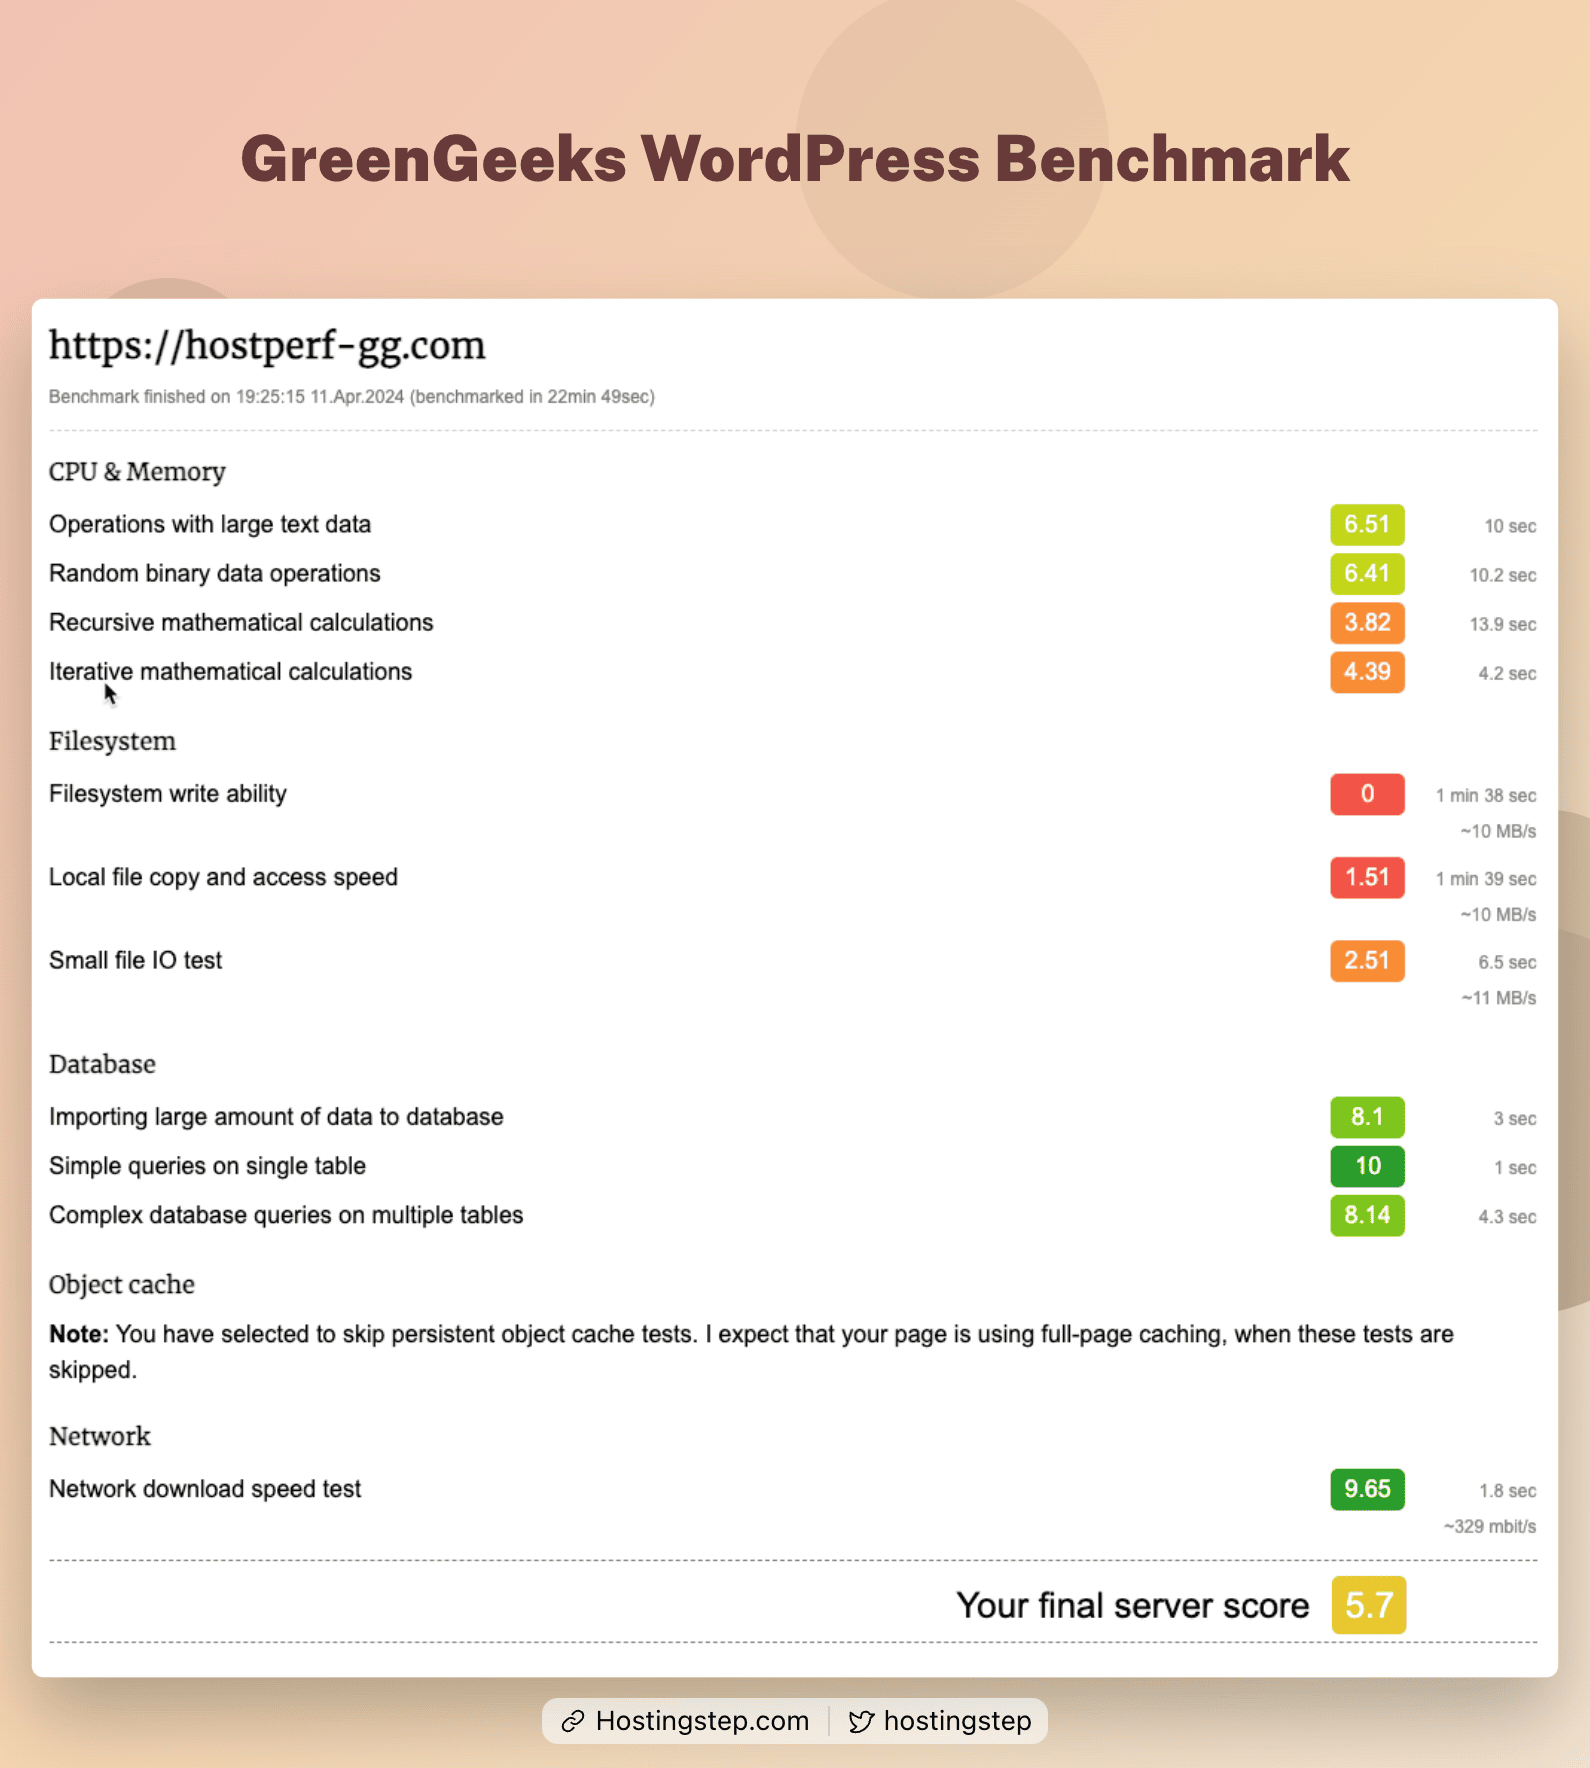
A2 Hosting, FastComet, and GreenGeeks became the top three fastest shared hosts in load testing results. However, these hosts have the lowest server scores of 5, 5, and 5.7, respectively.
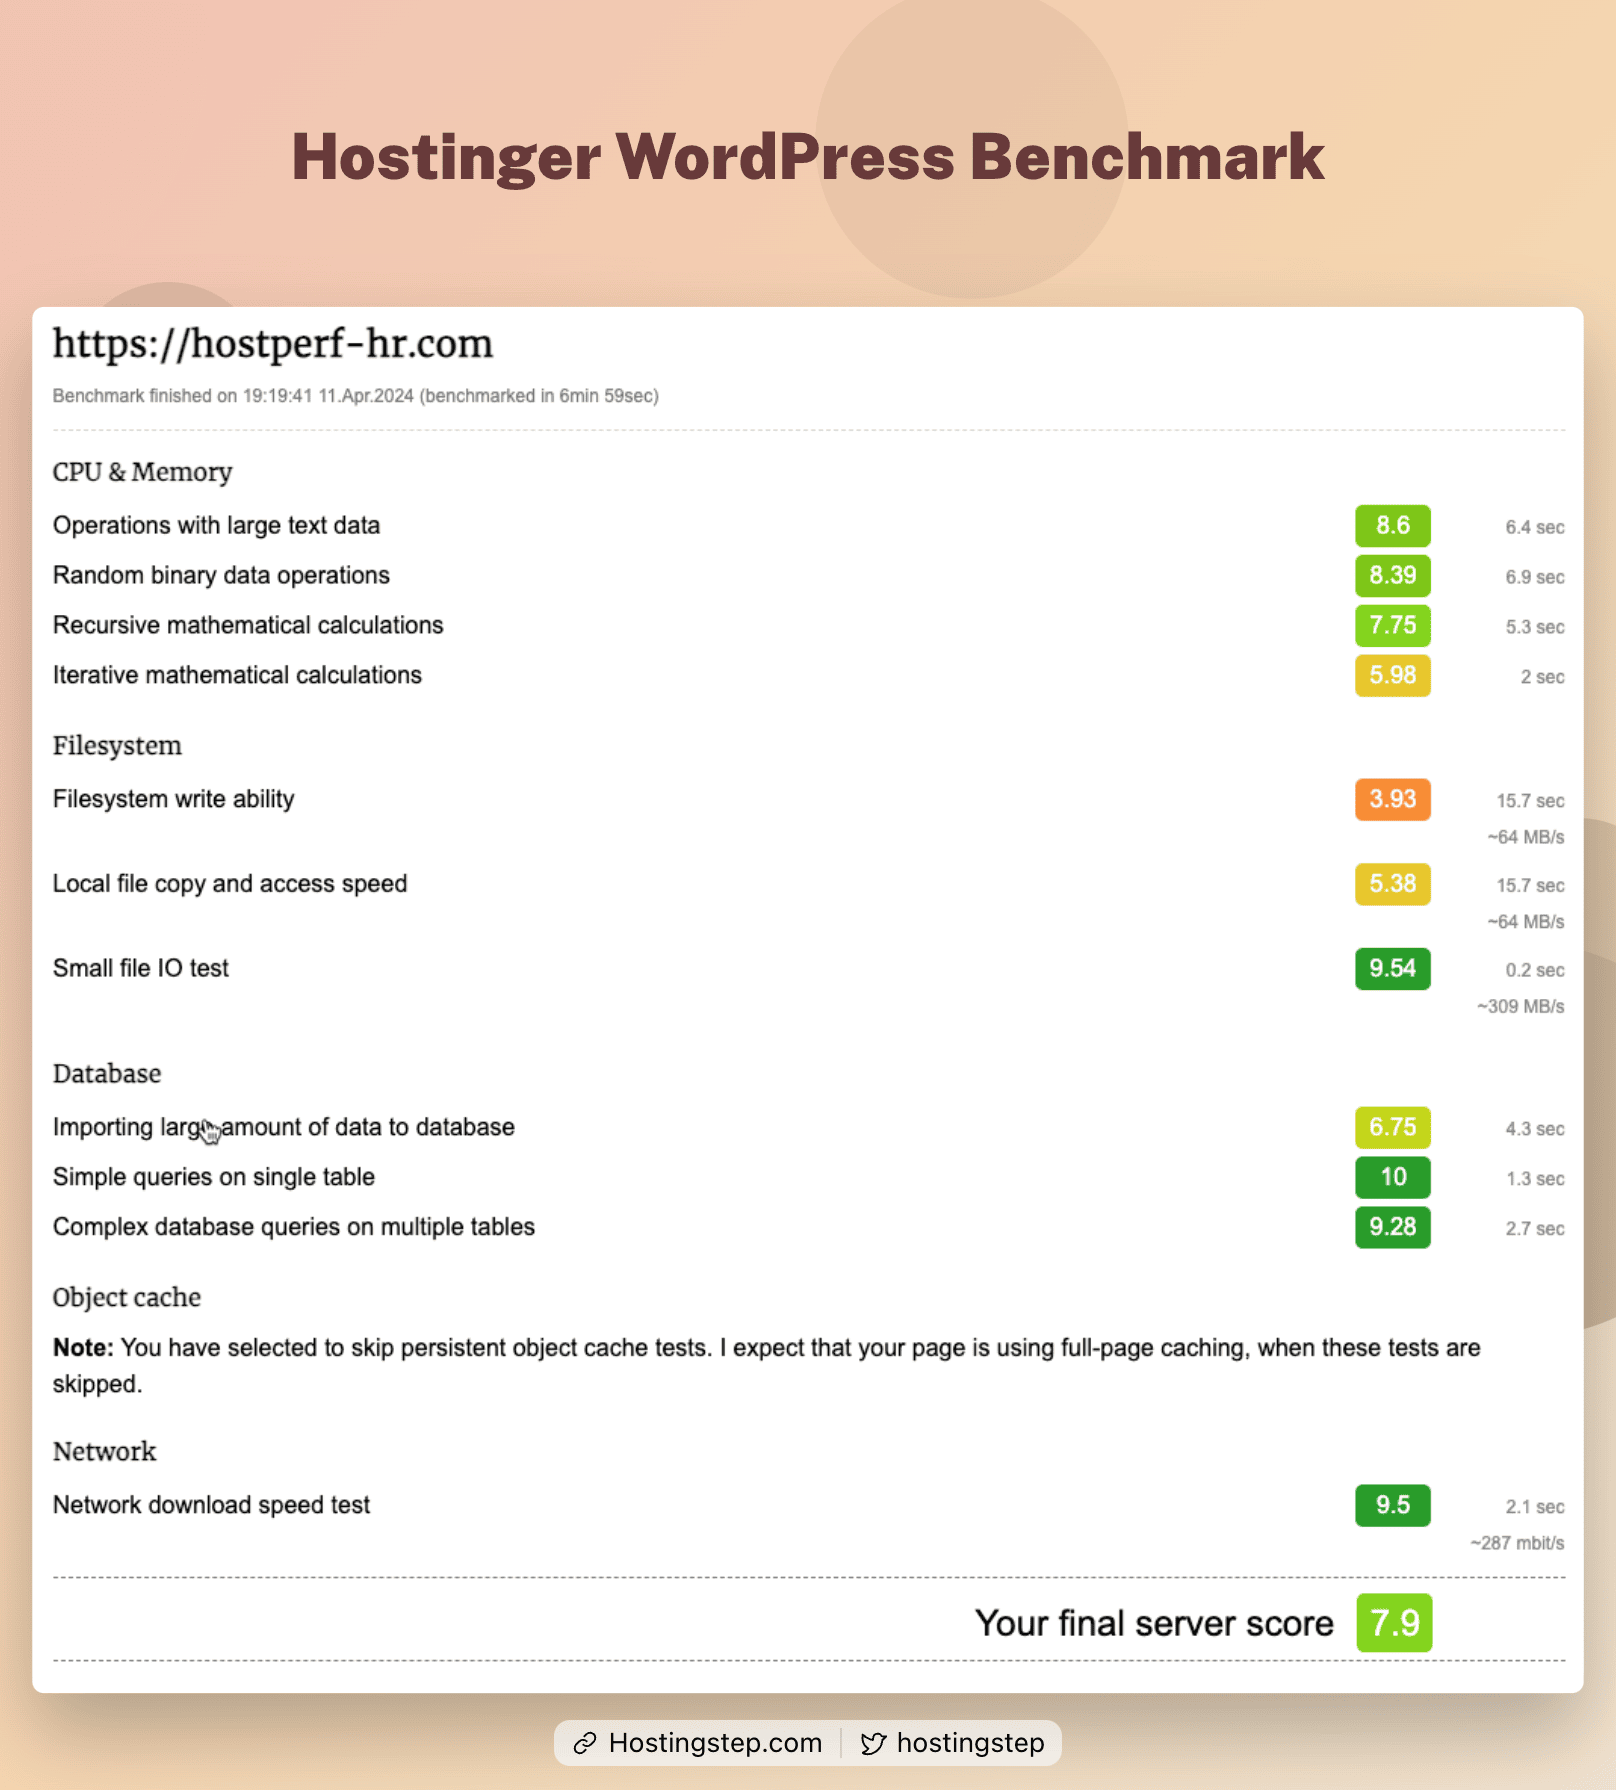
On the other hand, HostGator scored poorly in all the above tests and got a decent 6.9 score. Hostinger, which had a poor load test result, got a server score of 7.9.
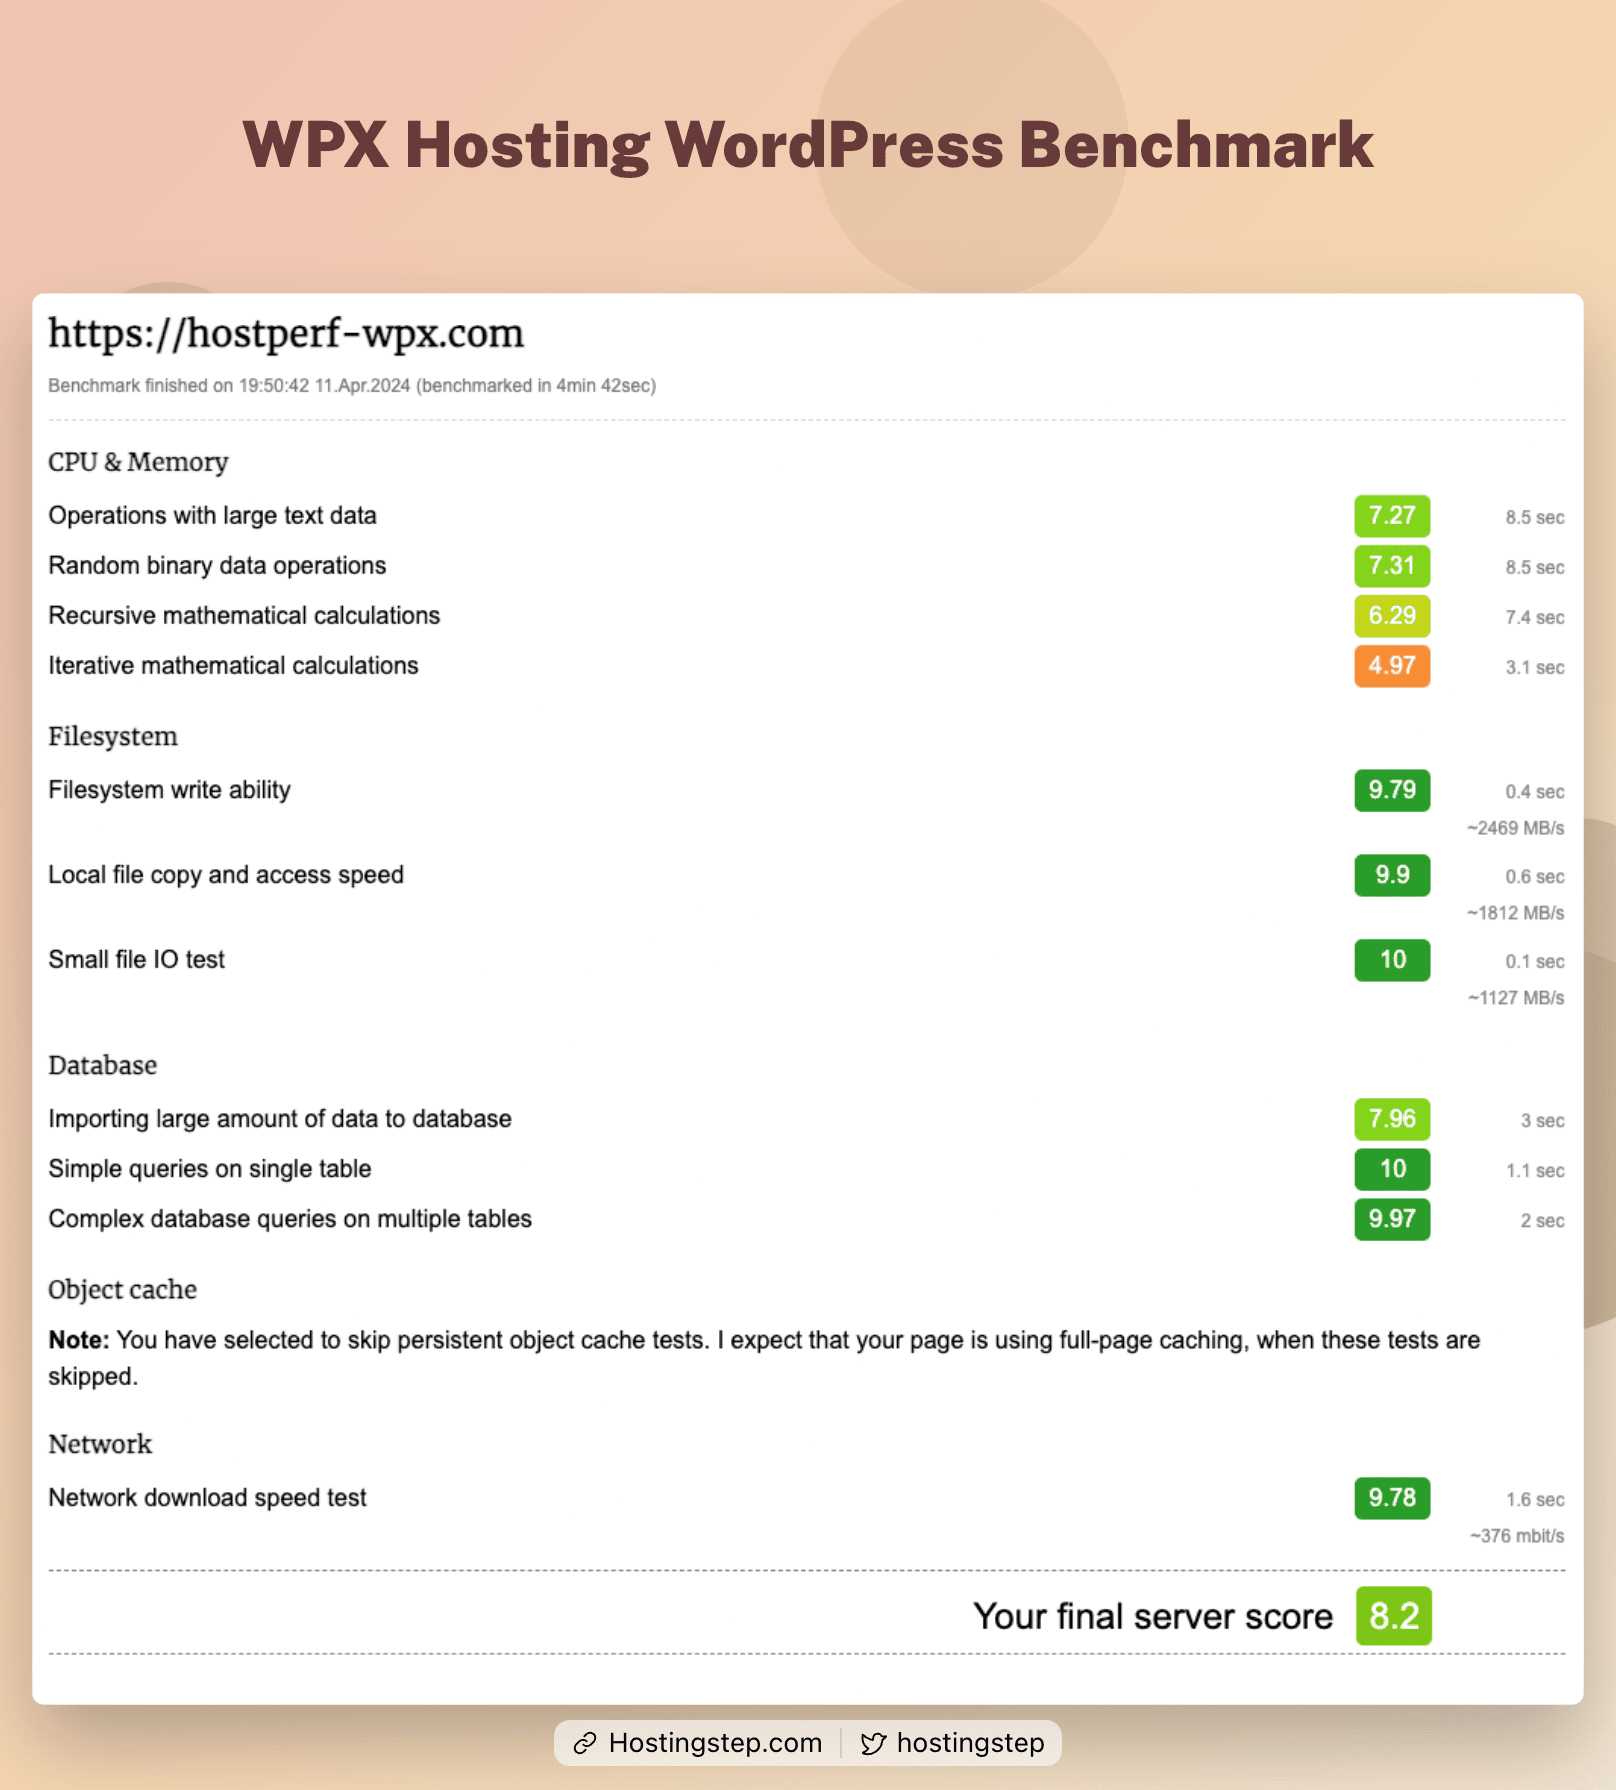
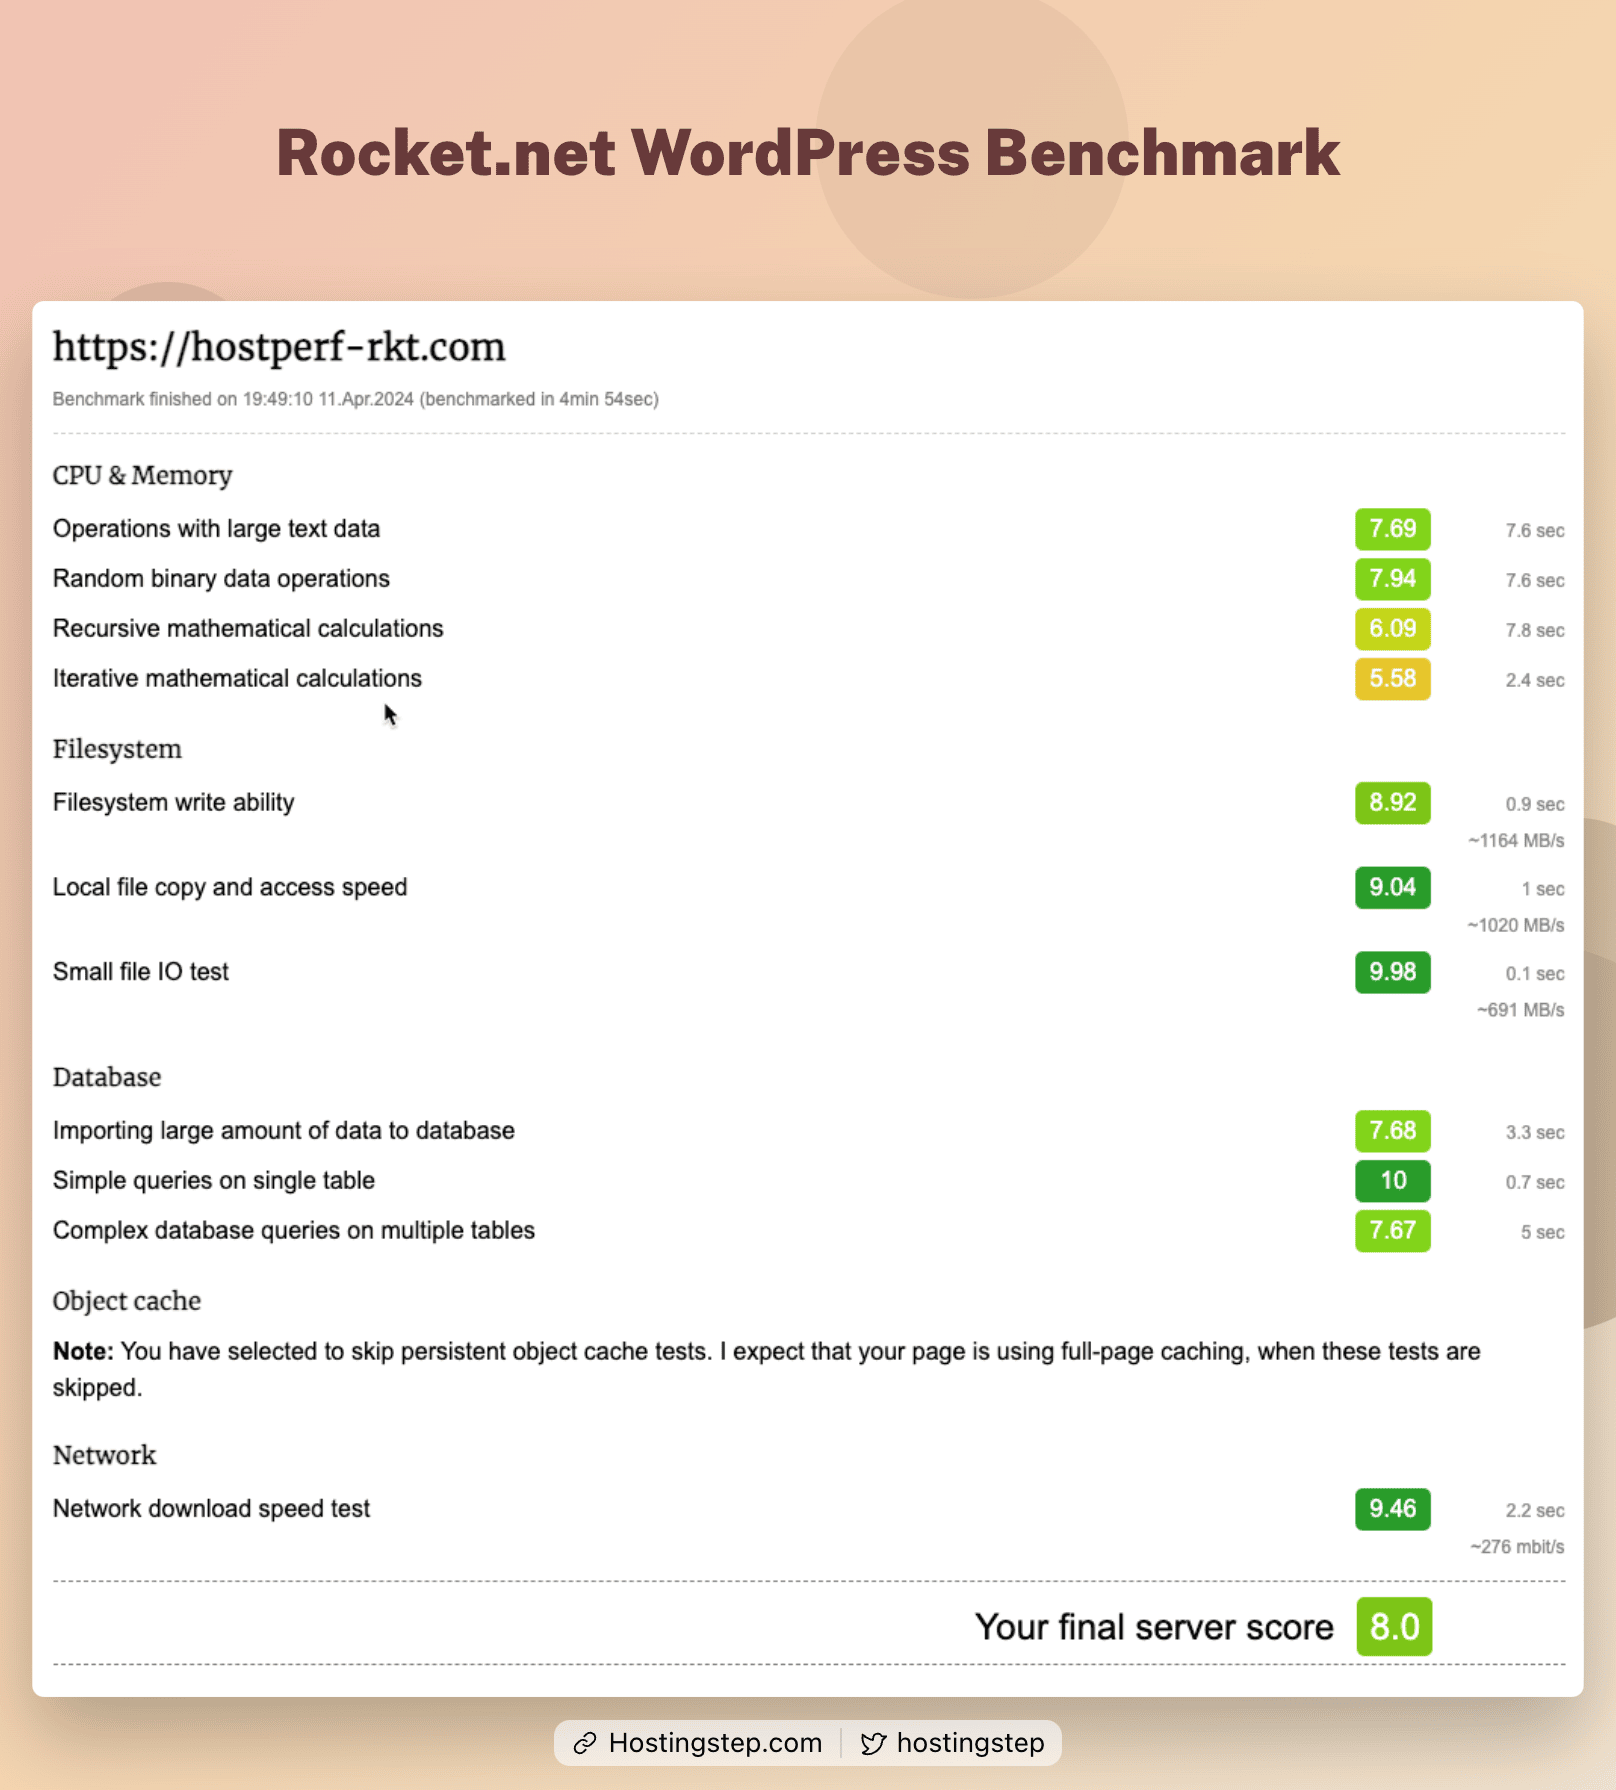
Kinsta, Rocket.net, and WPX are the few hosts that performed better in all the above tests and this WPBenchmark test.
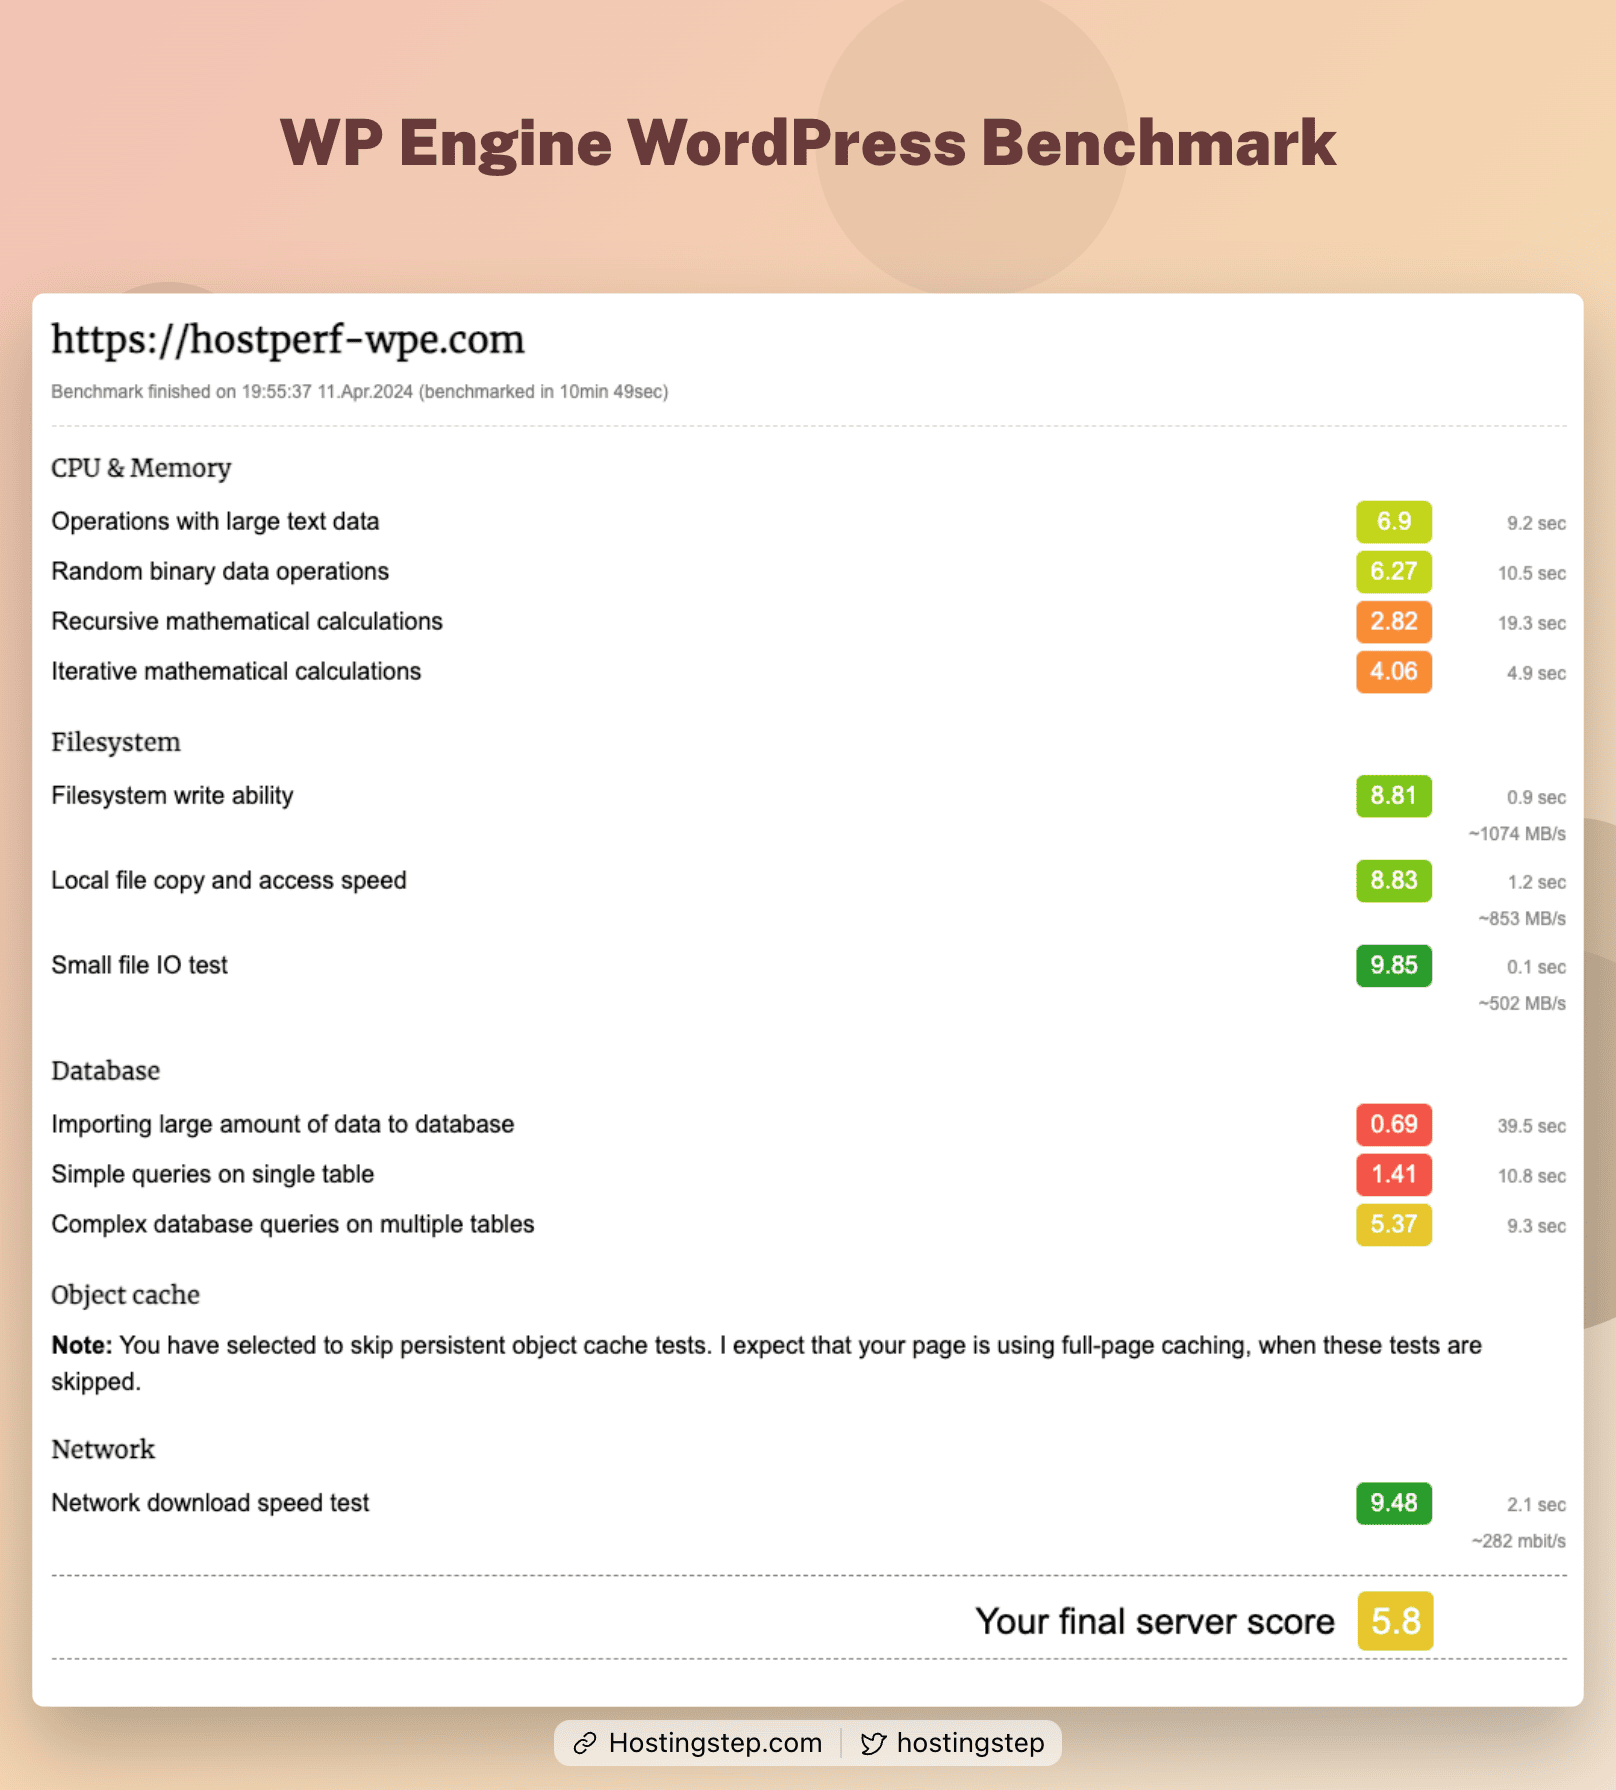
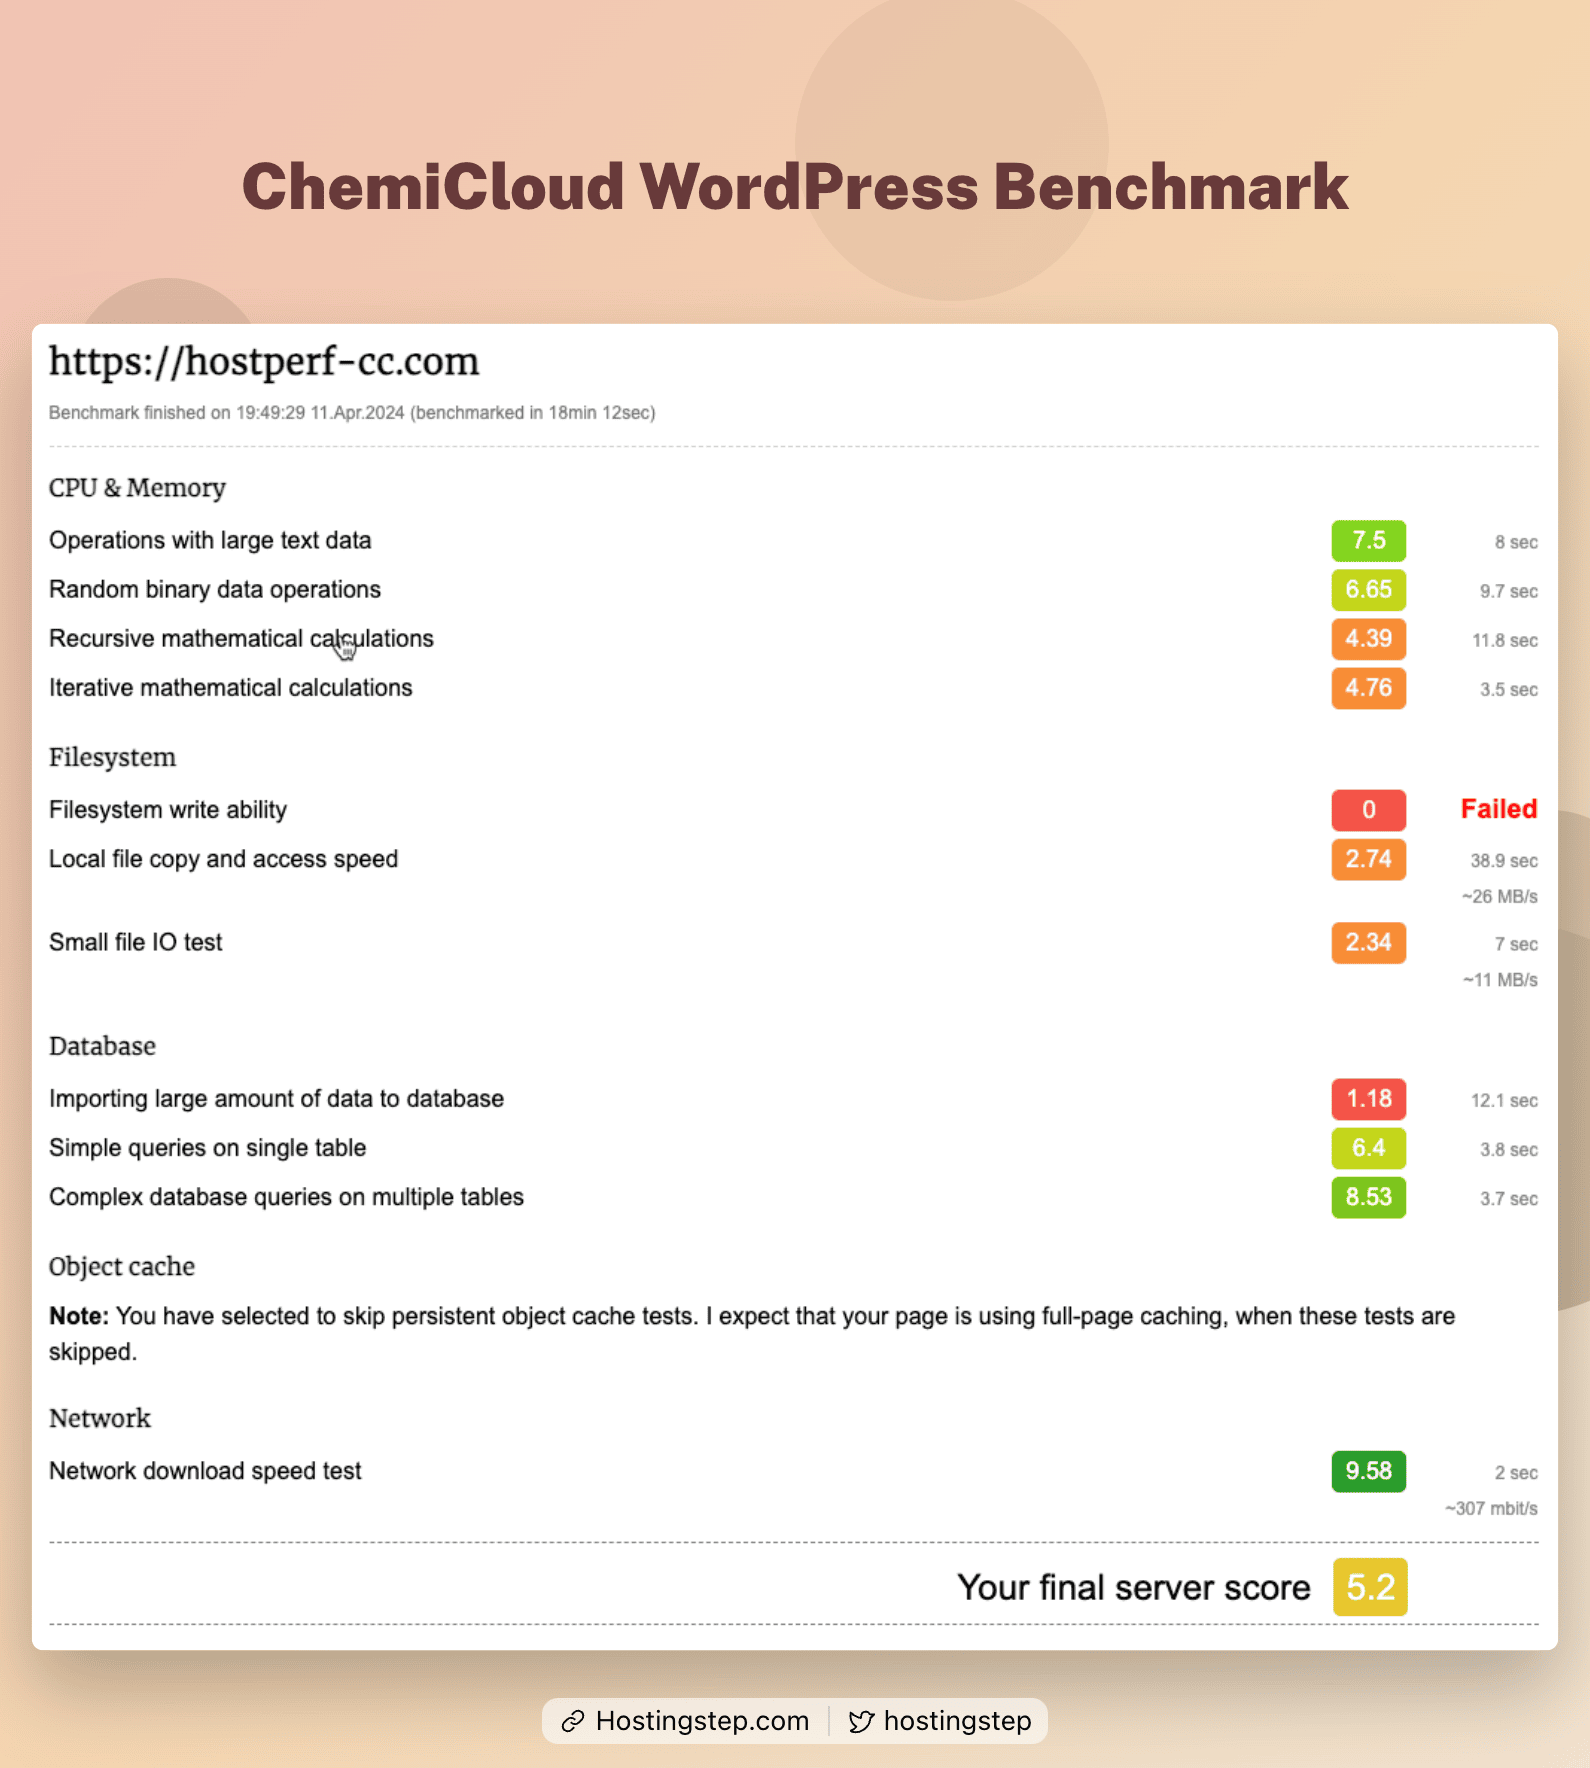
Nexcess, Templ, and Cloudways had decent server scores of 7.8, 6.9, and 6.9, respectively. However, DreamPress, WP Engine, and ChemiCloud’s results are disappointing.
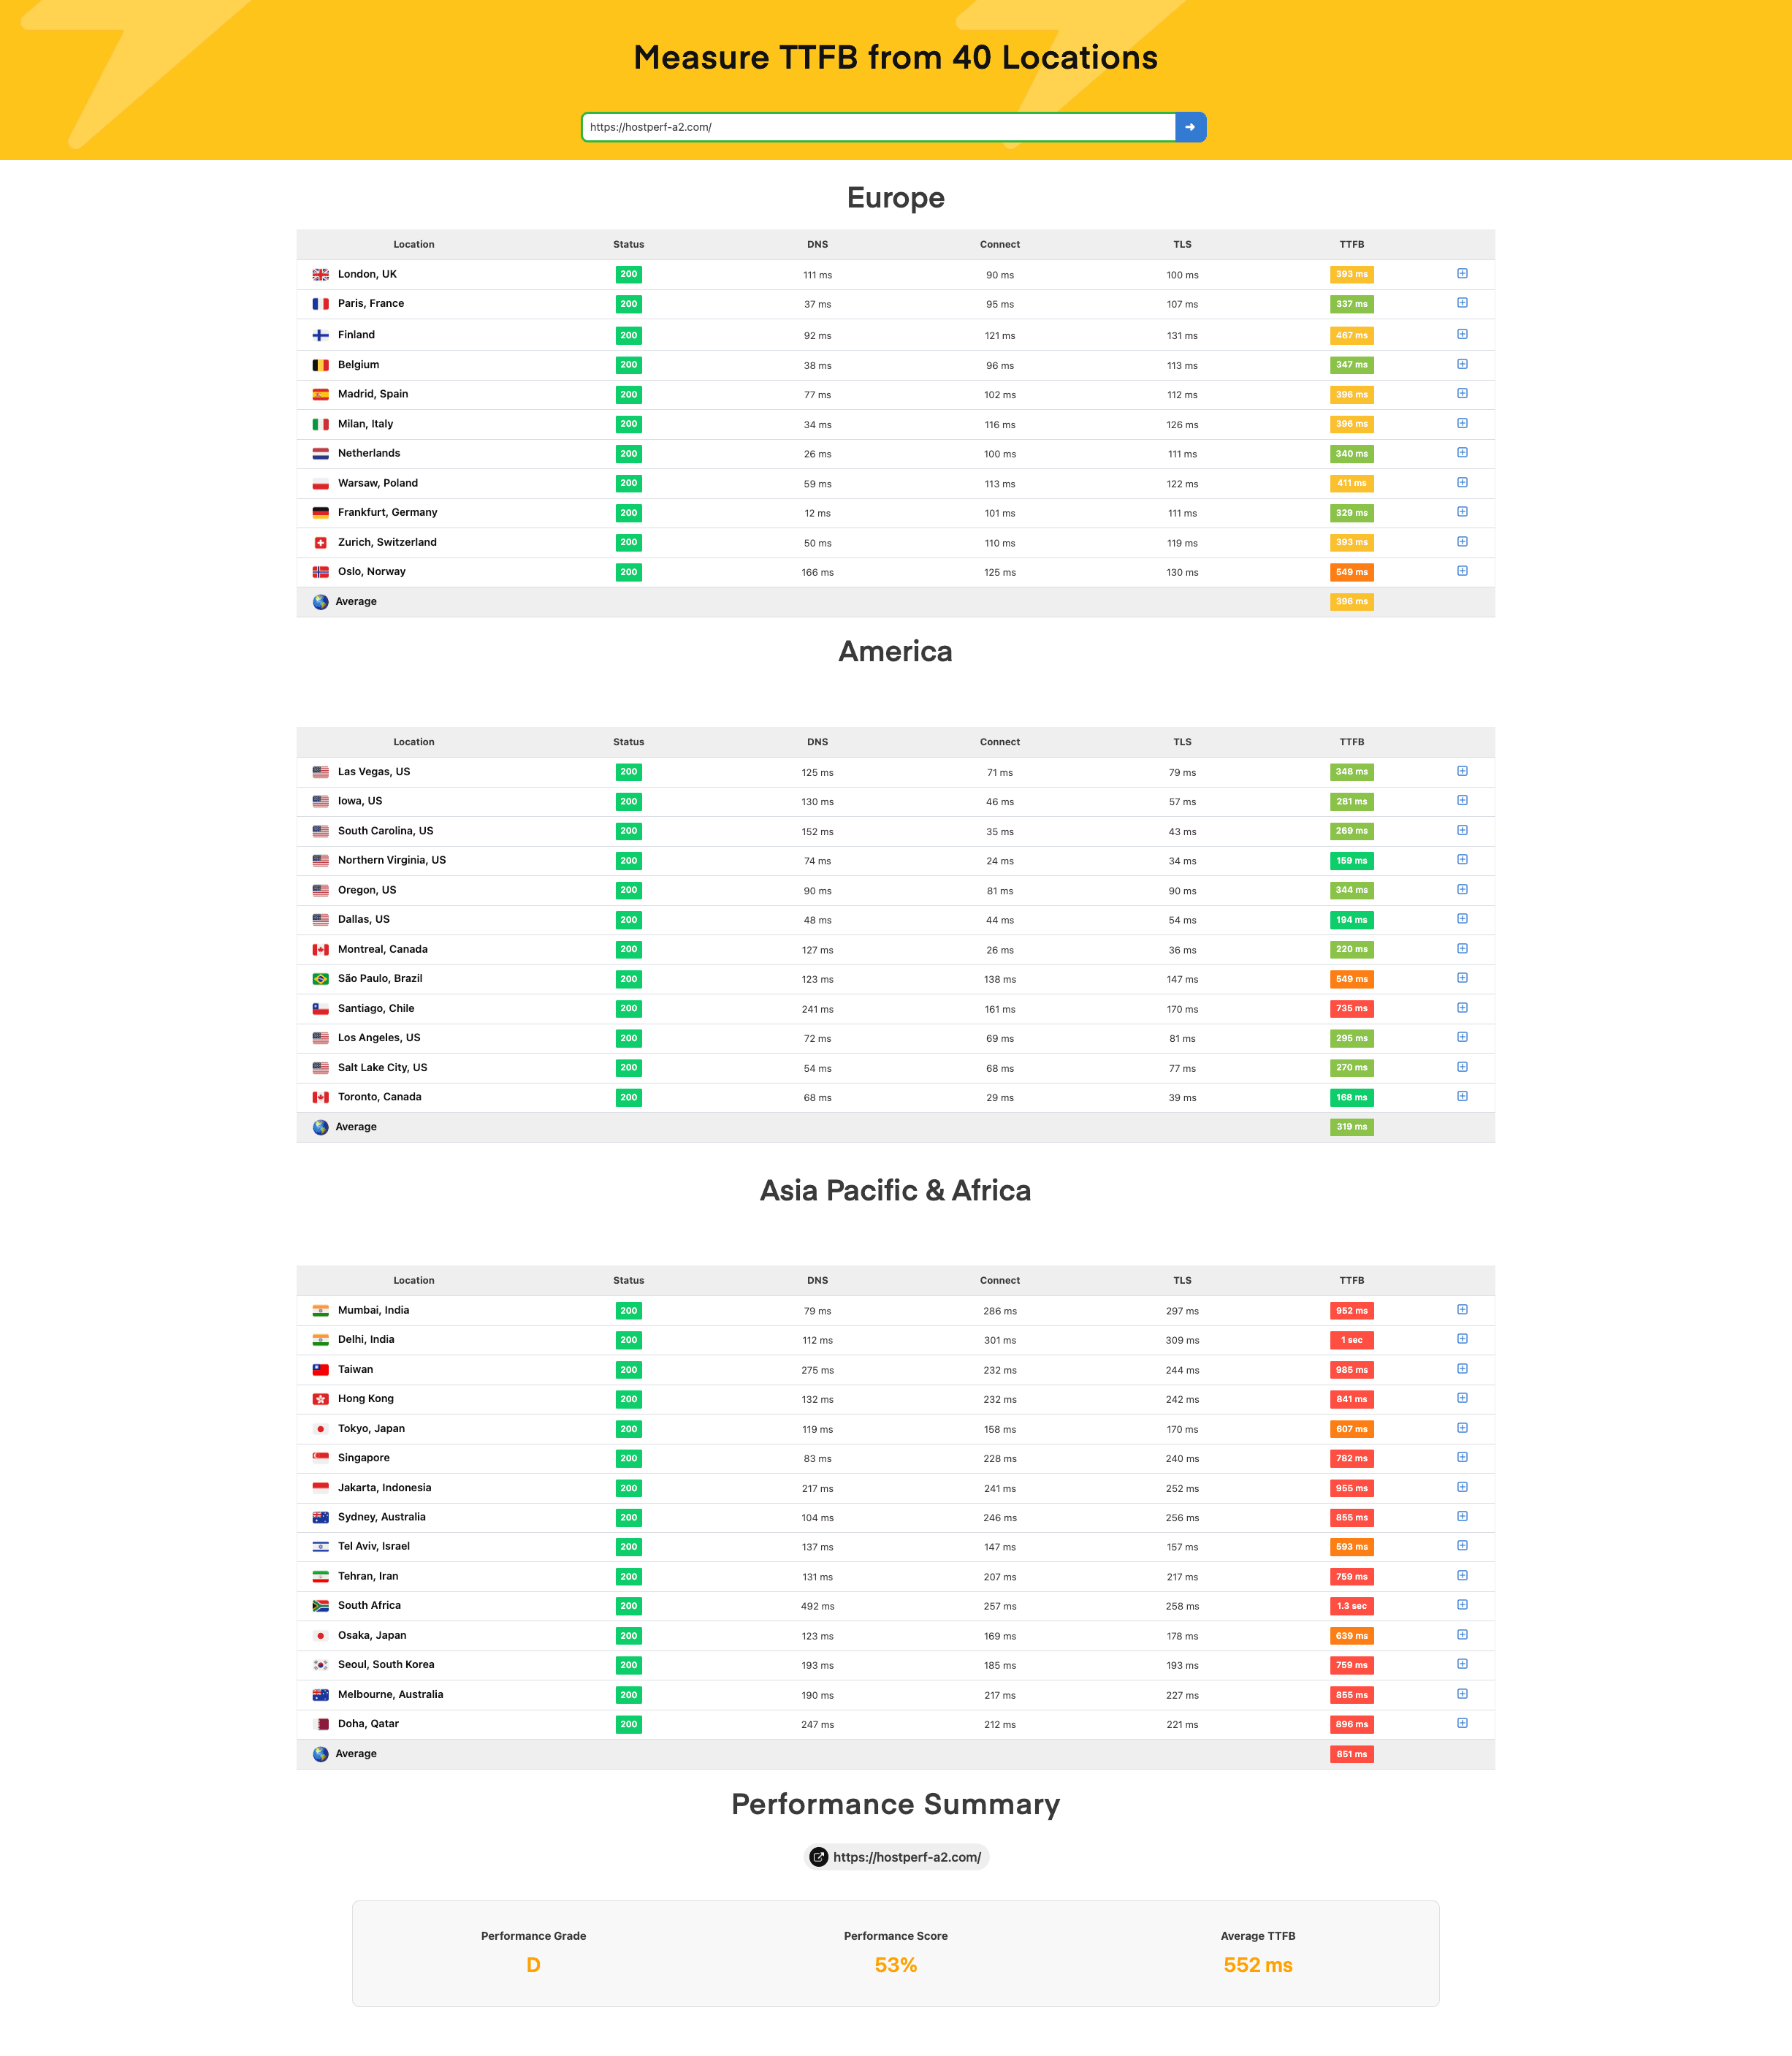
Benchmark Test 5 – Global TTFB Test
In the global TTFB test, sites are pinged from 40 international locations to measure the Global TTFB. If your site audience is globally distributed, then watch out for these results.
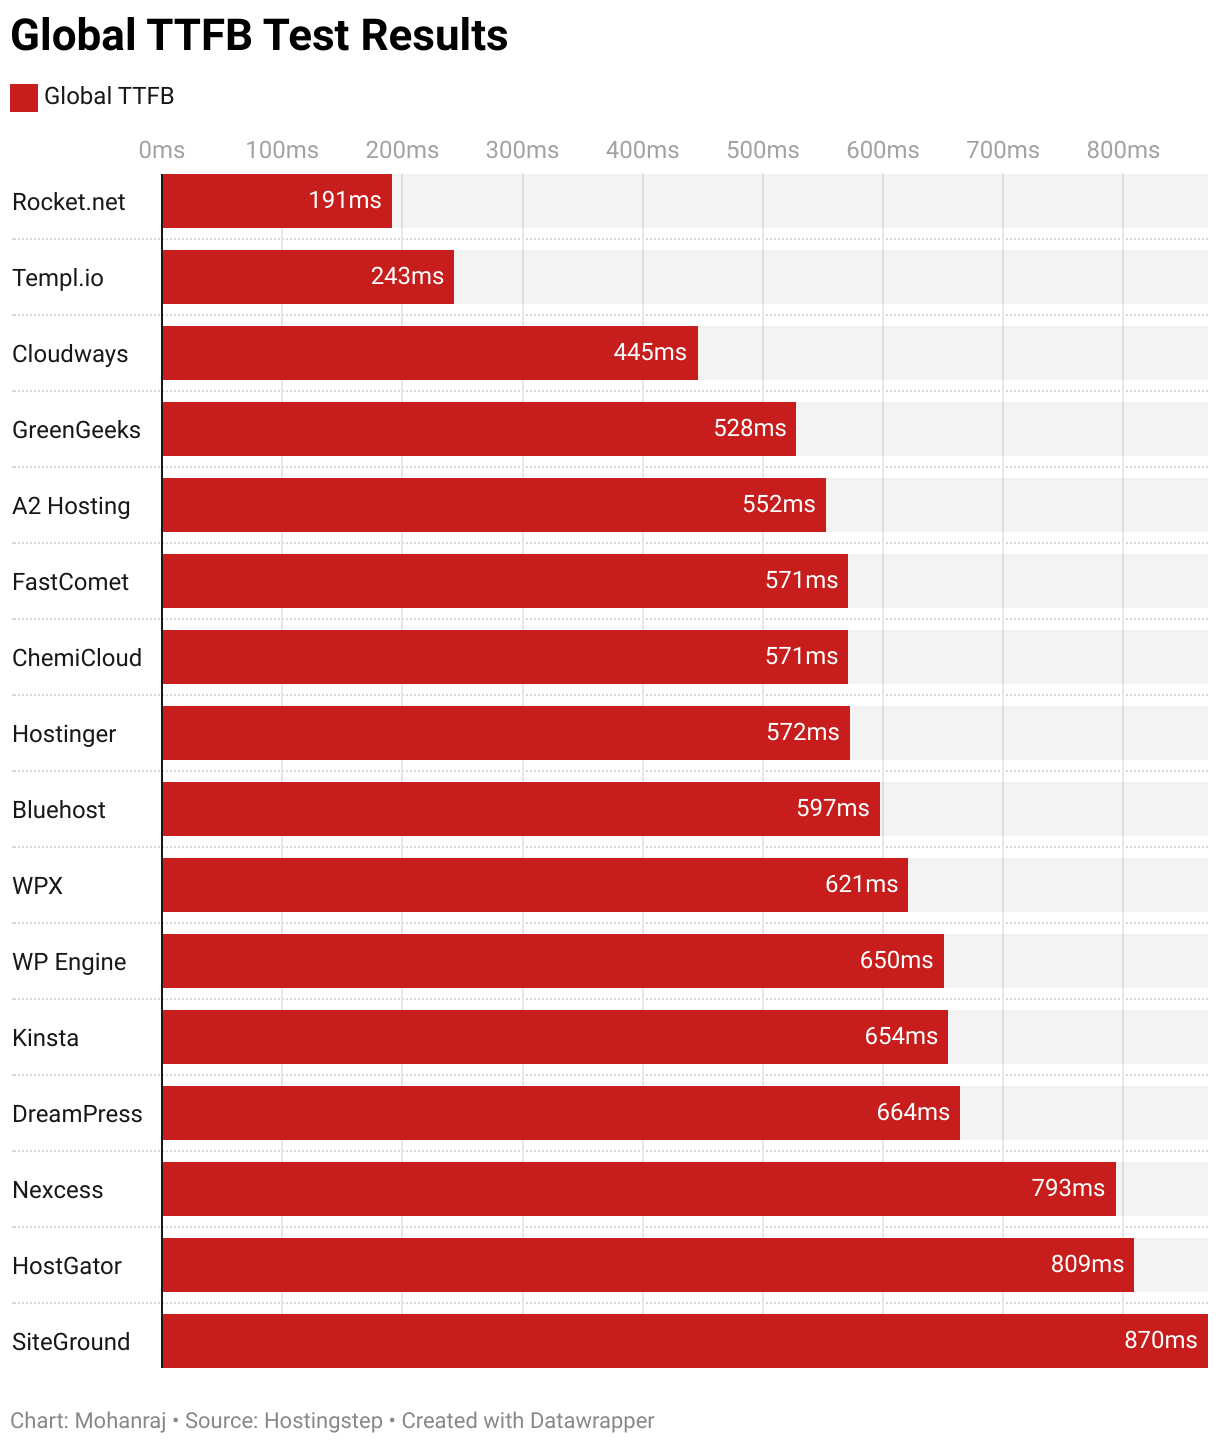
Rocket.net is in a different league with 191 ms global TTFB, all thanks to Cloudflare Enterprise full-page caching.
The most interesting result comes from Templ, which was tested without CDN/full-page caching yet secured a global TTFB of 243 ms.
Cloudways came third with 445 ms. GreenGeeks is the first shared hosting company with the fastest global TTFB of 528 ms, followed by A2 Hosting and FastComet.
ChemiCloud and Hostinger performed decently, with 571 ms and 572 ms, respectively. WPX, which had a good run in all the tests, made a dent here with 621 ms. This could be one reason why their TTFB is not consistent, as seen on the Pingdom graph.
SiteGround secured the slowest TTFB among all hosts, even slower than HostGator. For the first time, WP Engine and Kinsta secured similar scores in a single test of 650 ms and 654 ms, respectively.
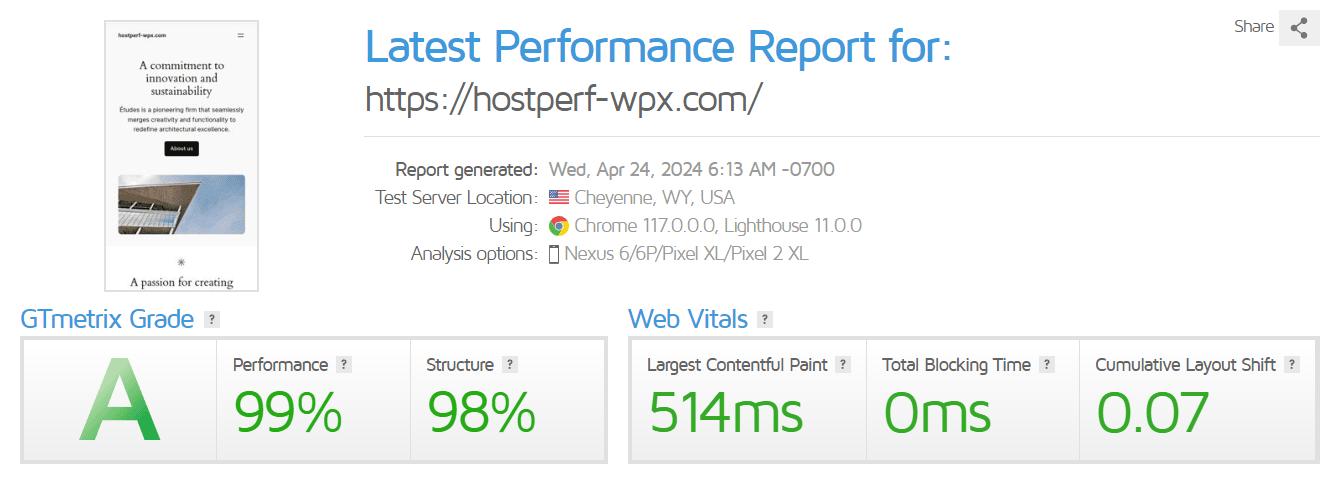
Benchmark Test 6 – Core Web Vitals
Core Web Vitals is Google’s new standard for Web Performance. The sites are tested using GTmetrix, and the Core Web Vitals metrics like Largest Contentful Paint, Total Blocking Time, and Cumulative Layout Shift are calculated in this test.
Results
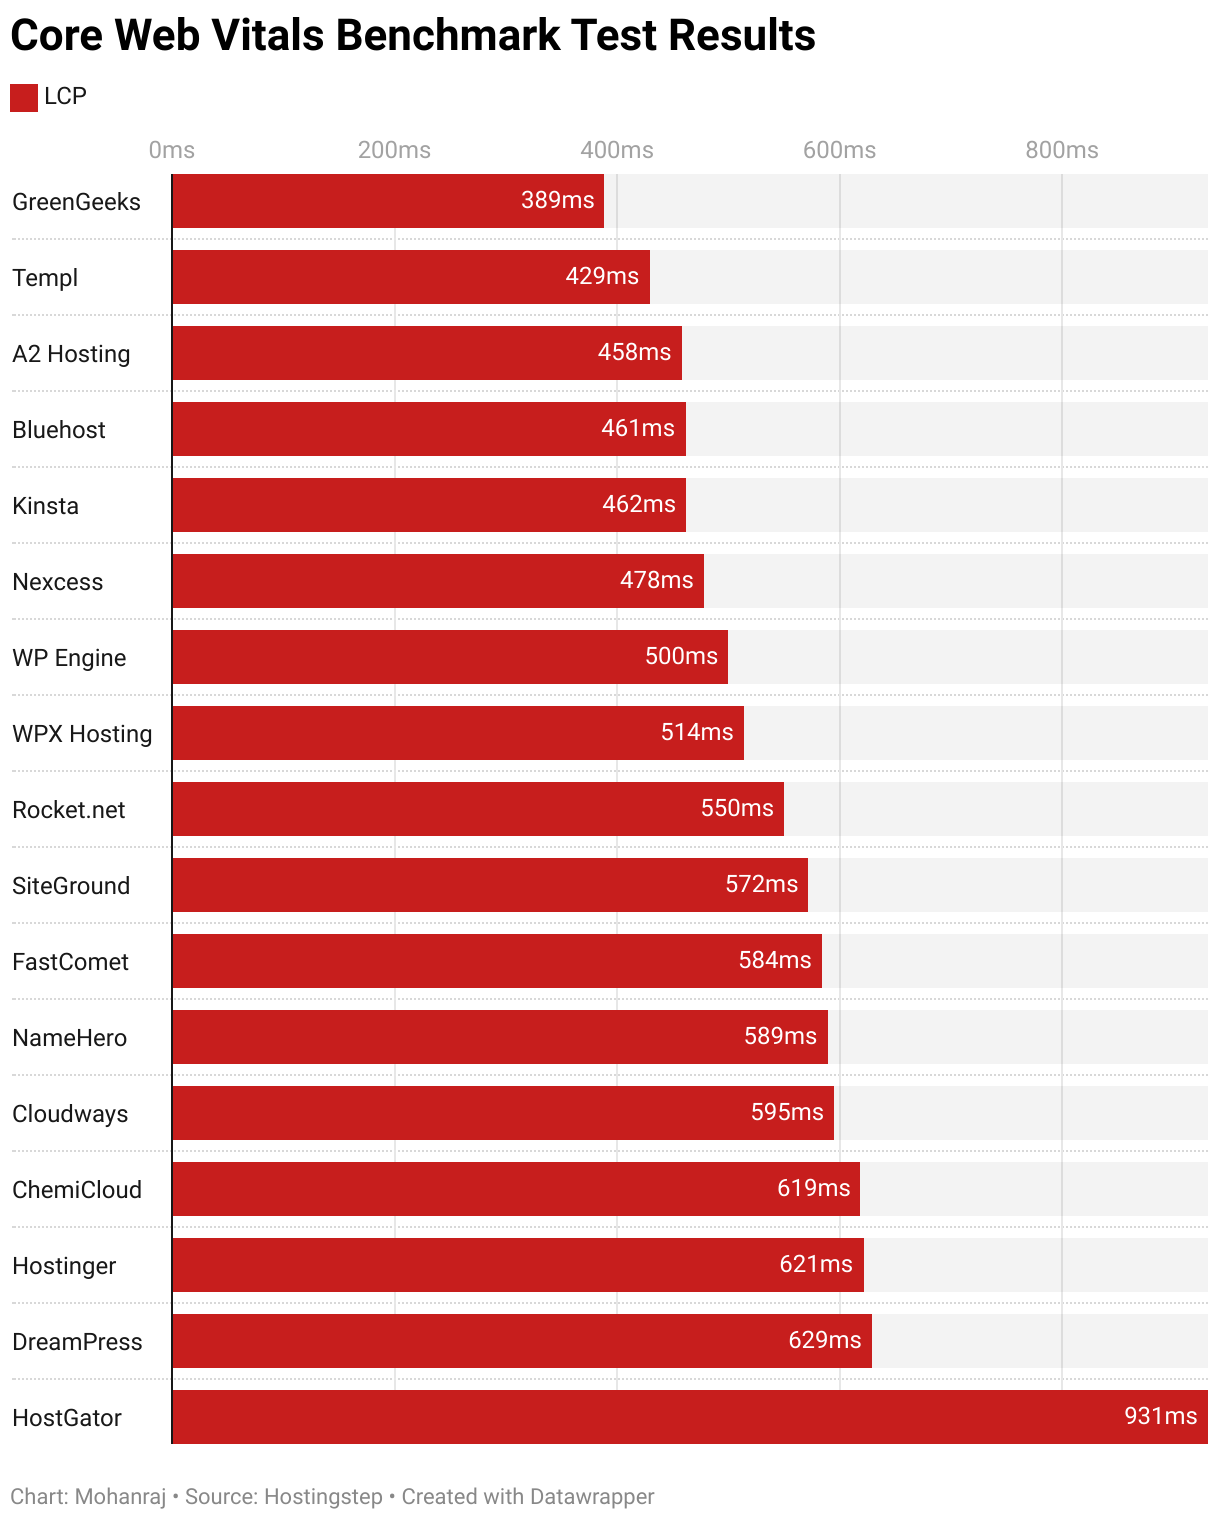
As per Google, the Largest Contentful Paint LCP time should be less than 2.5 seconds to be called Good. With the logic, all the hosts have scored less than 2.5 seconds. However, these lab data won’t correlate with field data from real users.
Overall Performance Results:
With our 12 months of rigorous testing across multiple performance metrics, we’ve compiled a list of key findings to give you a complete overview of WordPress hosting performance.
Summary of Key Findings:
- Rocket.net consistently ranked at or near the top in most tests, particularly in TTFB, uptime, load testing, and global TTFB.
- Kinsta showed strong performance across tests, especially in load testing and WPBenchmarks.
- WPX recorded good results in several tests, including 100% uptime and strong load testing performance.
- Some shared hosting providers performed better than expected, outperforming more expensive managed WordPress hosts.
- GreenGeeks stood out with impressive results in global TTFB and Core Web Vitals. A2 Hosting and FastComet also performed well in various tests.
- While many Managed WordPress hosts like Kinsta performed well, others like WP Engine and DreamPress showed disappointing results in several tests.
- WP Engine, in particular, had below-average scores on all tests.
- Rocket, Templ, and WPX got 100% uptime. DreamPress had the lowest uptime at 99.82%, with nearly 16 hours of downtime.
Top Performers in Various Categories
Best TTFB (Time to First Byte)
- Rocket.net (279 ms)
- Templ (313 ms)
- WPX (329 ms)
Best TTFB Without CDN
- Templ (313 ms)
- Cloudways (332 ms)
- GreenGeeks (332 ms)
Best Uptime:
- Rocket.net (100%)
- Templ (100%)
- WPX (100%)
Best Uptime (Shared Hosting only)
- A2 Hosting (99.99%)
- SiteGround (99.99%)
- FastComet (99.98%)
Best Load Testing Performance:
- Rocket.net (19 ms)
- Kinsta (27 ms)
- WPX (32 ms)
Best WPBenchmarks score
- Kinsta (8.6/10)
- Rocket (8.5/10)
- WPX (8.2/10)
Best Global TTFB:
- Rocket.net (191 ms)
- Templ (243 ms)
- Cloudways (445 ms)
Best Core Web Vitals (Largest Contentful Paint)
- GreenGeeks (389 ms)
- Templ (429 ms)
- A2 Hosting (458 ms)
- GreenGeeks
- A2 Hosting
- FastComet
- Rocket
- Kinsta
- Templ
- Templ
- GreenGeeks
- A2 Hosting
Benchmark Review Of All Tested Hosting Companies:
A2 Hosting is easily one of the best shared hosting options for beginners. In the TTFB, uptime, or load test, it beats most other shared and managed WordPress hosting services. The WPBenchmark hardware scores are average, but that isn’t going to make a big impact on its performance.
Compared to last year’s benchmark scores, Bluehost has improved greatly in its speed and uptime score. Their load test score is not bad, either. Their WPBenchmark score improved compared to last year, so I think they improved the server architecture. However, Bluehost can’t top at any tests.
Cloudways powered by DigitalOcean is a great managed Cloud hosting option for getting started. Their TTFB, Uptime, Load testing, WPBenchmark, etc., are perfect and worth the price.
ChemiCloud benchmark scores have slipped compared to last year. Their uptime is below average, and the load handling also got worse.
Data shows that DreamPress can be avoided at all costs. Although their prices increase every year, their Speed, Uptime, load handling, etc., worsen.
FastComet improved their speed, uptime, and load handling by 2x compared to last year. The load testing score is the most impressive, as the scores were below par last year. It’s definitely a worthy contender for the best shared hosting service.
GreenGeeks is another great shared hosting service, consistently performing in our last two years of testing. They handle the load better, and uptime and TTFB are excellent. Their Global TTFB is super impressive, making them suitable for sites with global visitors.
Hostinger’s uptime has improved compared to last year. However, their load testing still needs improvement. They recently upgraded their plans with upgraded server specs, such as more PHP workers, SQL connections, etc., which might explain their improved WPBenchmark hardware score.
HostGator is the only shared hosting service that should be avoided at all costs. Its performance is below par on all the tests, and nothing is good to discuss.
Kinsta’s load handling is one of the best among all the hosts tested, and even with increasing load, their response time remained the same. Their TTFB, uptime, and WPBenchmark hardware scores are excellent, making them one of the greatest Managed WordPress hosting services.
Nexcess scores are above average in all the tests, but it can’t perform better than its competitors. Considering the overall performance in all the tests, I give Nexcess a buy call.
Rocket.net looked better at all the tests. Their Global TTFB is top-notch and has a good WPBenchmark score. It has the best load testing score, so it’s good to trust them for high-traffic sites. Easily my recommended Managed WordPress host in 2024.
SiteGround’s uptime and load testing scores have improved compared to last year.
Templ’s load testing scores used to be the best but slightly slipped this year. Yet, the scores are still impressive. Whether you take TTFB, Uptime, or global TTFB, Templ’s performance is good. It’s worth considering for affordable Google Cloud WordPress hosting.
WP Engine performance is below par, just like last year. Though they introduced a new Advanced Network for better performance, it does nothing groundbreaking. I can’t test them for load test as the test gets blocked due to security.
WPX:
WPX’s performance has improved dramatically. They had frequent downtimes in 2021, and now, in 2024, it’s 100%. Their load handling is excellent. The TTFB is great, but the global TTFB is below par.