We are back again for our 2024 edition of WordPress Hosting Benchmarks.
We have been testing popular WordPress hosting companies for over three years, and we took last whole year data (January 1, 2023 to December 31, 2023) to write up this 2024 Hosting benchmarks.
Contents
WordPress Hosting Benchmark Methodology:
Our WordPress Hosting benchmark is simple. We sign up as a customer to popular hosting service, buy hosting account, deploy a test site and put the site for testing.
All the test sites are installed with WordPress Twenty Twenty-Four Theme, Akismet, Contact Form 7 and Rank Math WordPress plugins. The caching is enabled by default on Managed WordPress hosting services. For shared hosting services, we added “WP Fastest Cache” plugin to enable caching.
I have included the hosting plan details, data center location, CDN usage and benchmark start date in the below table.
| Hosting | Type | Plan | Price (monthly) | Test Site Datacenter Location | CDN | Benchmark Start Date |
|---|---|---|---|---|---|---|
| A2 Hosting | Shared | Startup | $2.99 | Michigan (US East Coast) | No | September 1, 2020 |
| Bluehost | Shared | WordPress Basic Hosting | $2.95 | Provo, Utah | No | November 16, 2022 |
| ChemiCloud | Shared | Starter | $2.95 | Dallas | No | August 25, 2020 |
| Cloudways | Managed Cloud | DigitalOcean Standard | $11 | New York | No | August 25, 2020 |
| DreamPress | Managed WordPress | DreamPress | $16.95 | Ashburn Virginia | No | January, 30, 2021 |
| FastComet | Shared | Starter | $2.95 | Newark, USA | No | August 25, 2020 |
| GreenGeeks | Shared | Lite | $2.95 | Chicago, US | No | September 1, 2020 |
| HostGator | Shared | Hatchling | $3.75 | Provo, Utah | No | November 16, 2022 |
| Hostinger | Shared | Single | $2.99 | North Carolina | No | November 30, 2020 |
| Kinsta | Managed WordPress | Starter | $35 | Iowa, Google Cloud | Cloudflare | September 1, 2020 |
| Nexcess | Managed WordPress | Spark | $21 | Southfield, Michigan | Cloudflare | May 1, 2021 |
| Rocket | Managed WordPress | Starter | $30 | Ashburn | Cloudflare Enterprise | October 12, 2020 |
| SiteGround | Shared | Startup | $2.99 | Iowa | No | August 26, 2020 |
| Templ | Managed WordPress | Micro | $15 | North Virginia, Google Cloud | No | February 3, 2021 |
| WP Engine | Managed WordPress | Startup | $35 | North America | Cloudflare | September 1, 2020 |
| WPX Hosting | Managed WordPress | Business | $24.99 | Chicago | WPX XDN | March 26, 2021 |
Tests
TTFB and Uptime Monitoring using Pingdom:
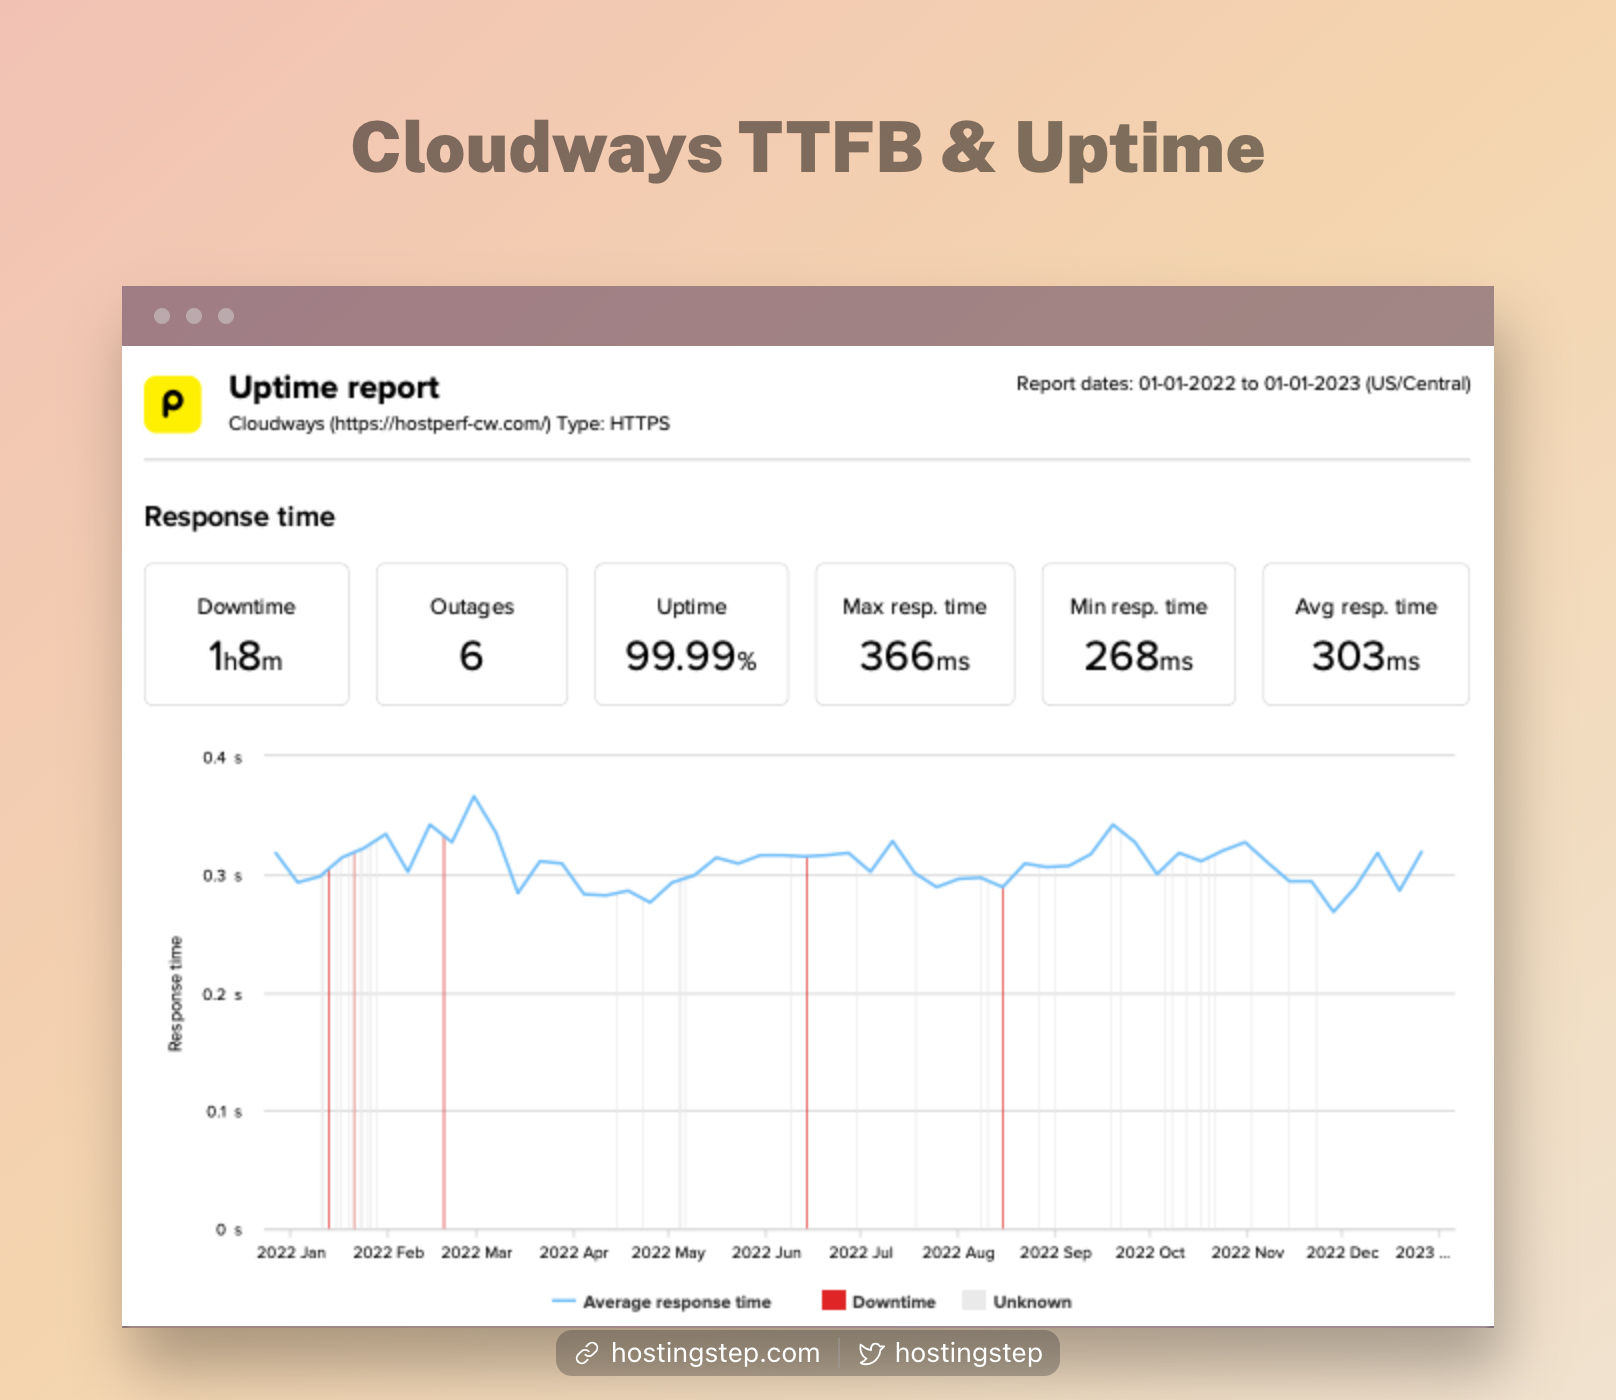
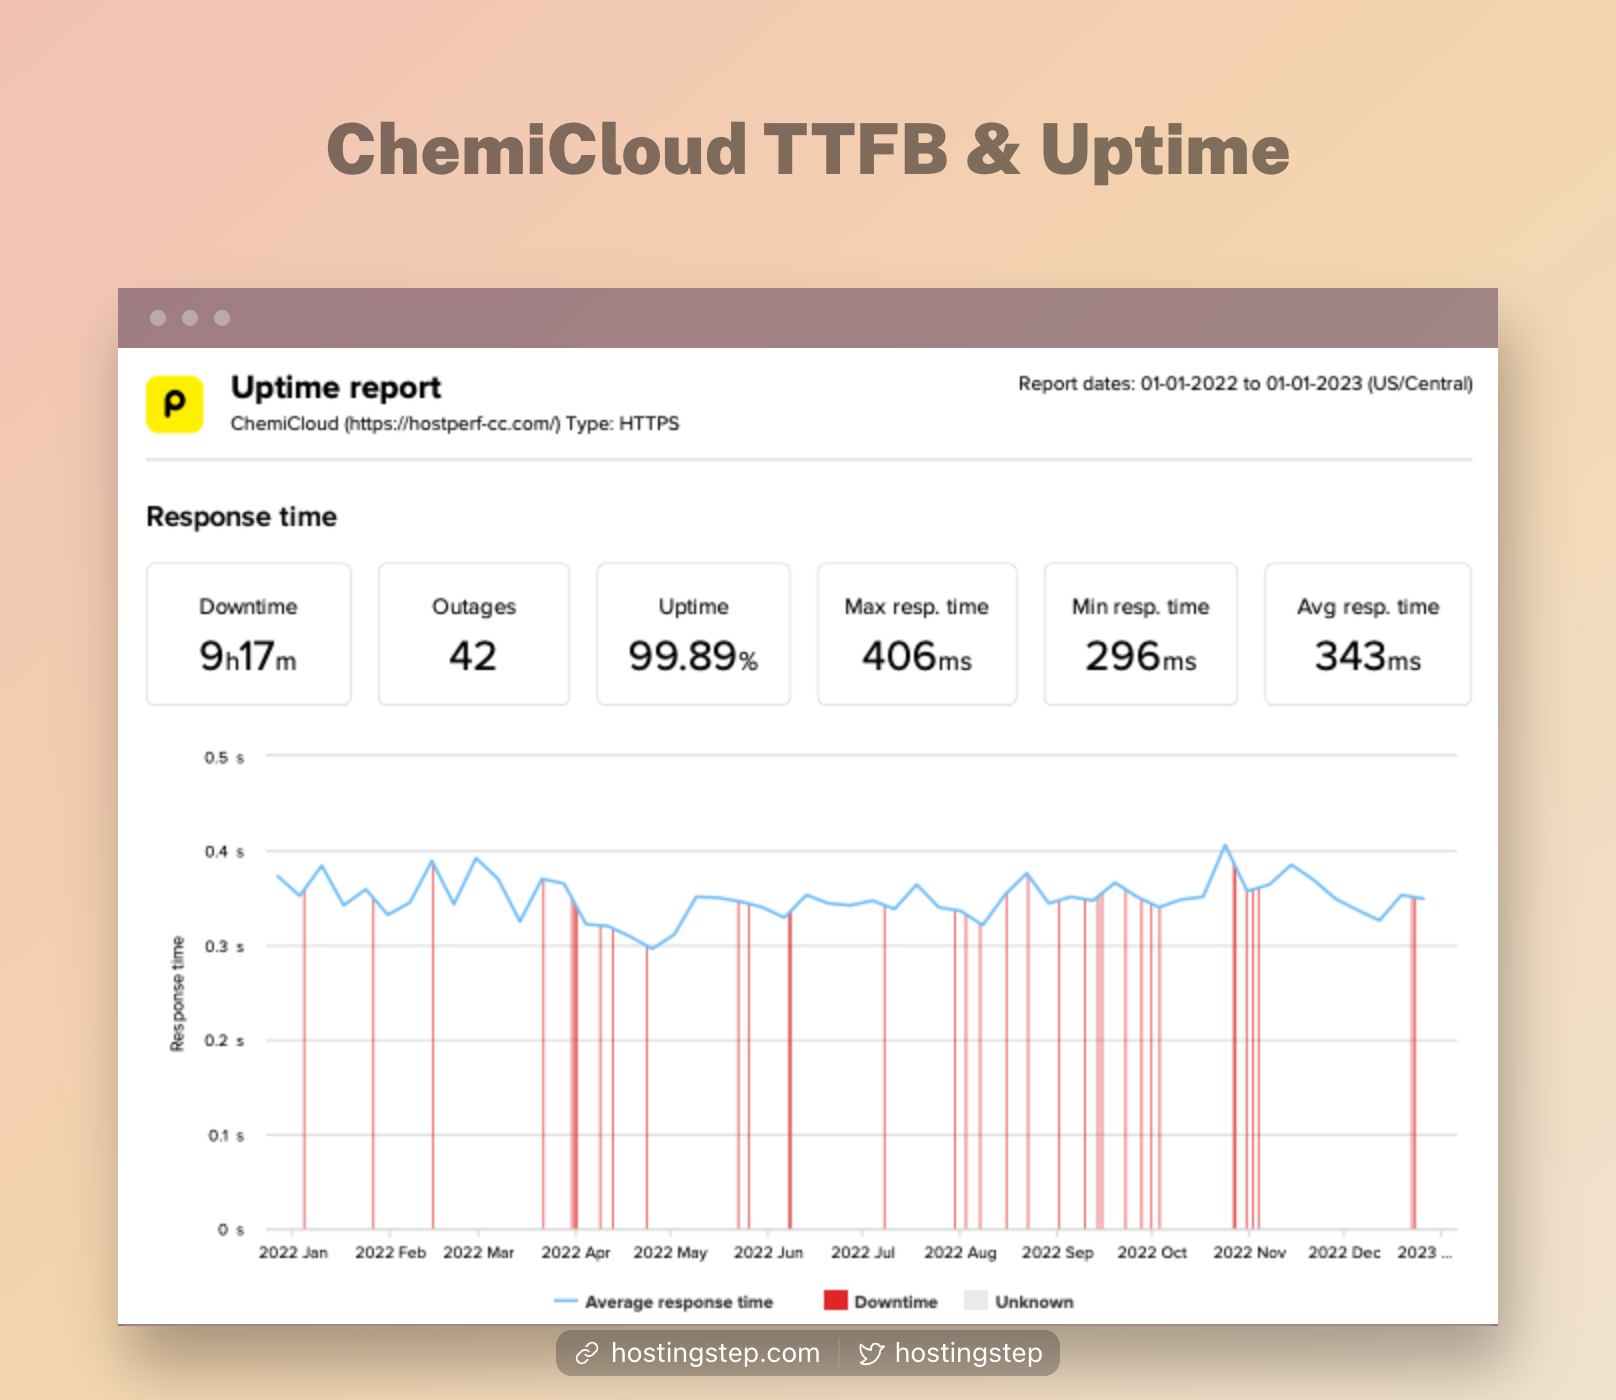
Using Pingdom Synthetic Monitoring tool, the site is monitored from 20+ major cities in United States and Canada. Pingdom collects the TTFB score from all the locations and provides an overall average TTFB score. The uptime is also measured in the same way.
Load Test using Loader.io:
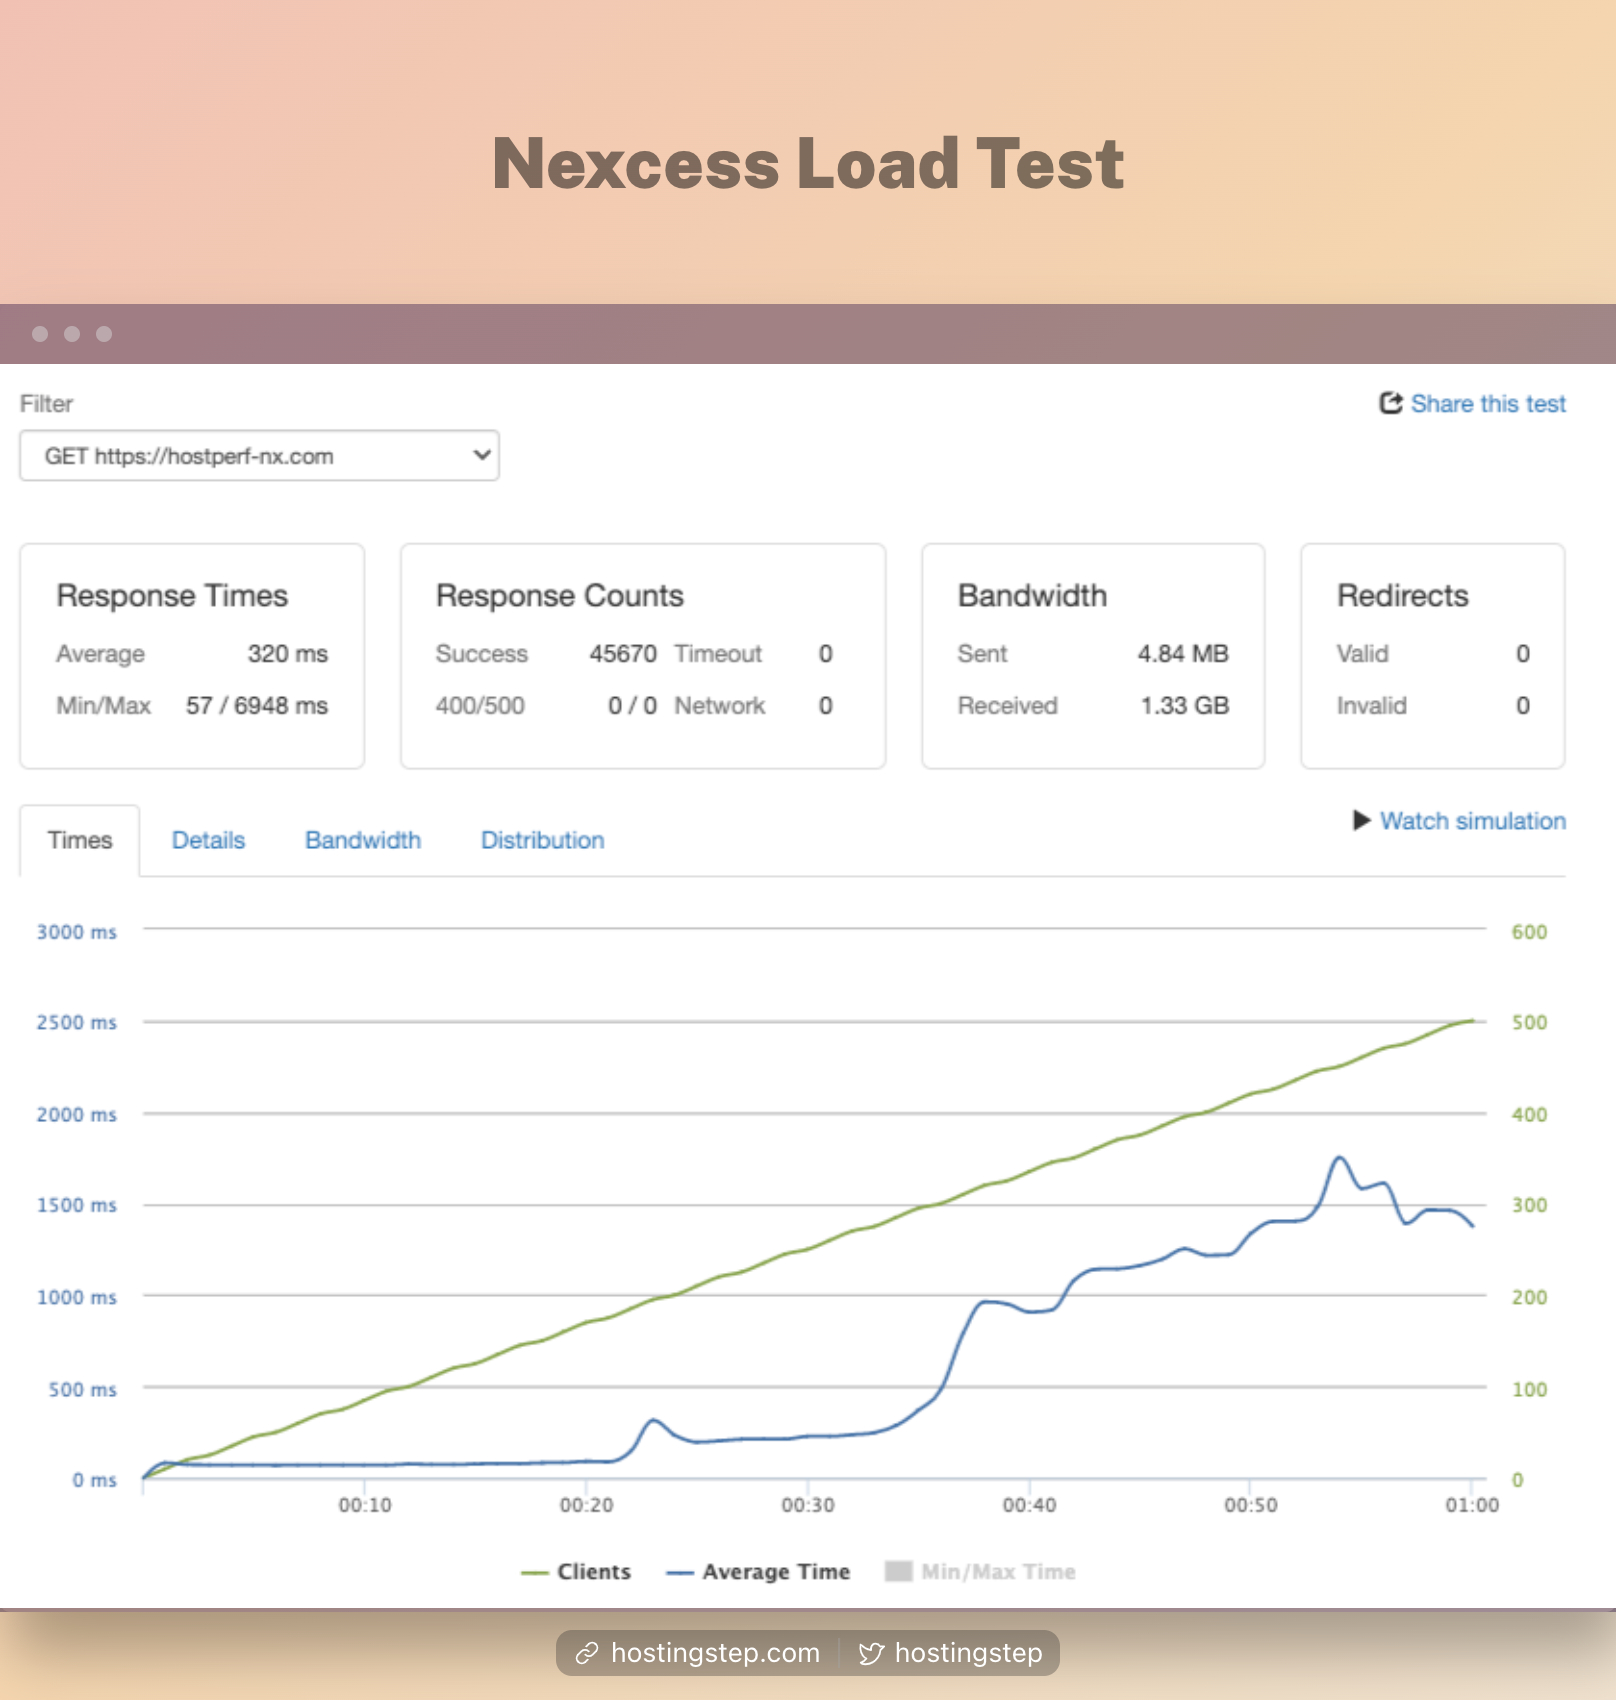
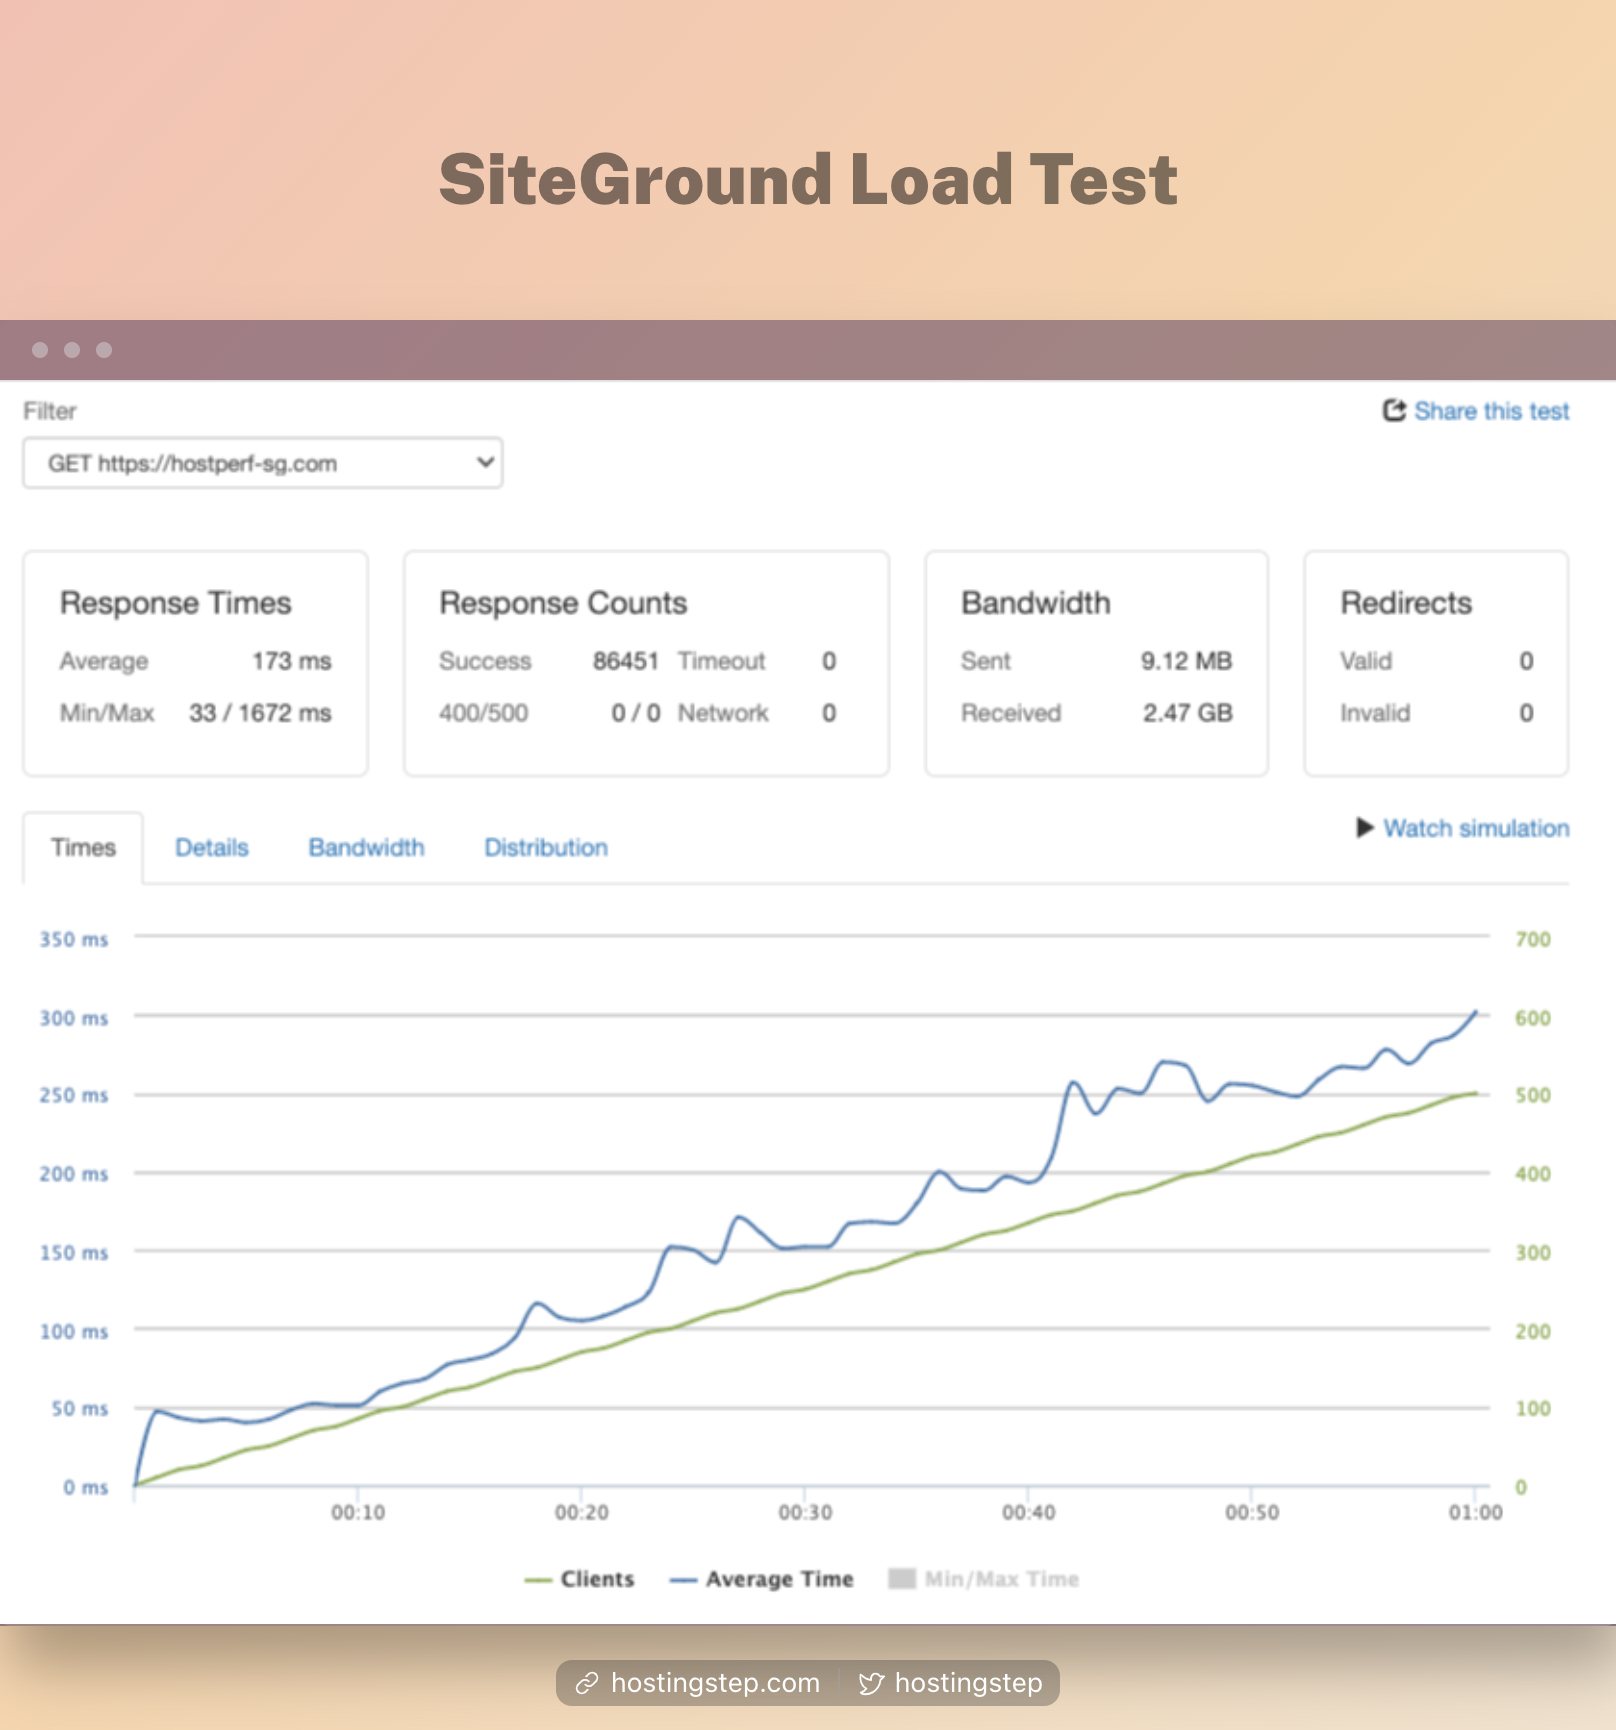
In this test, a 500 constant client load is sent to the site and the average response time is measured. The test are made from Amazon US East data center.
Hardware benchmark using WPBenchmark Plugin:
WPBenchmark is a WordPress plugin that does CPU, Memory, File system, database performance and network speed test. The plugin gives an overall score out of 10.
Core web Vitals using GTmetrix:
GTmetrix is used to measure the Core Web Vitals score of the sites. The test is done from Cheyenne, Wyoming using a simulated mobile device setup.
Global TTFB using SpeedVitals:
Speedvitals tool helps to measure the average TTFB from 40 global locations. This results are much useful for sites with global audience.
tTFB Benchmark Results:
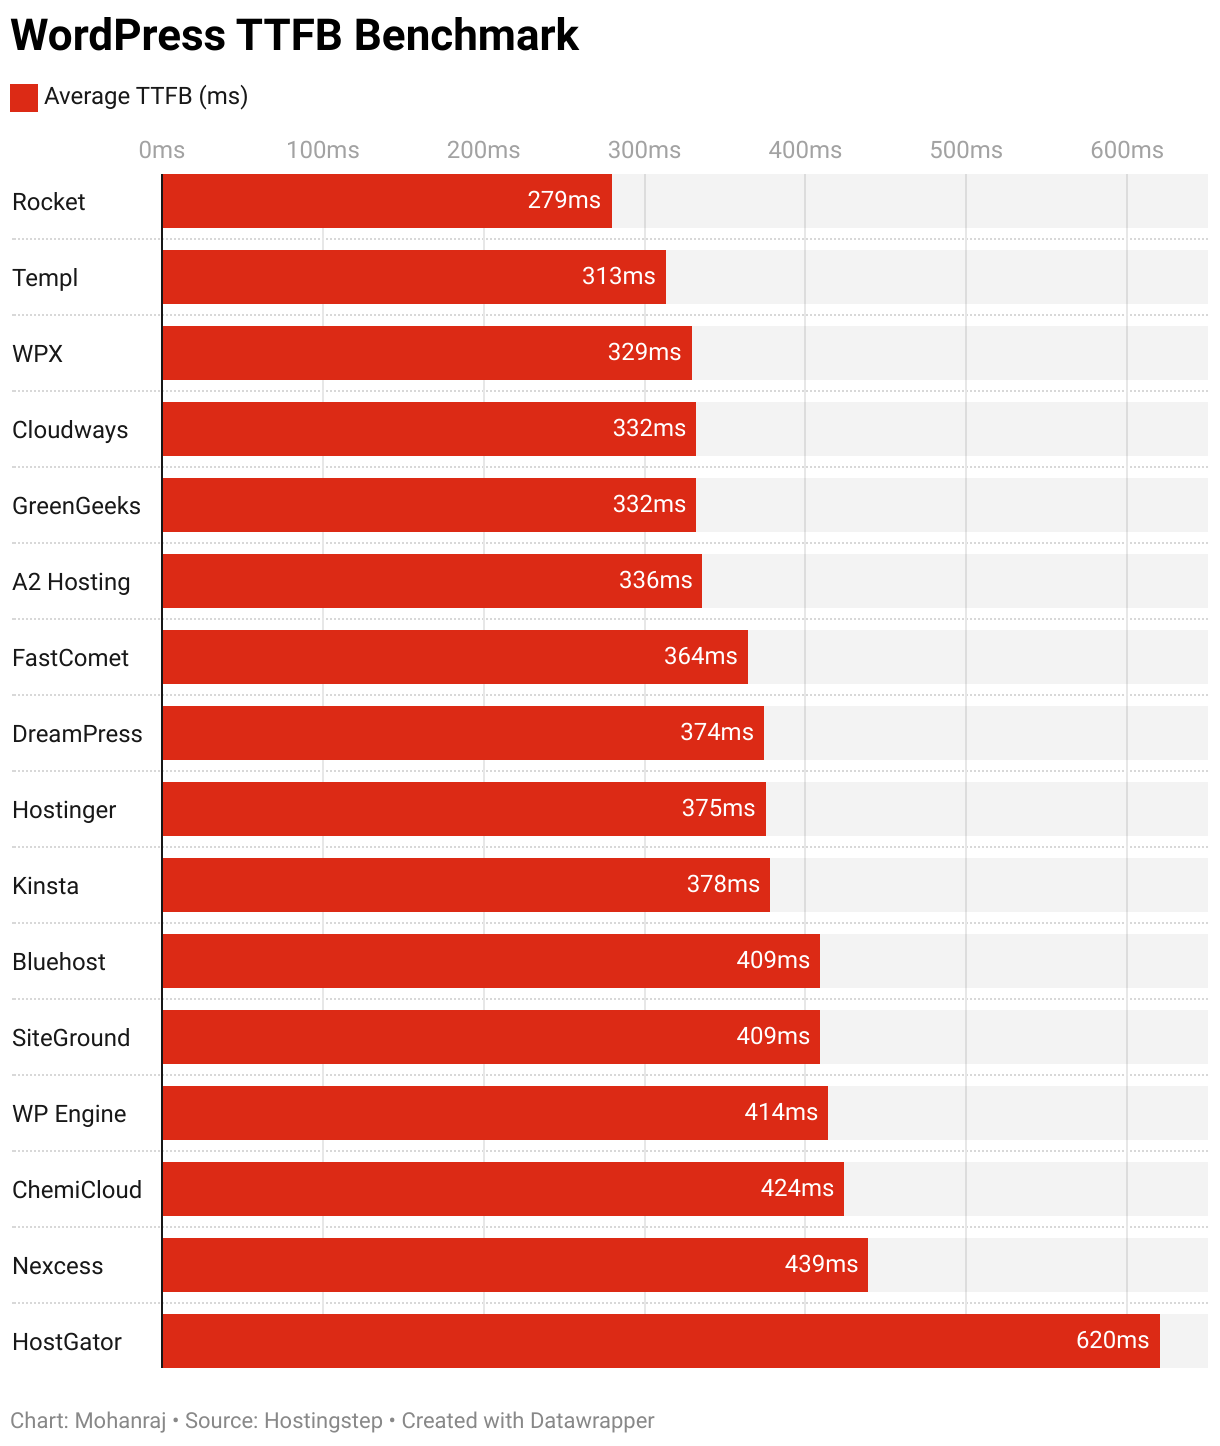
Time to First Byte (TTFB) is the most important factor to choose any WordPress hosting service. Lowering the TTFB score is highly useful in making the site load faster, providing a better user experience and also helps to pass Core Web Vitals.
The Pingdom Sytenthic monitoring tool measures our test site TTFB for every 60 seconds once. A total of 43,800 tests are done in a month to calculate the average TTFB performance.
I took the last whole year data (January 1, 2023 – December 31, 2023) and listed out the hosts with better TTFB to poor TTFB score.
Results
| Hosting | Average TTFB |
|---|---|
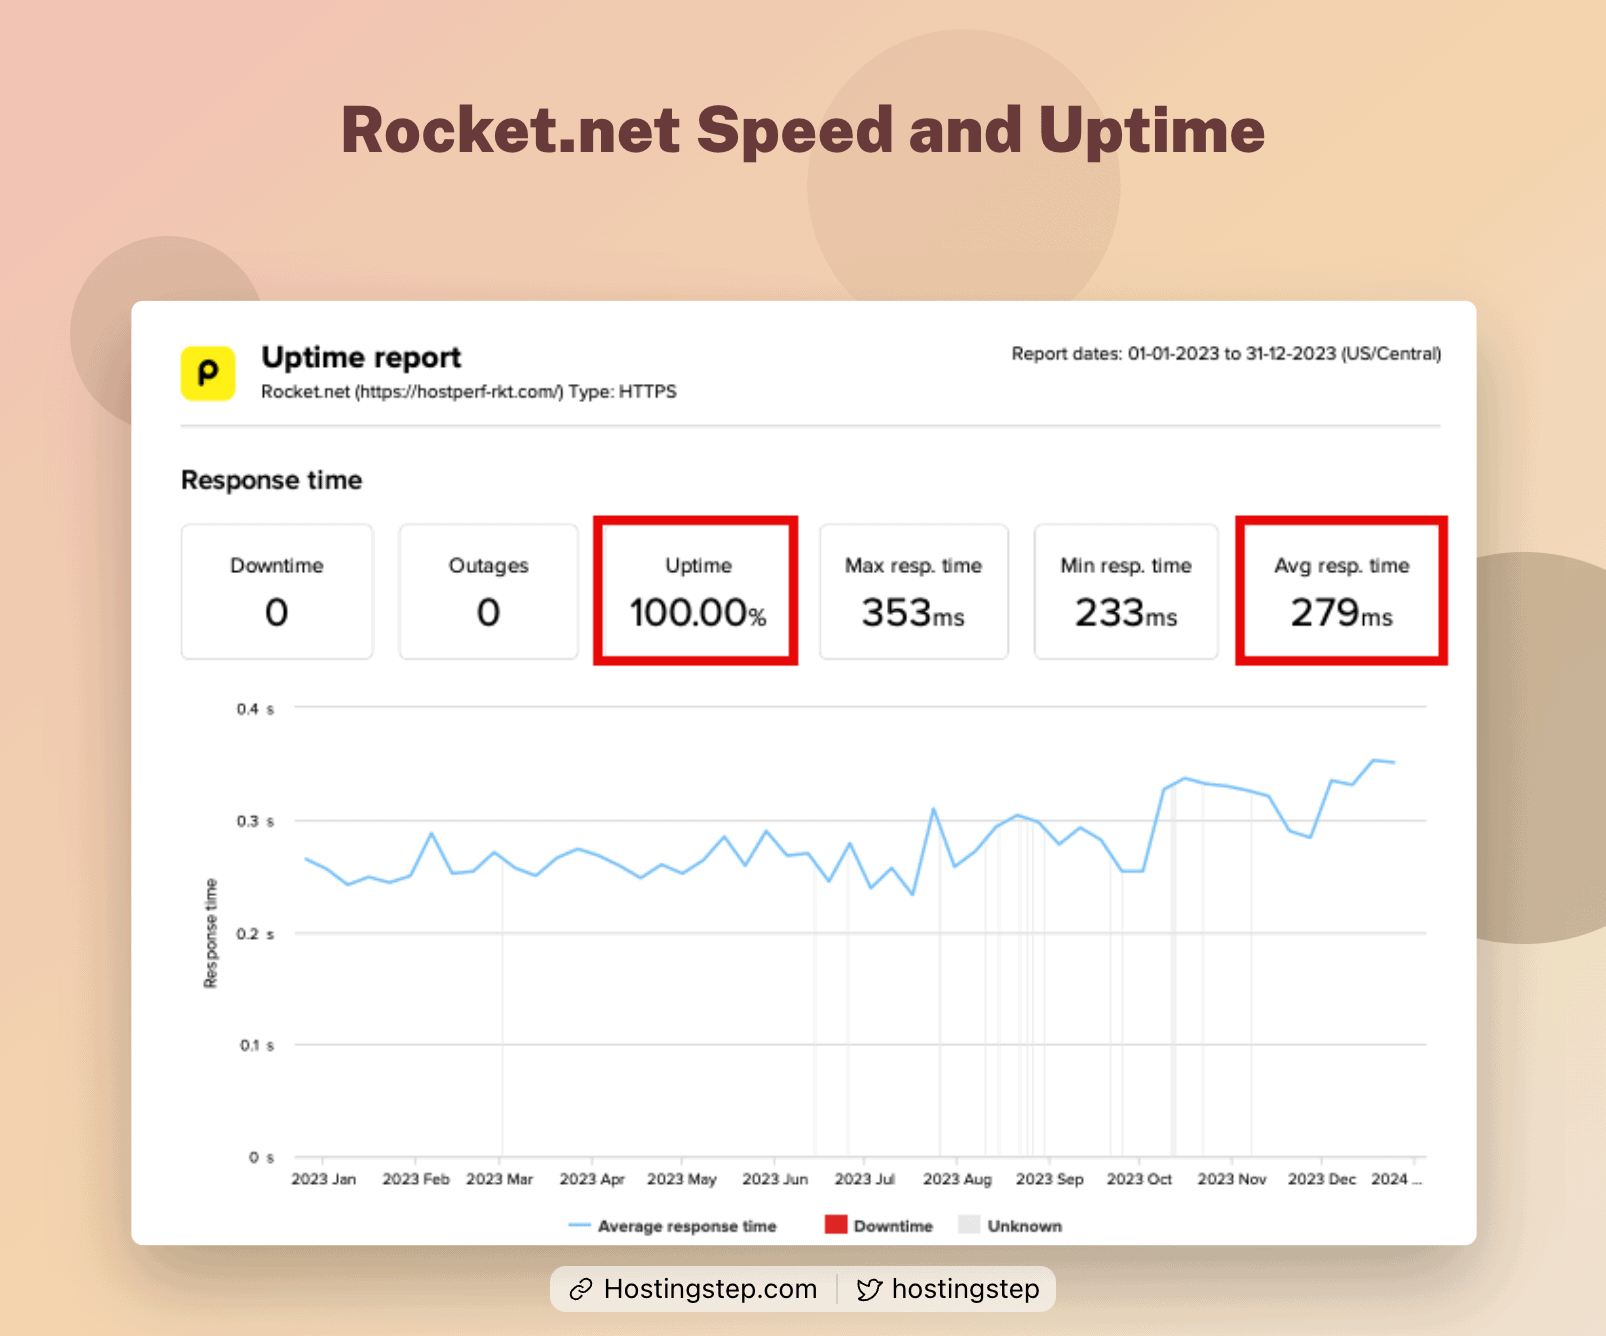
| Rocket.net | 279 ms |
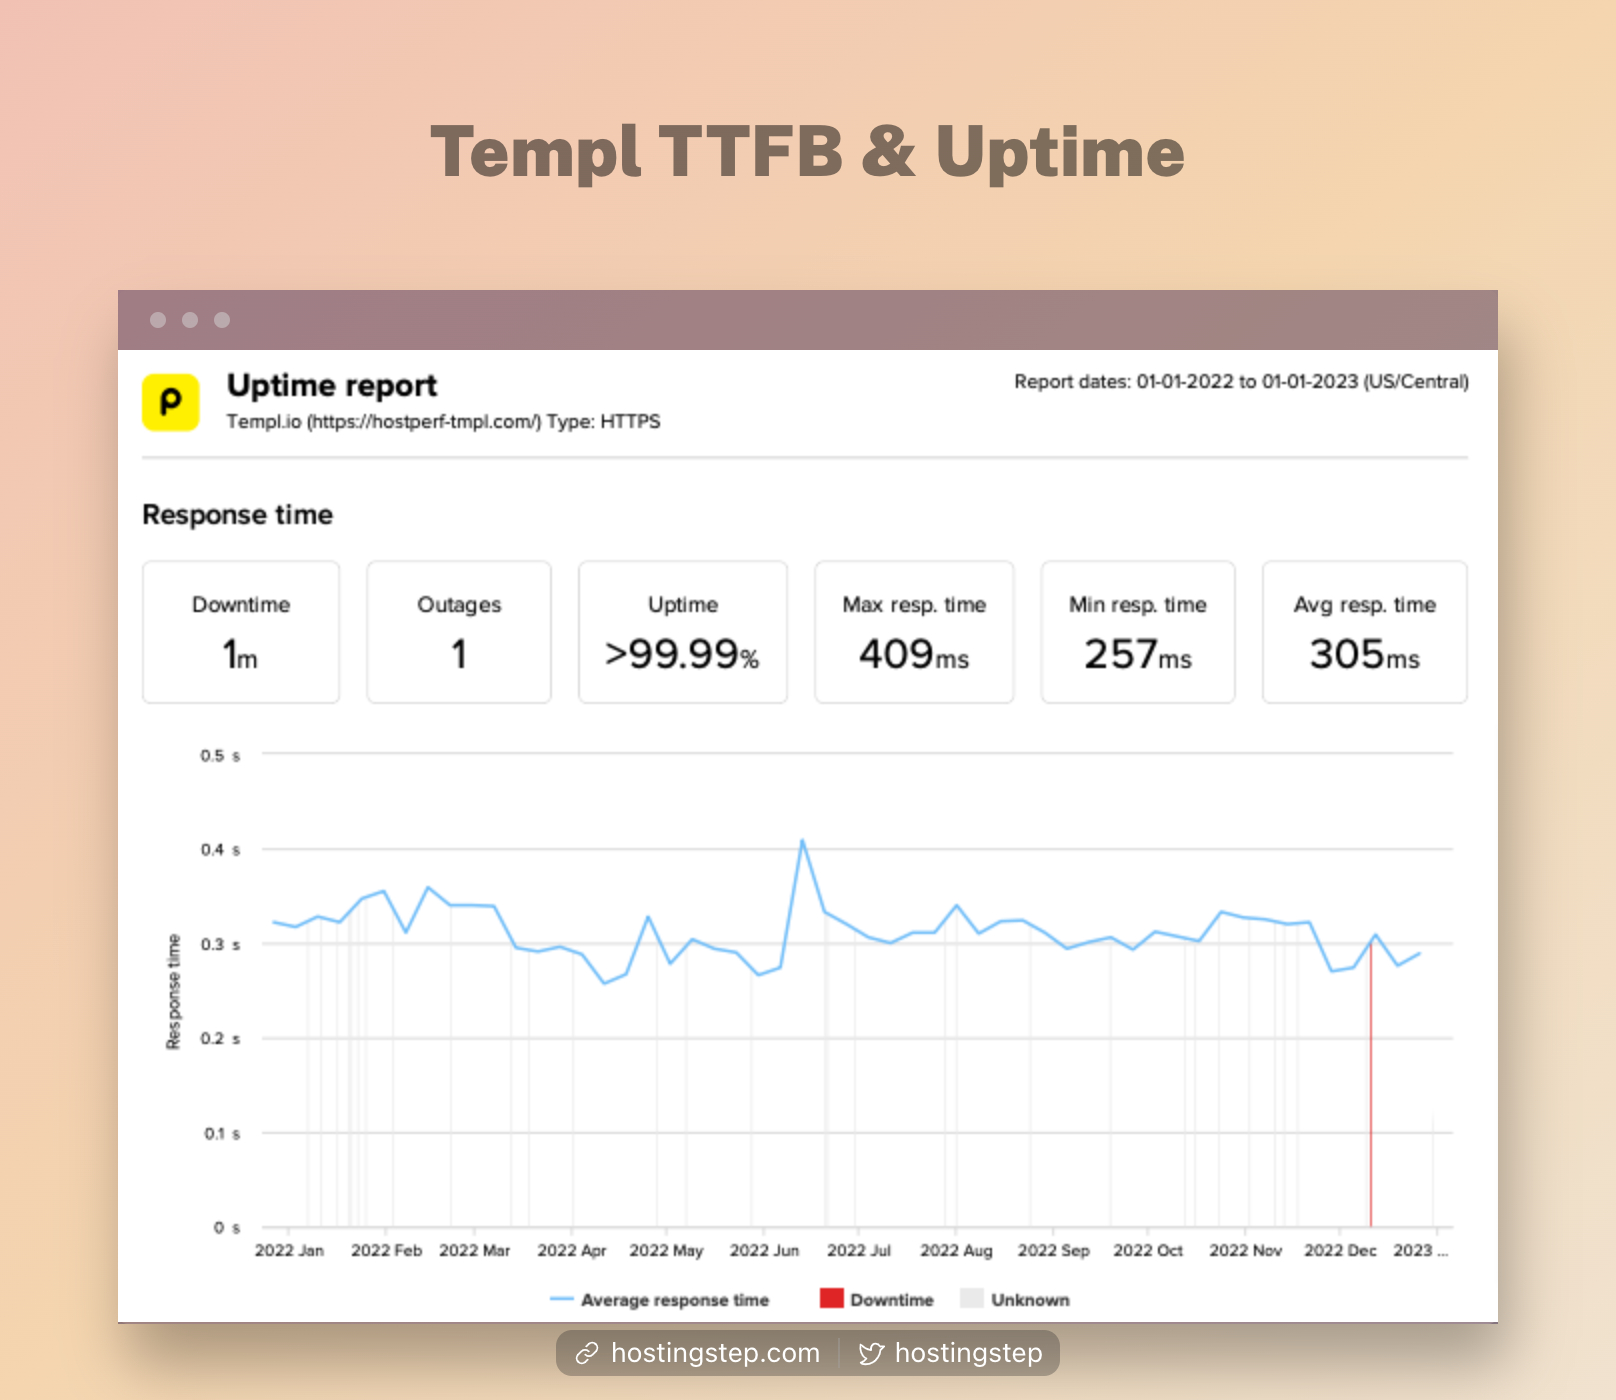
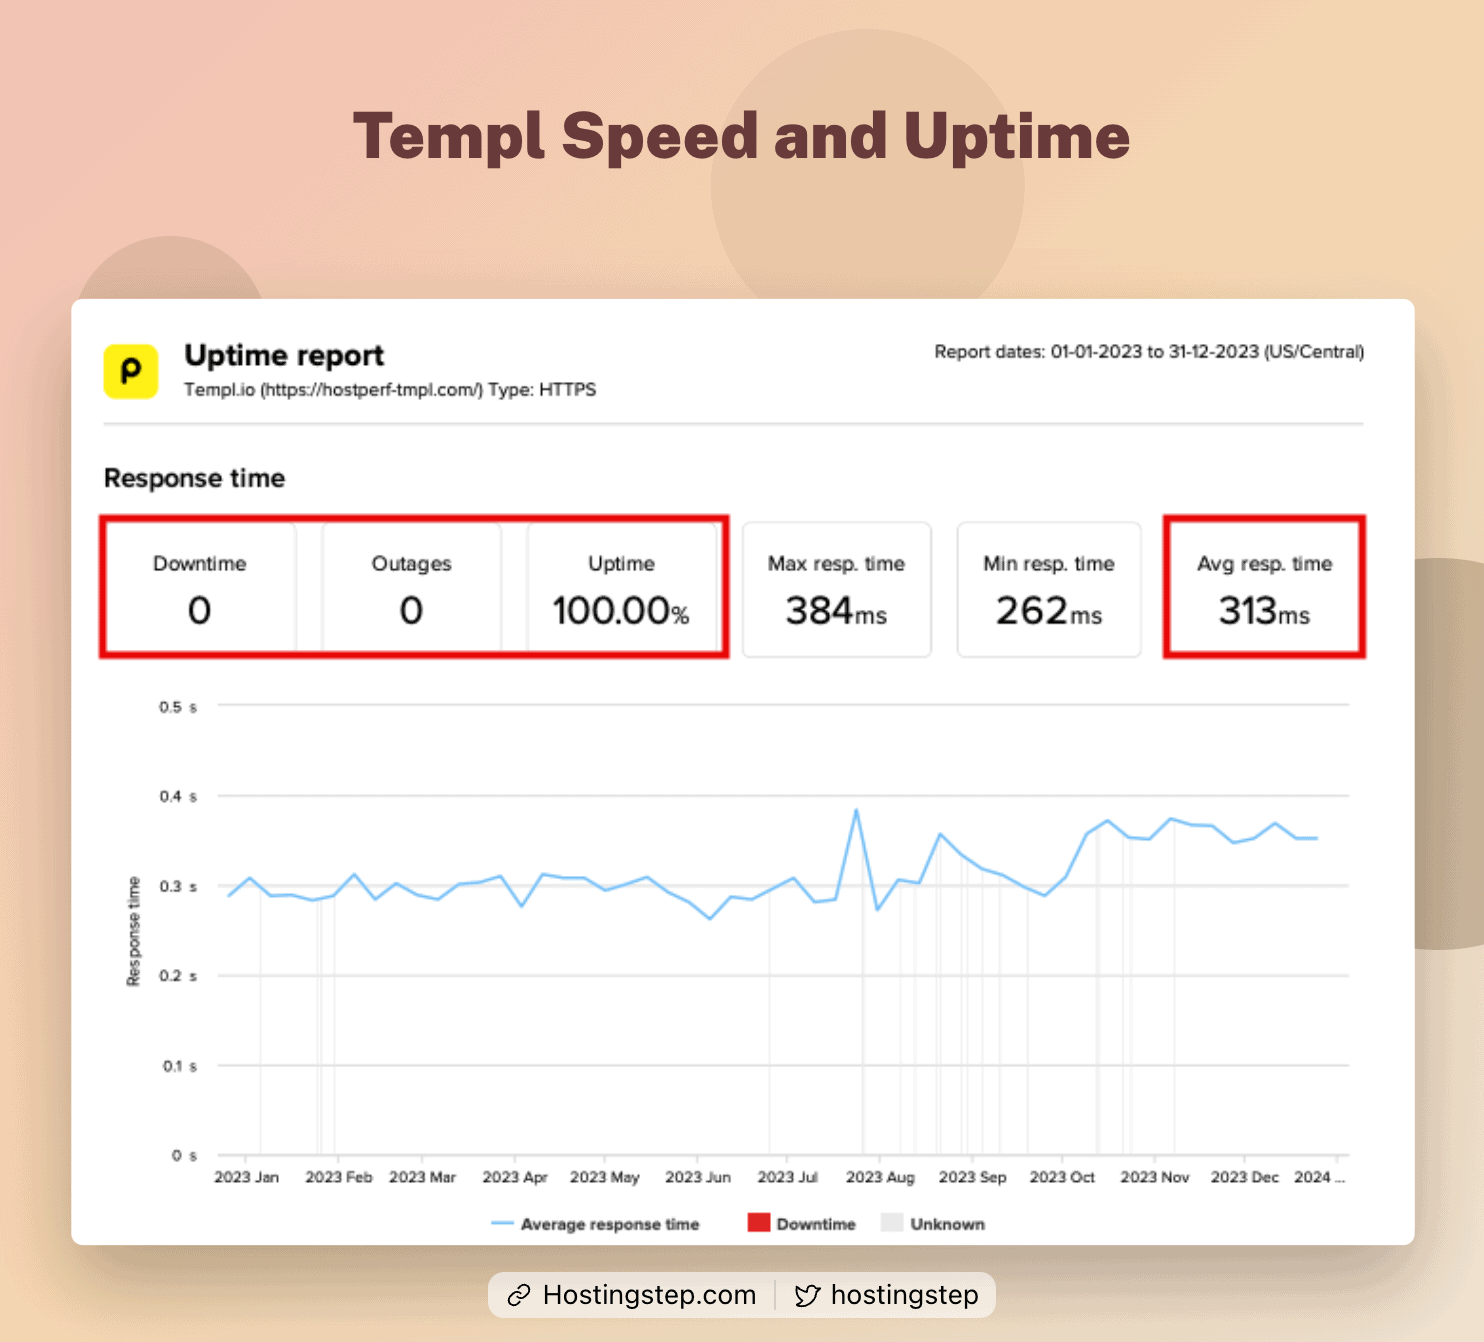
| Templ | 313 ms |
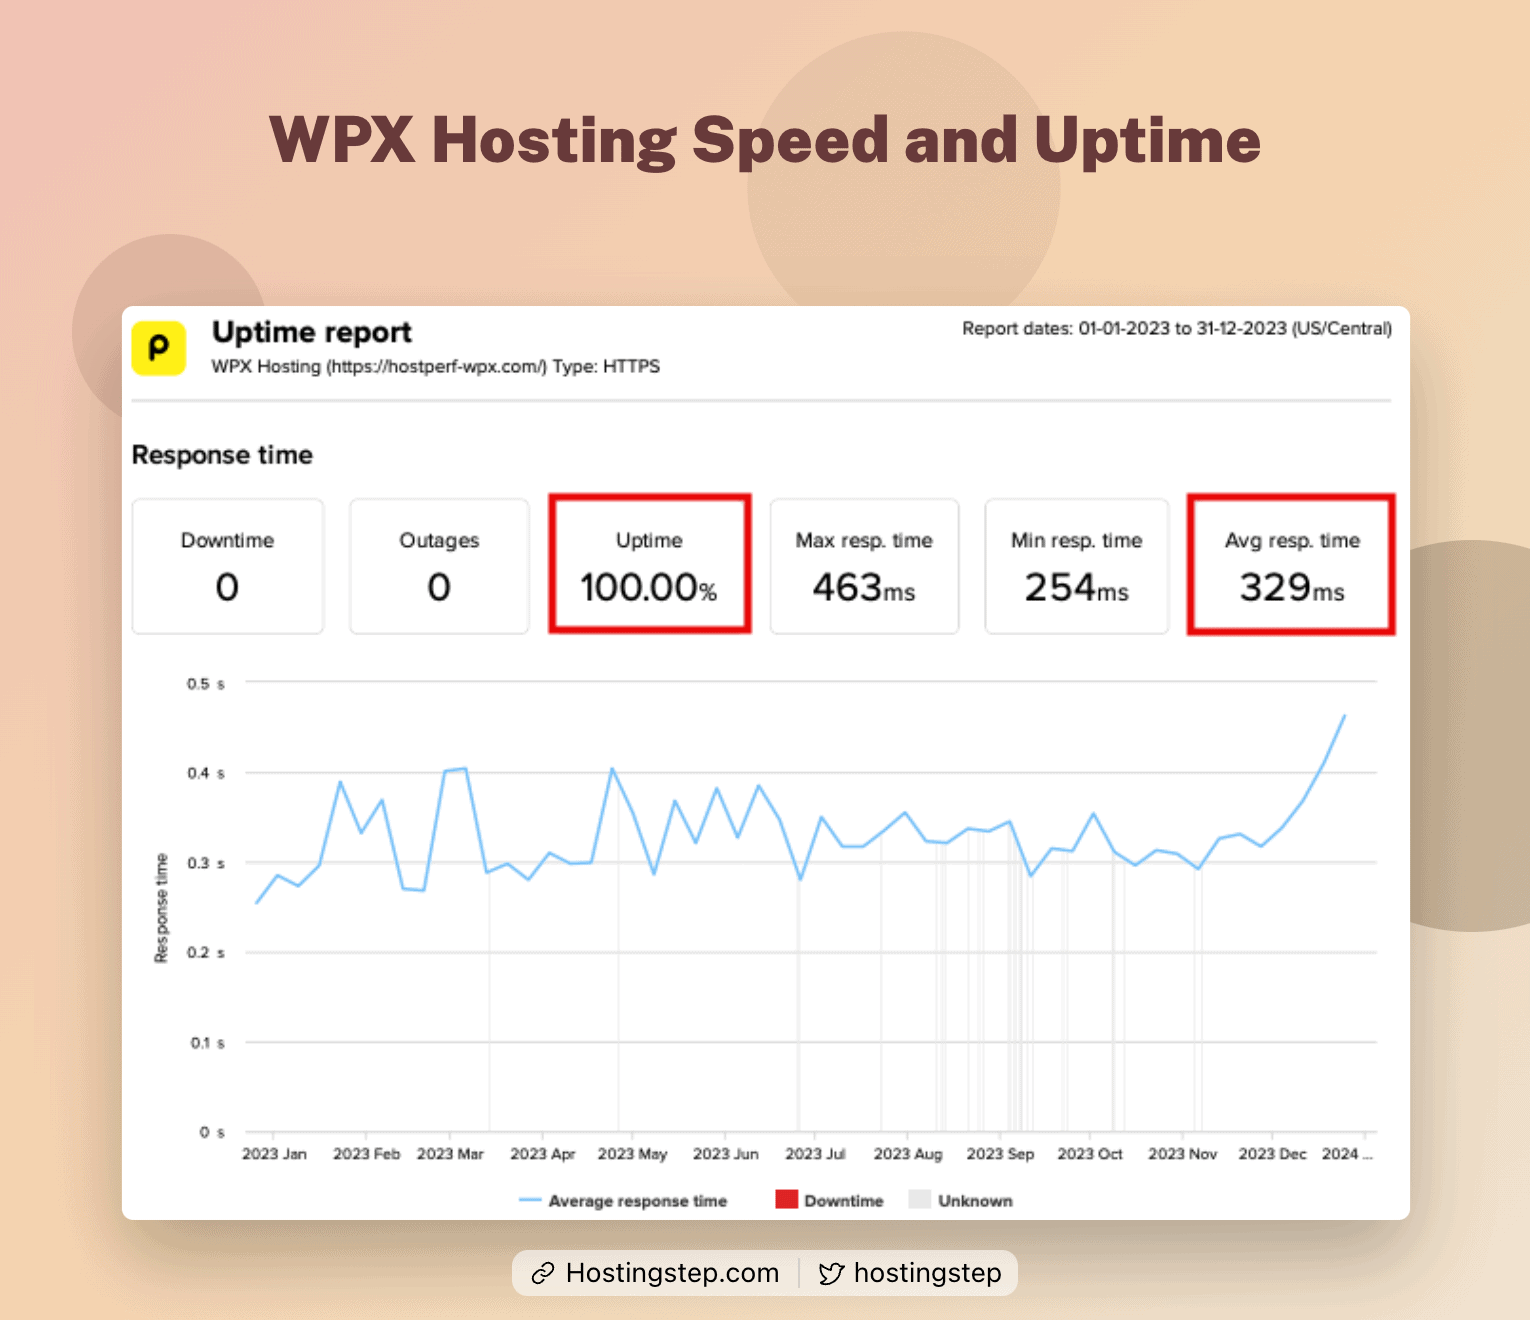
| WPX Hosting | 329 ms |
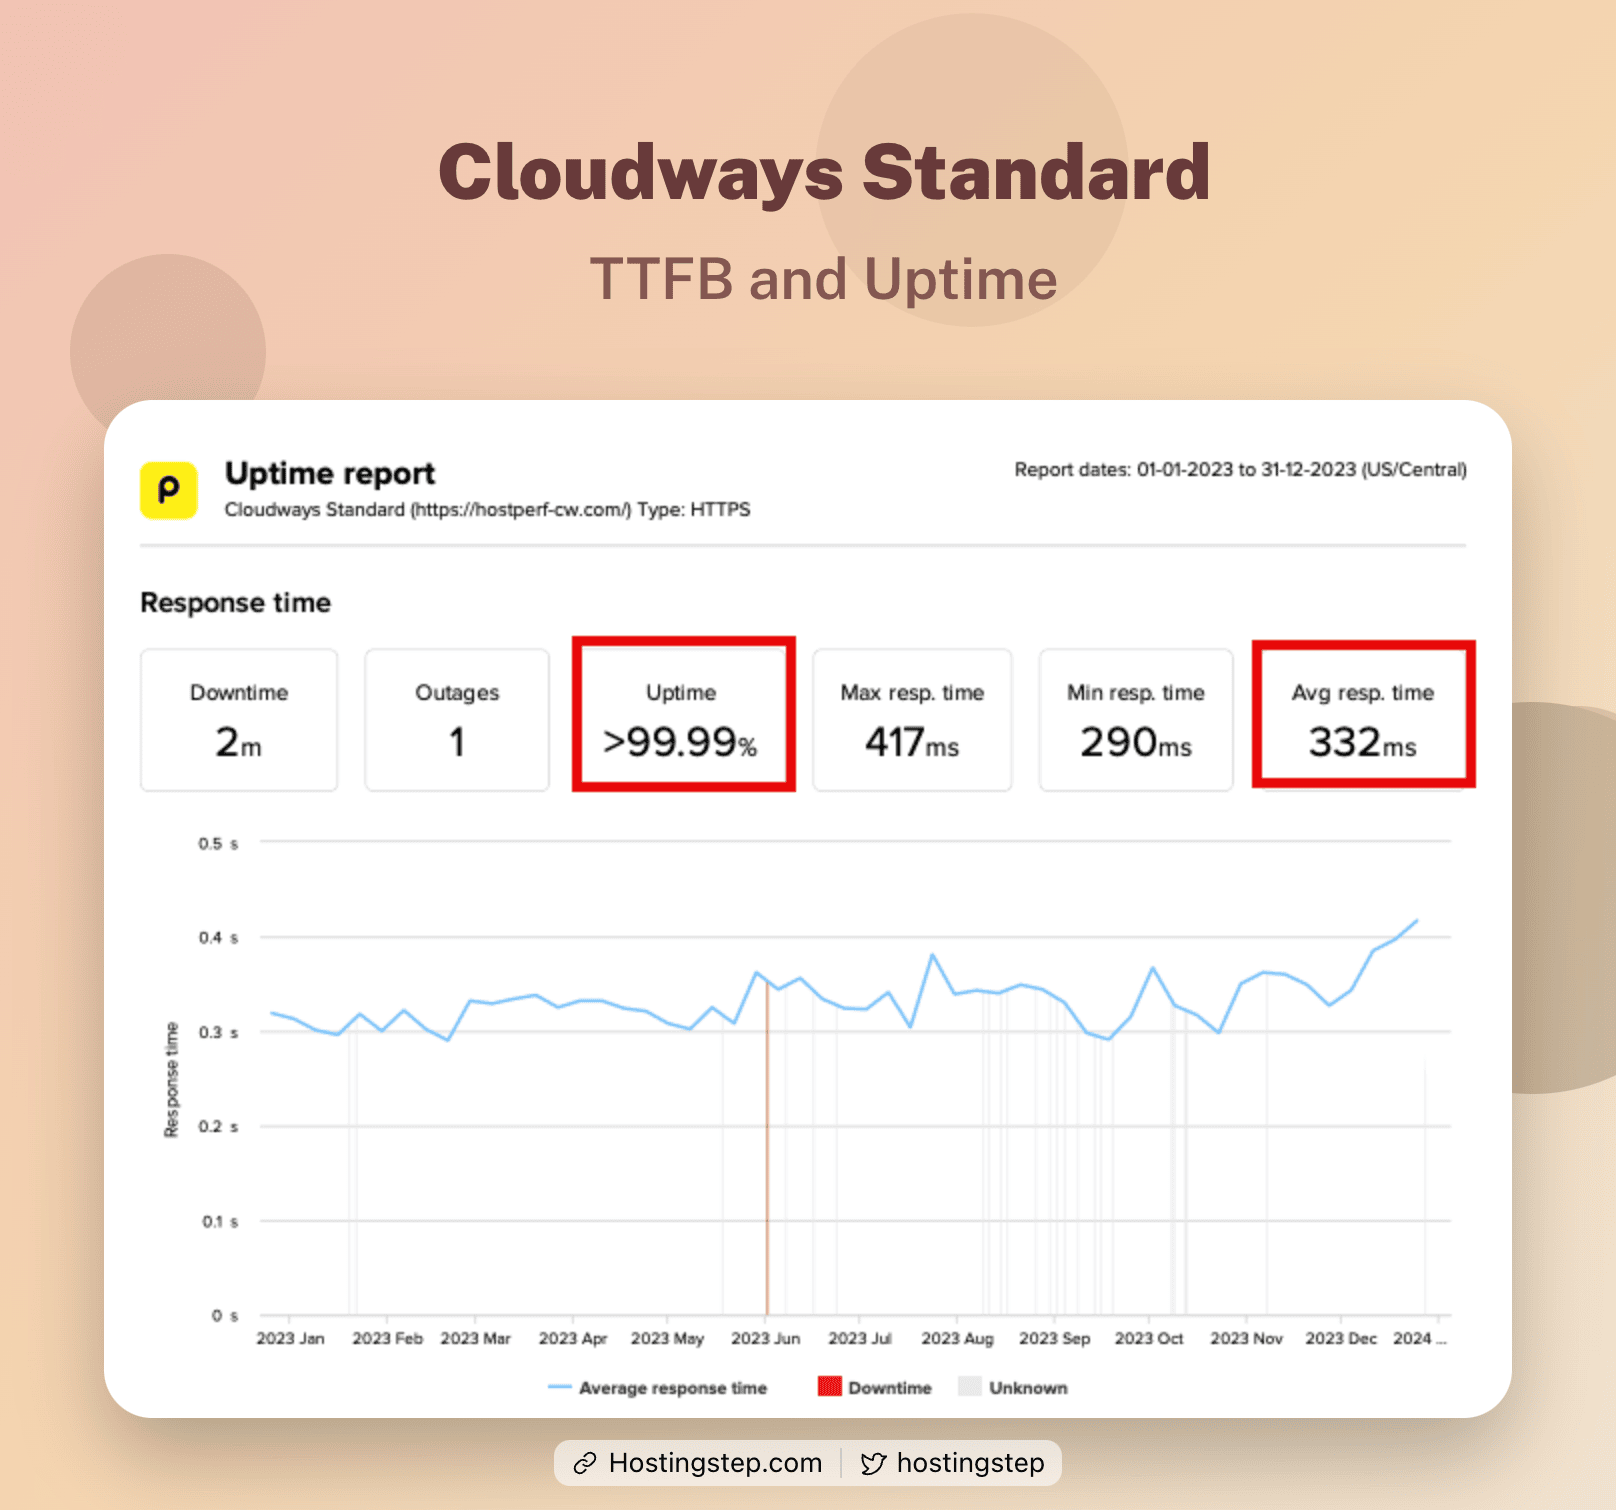
| Cloudways | 332 ms |
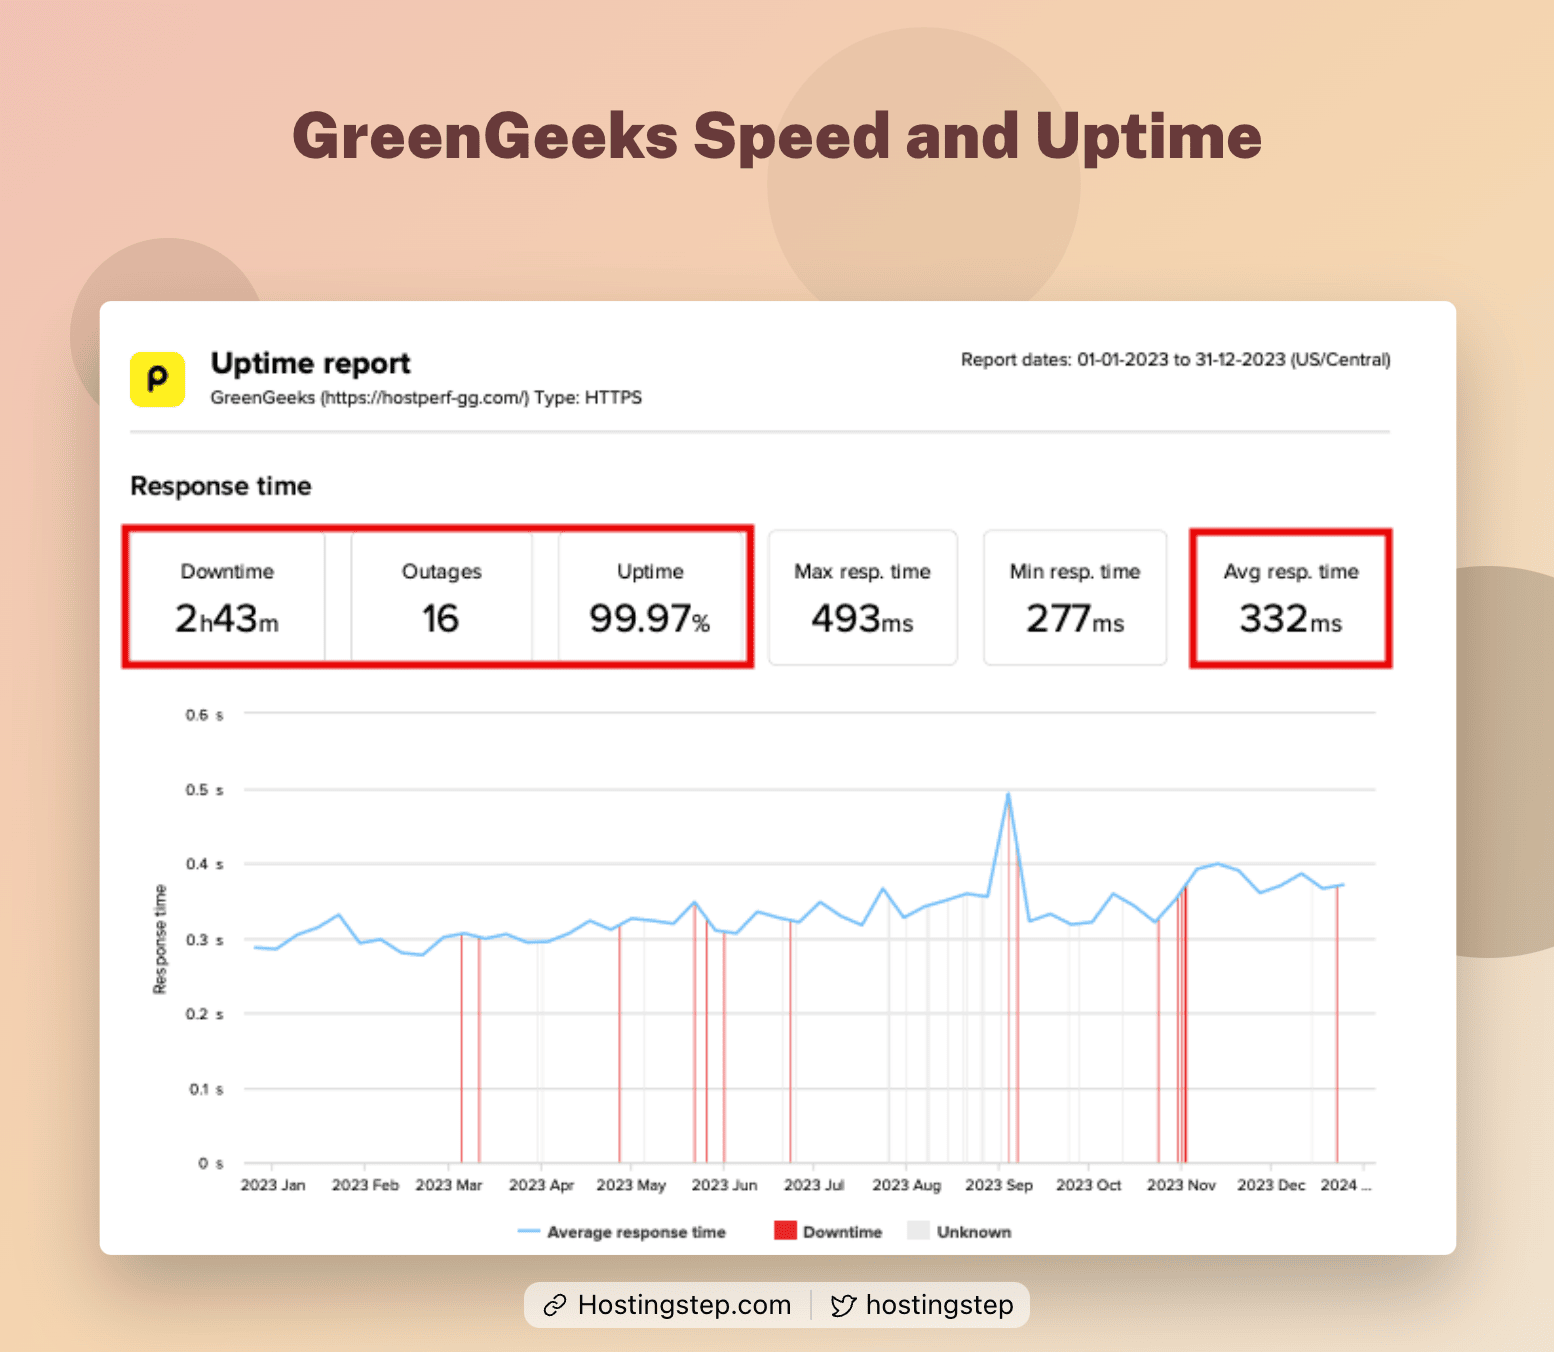
| GreenGeeks | 332 ms |
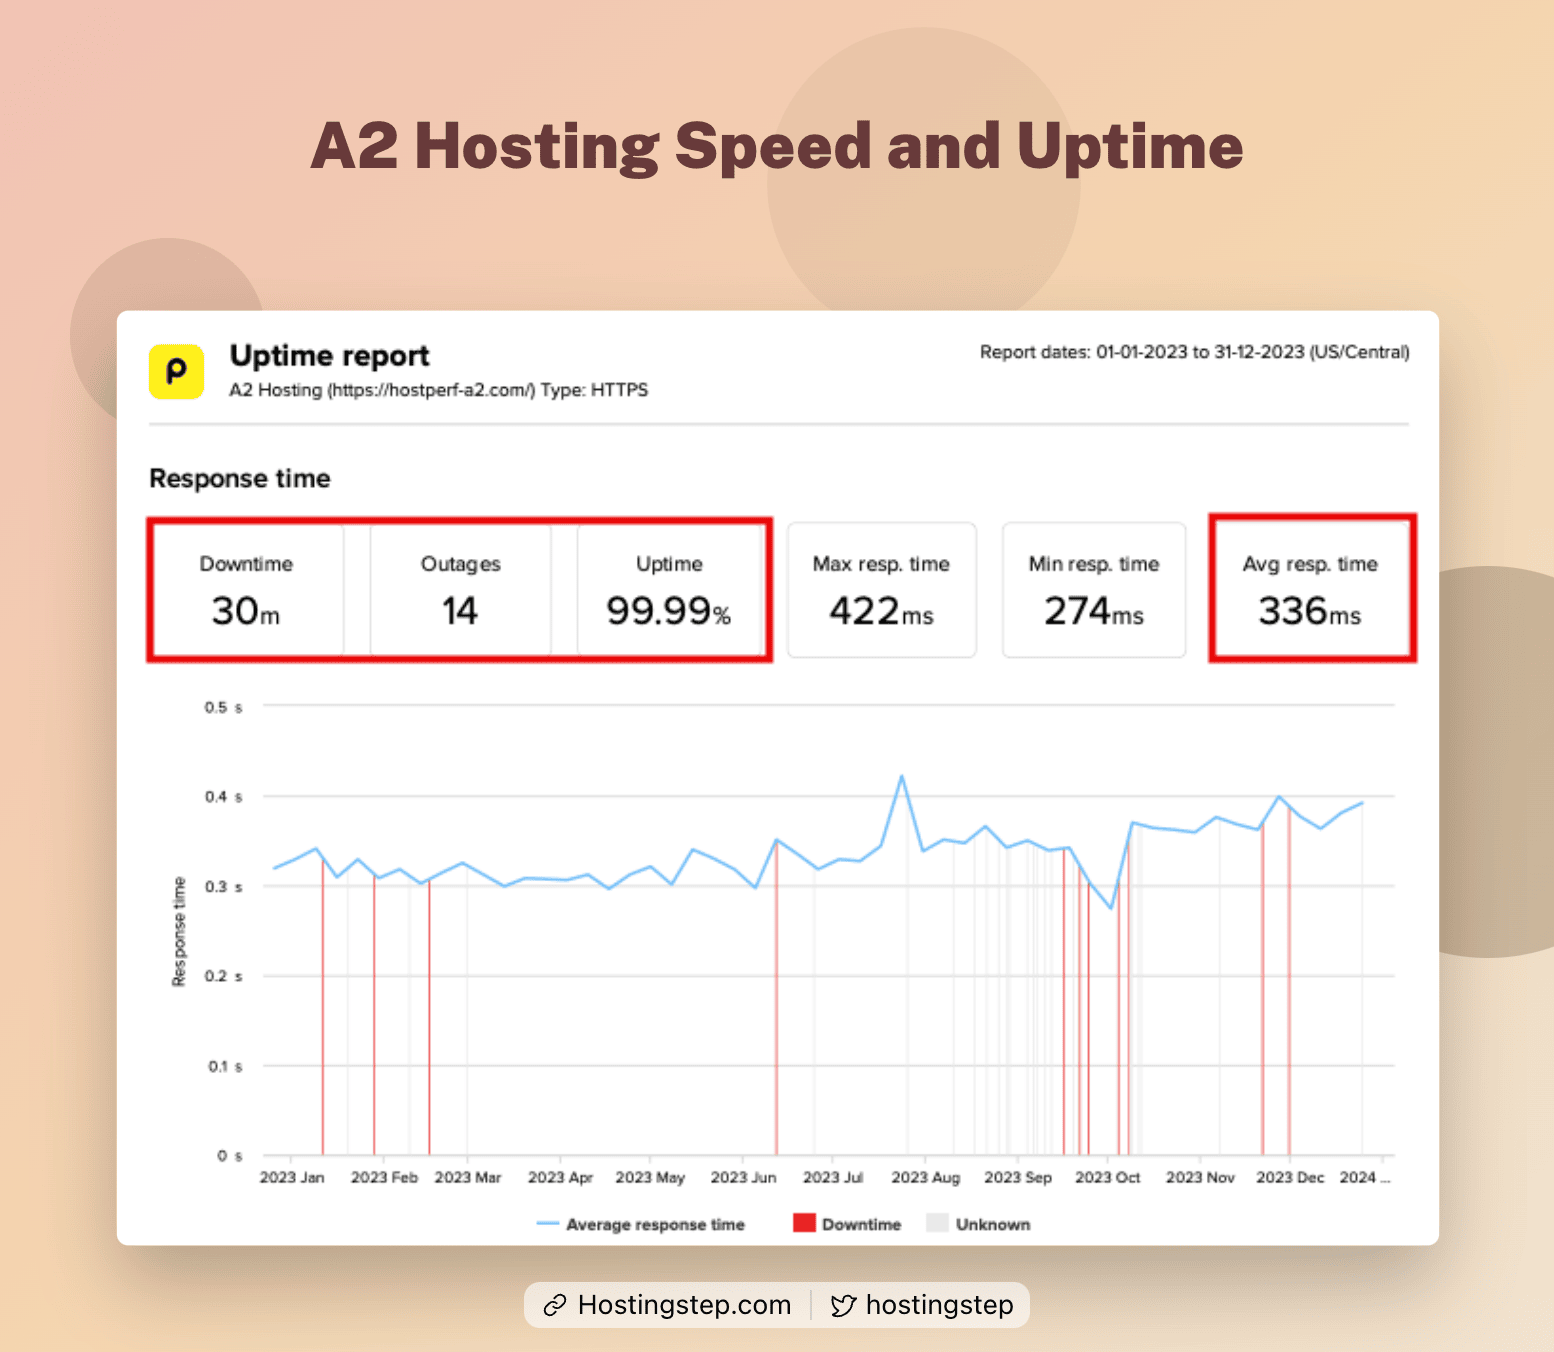
| A2 Hosting | 336 ms |
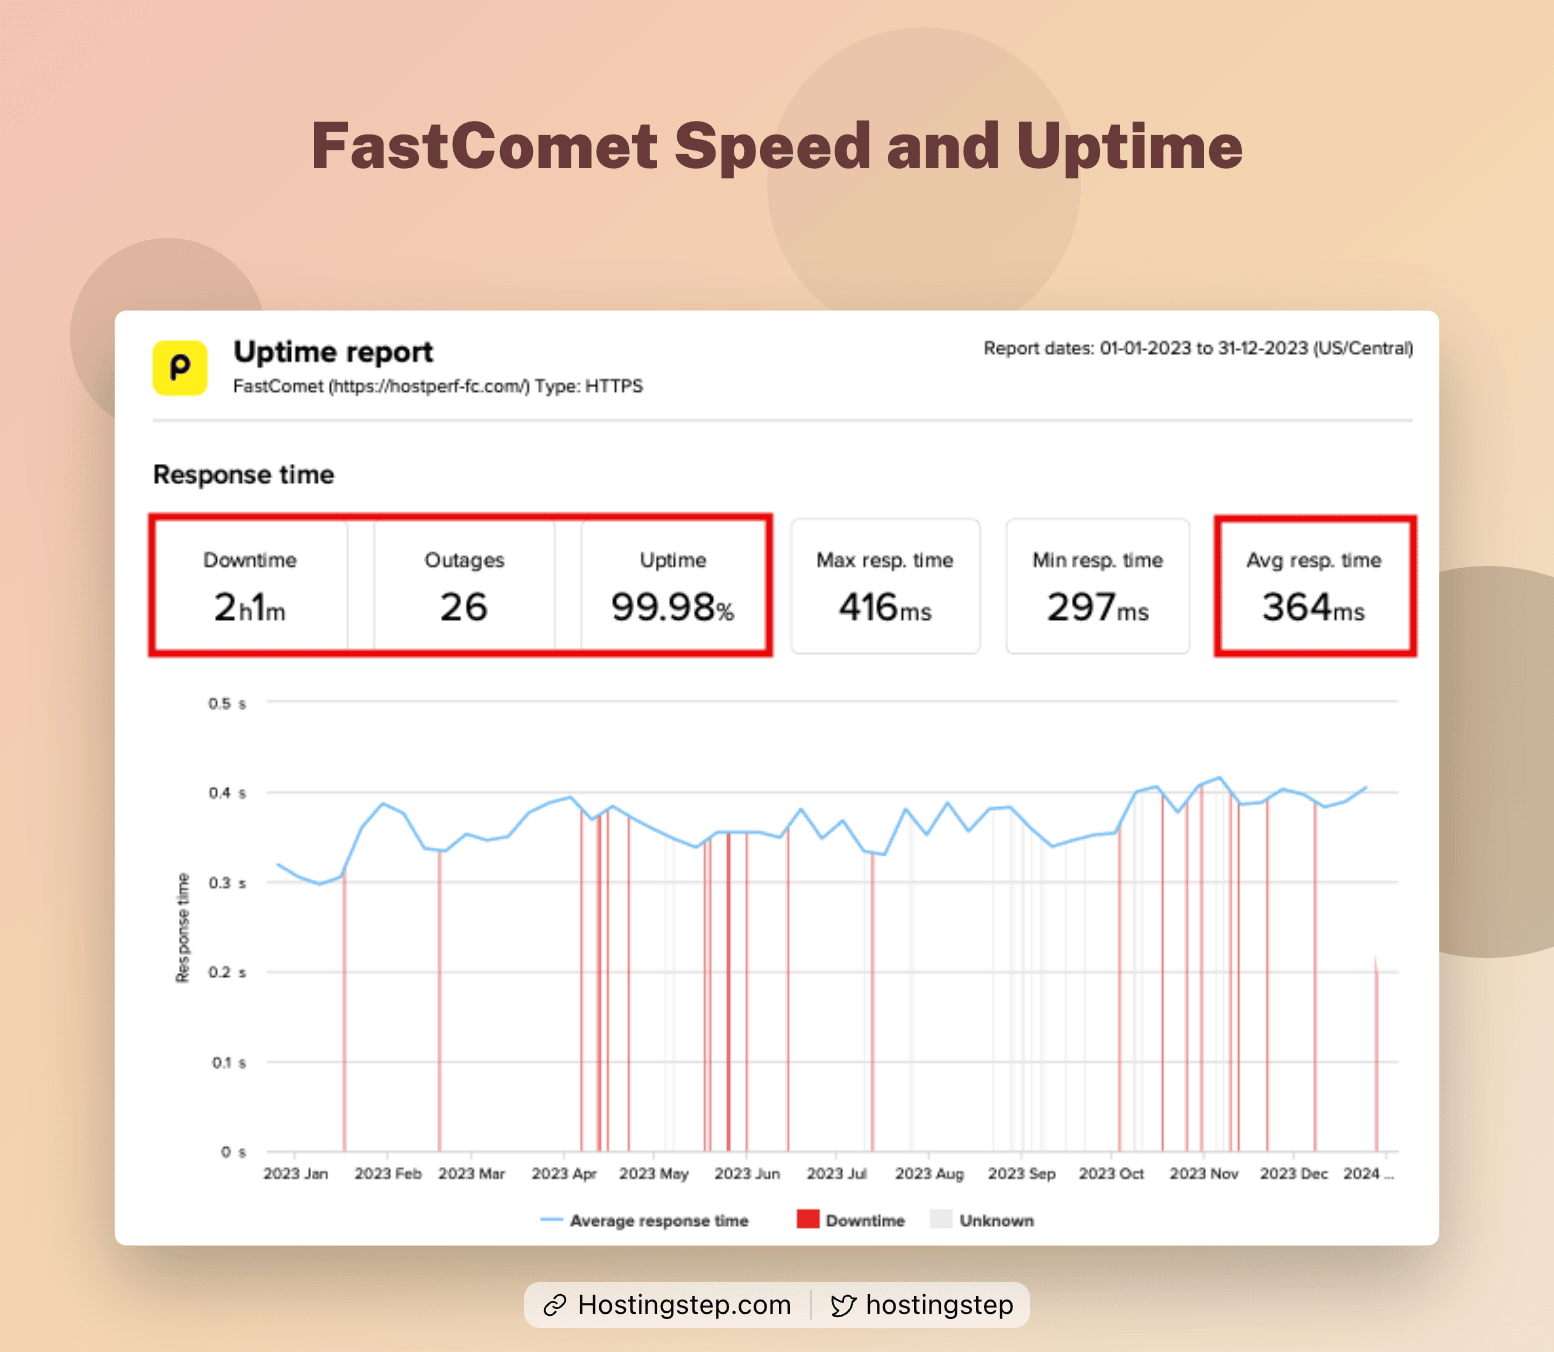
| FastComet | 364 ms |
| DreamPress | 374 ms |
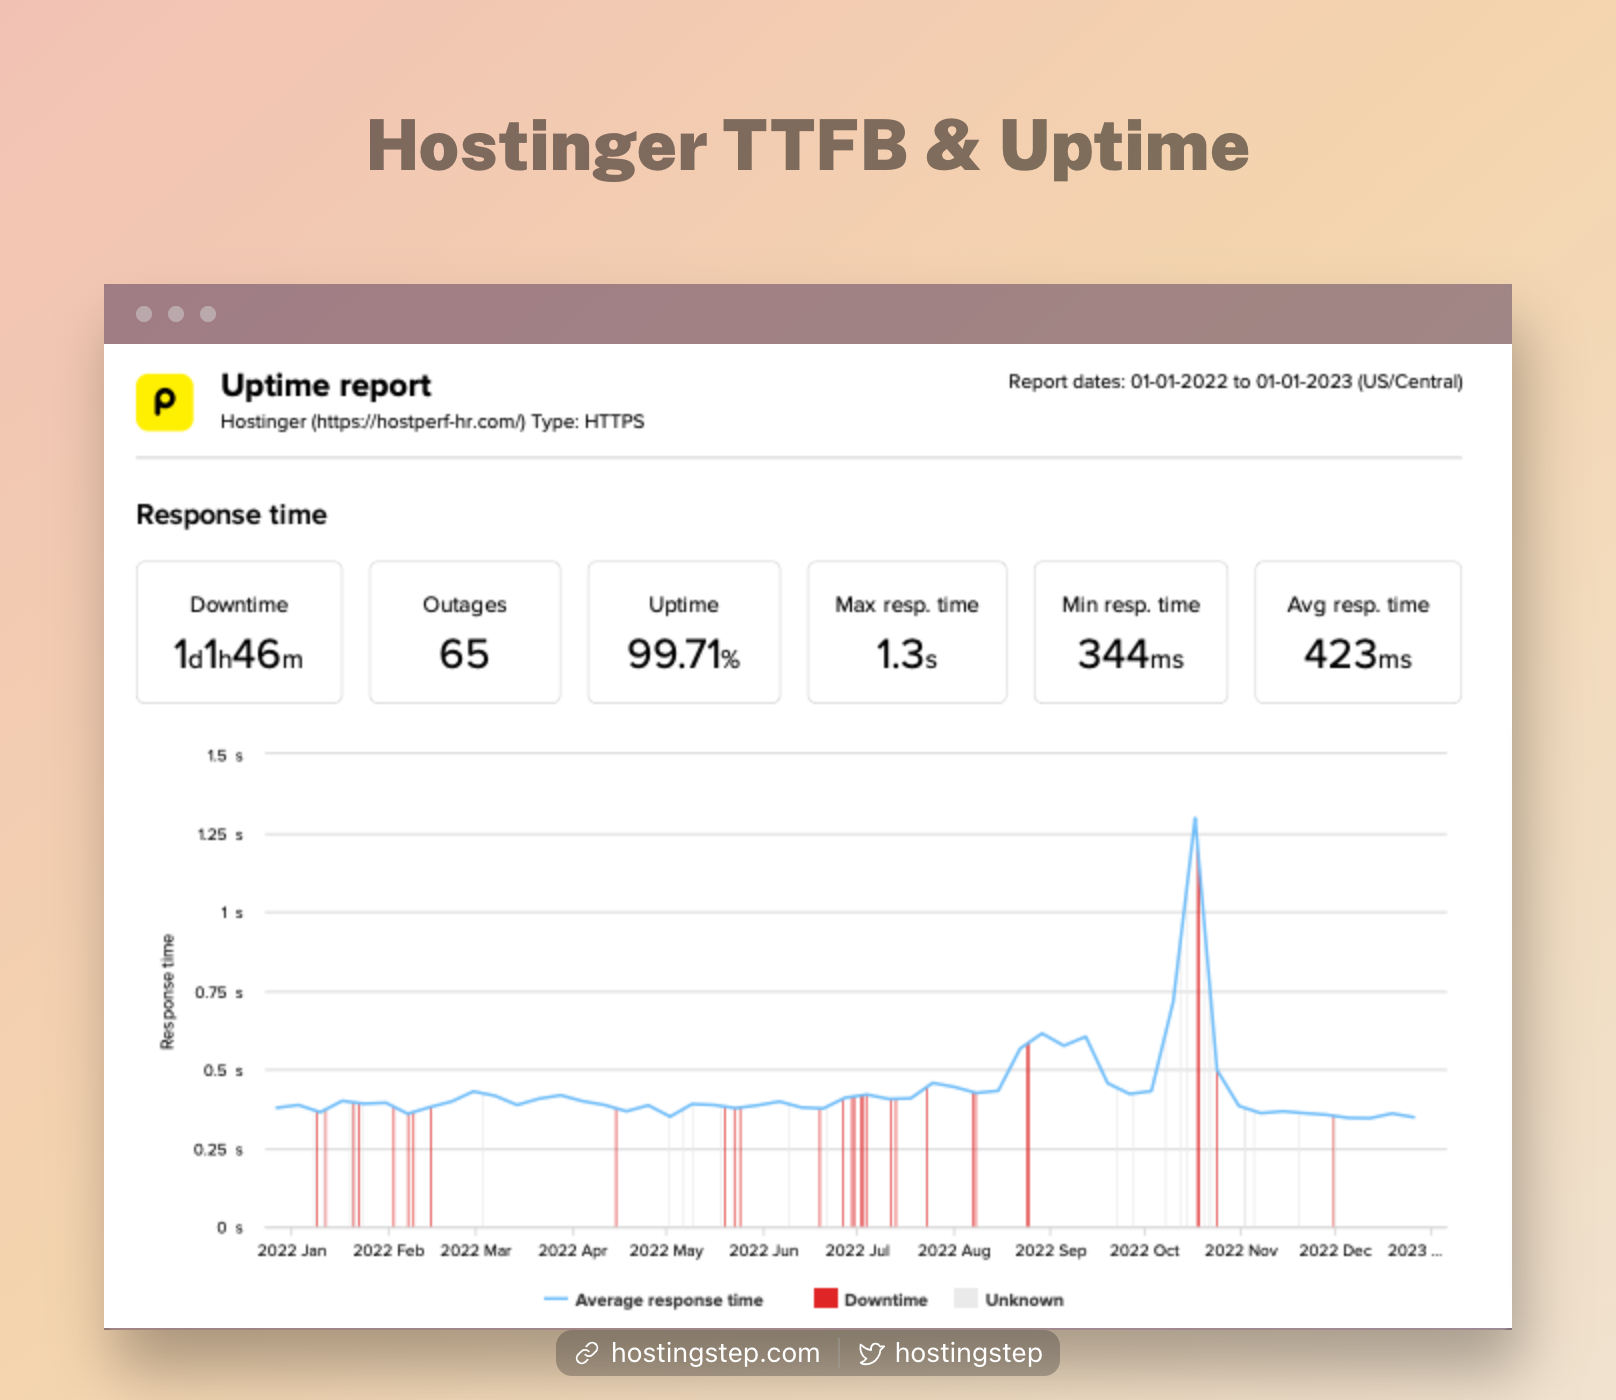
| Hostinger | 375 ms |
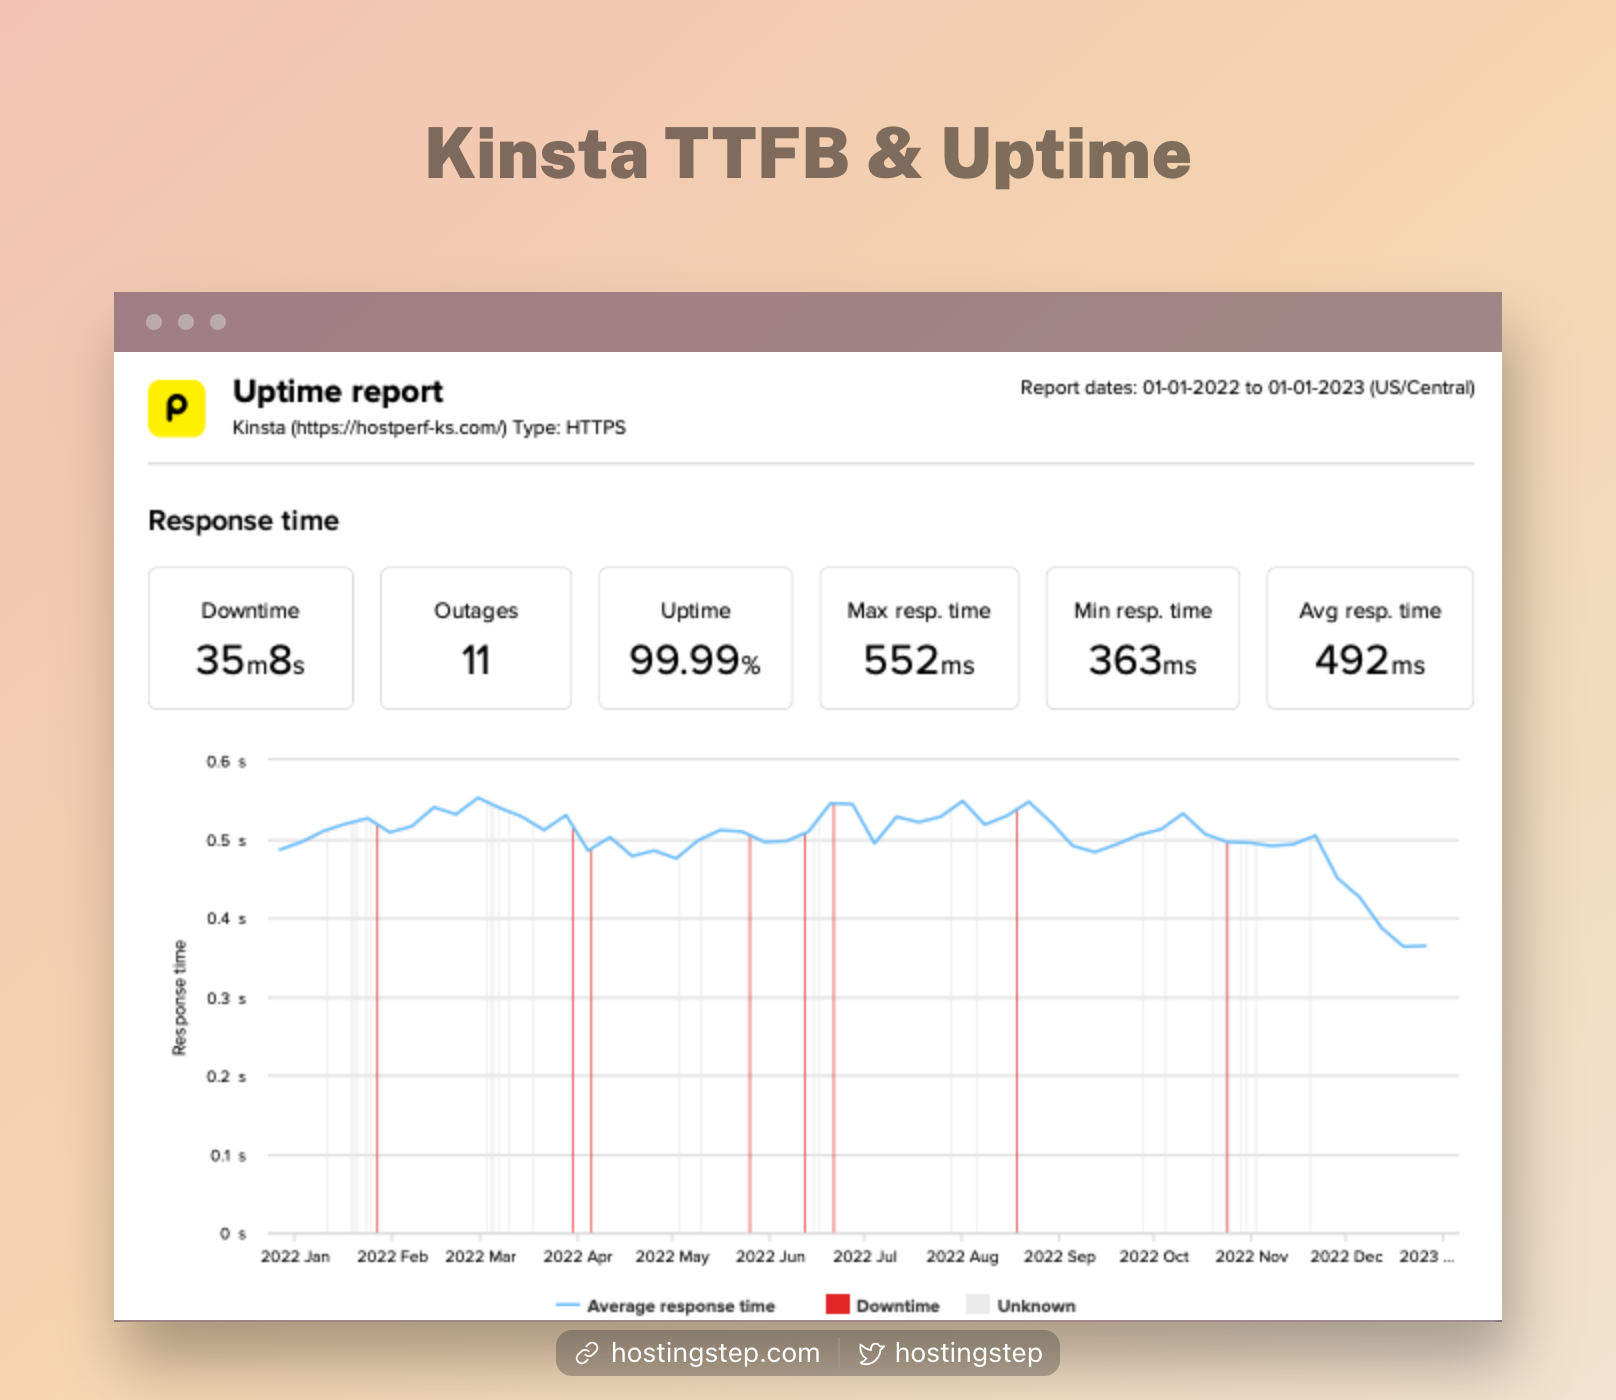
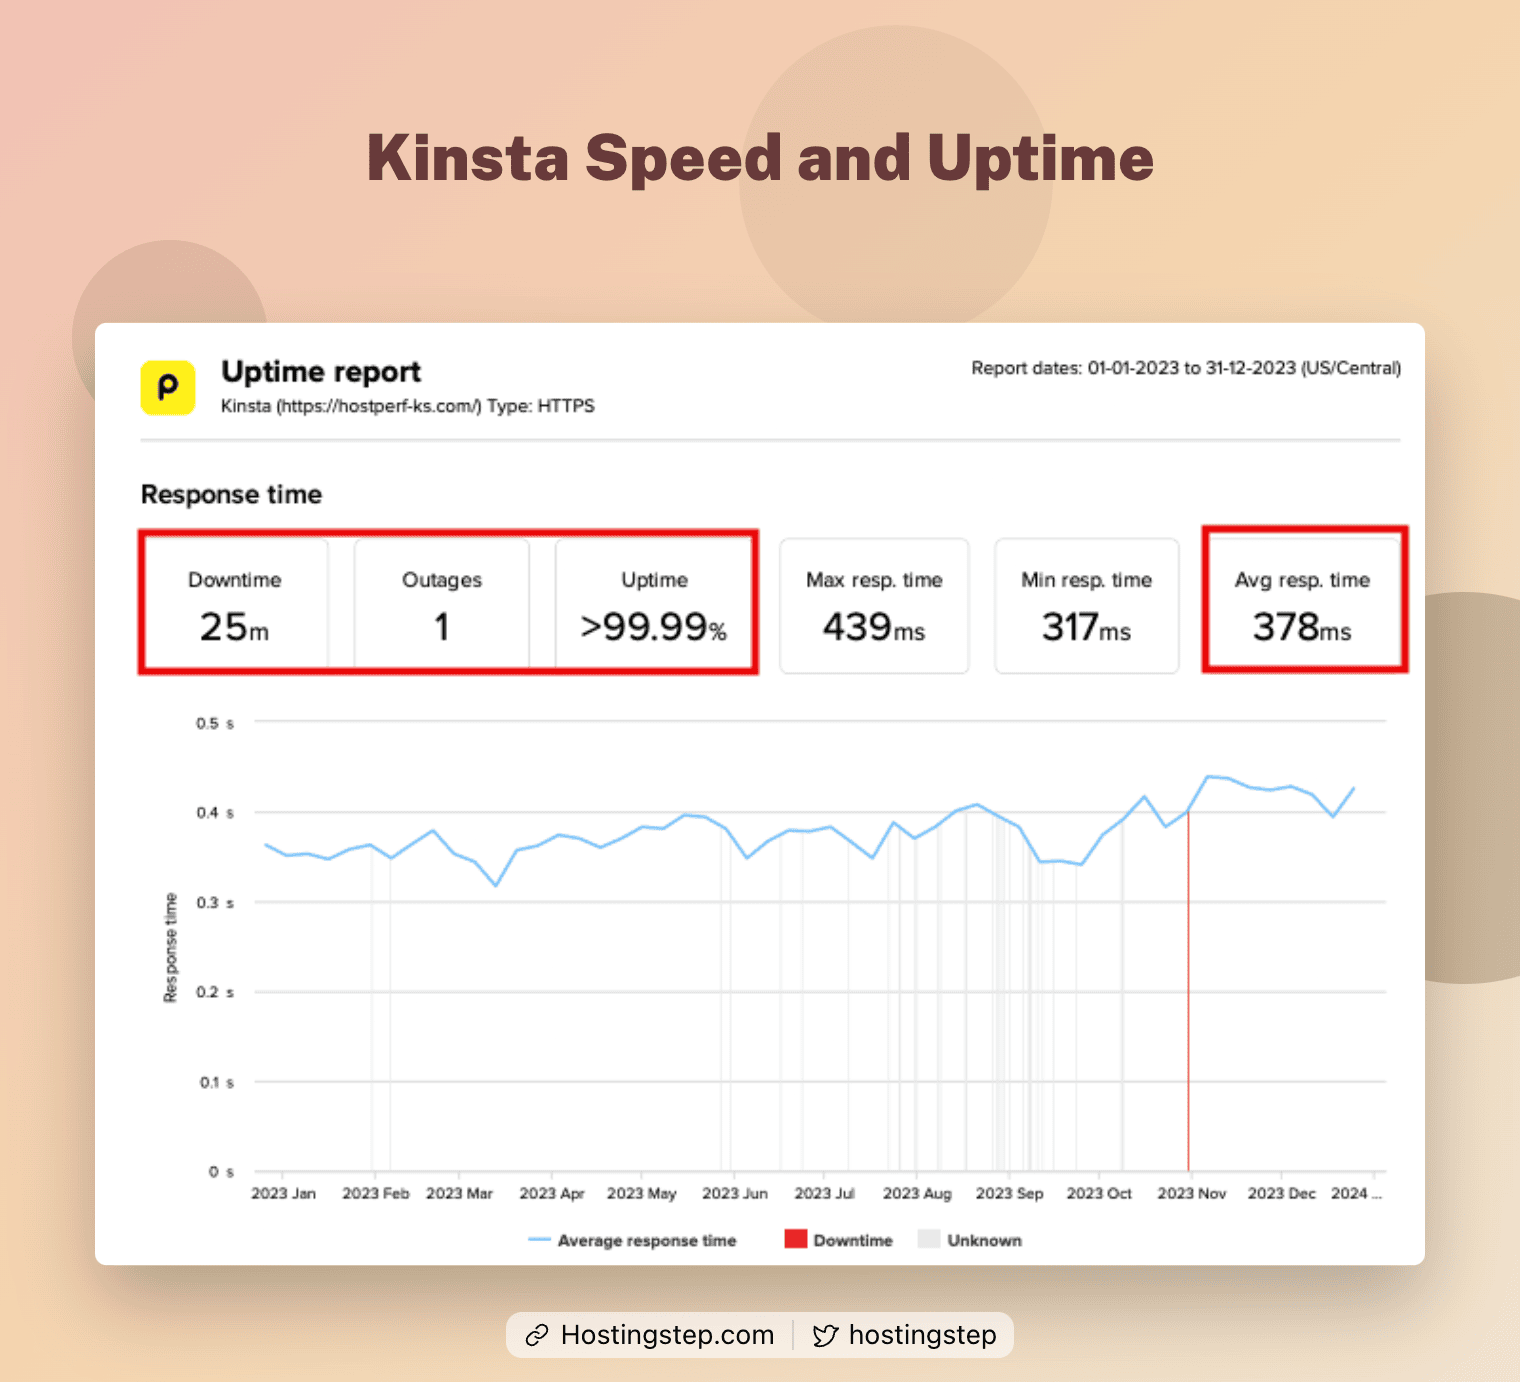
| Kinsta | 378 ms |
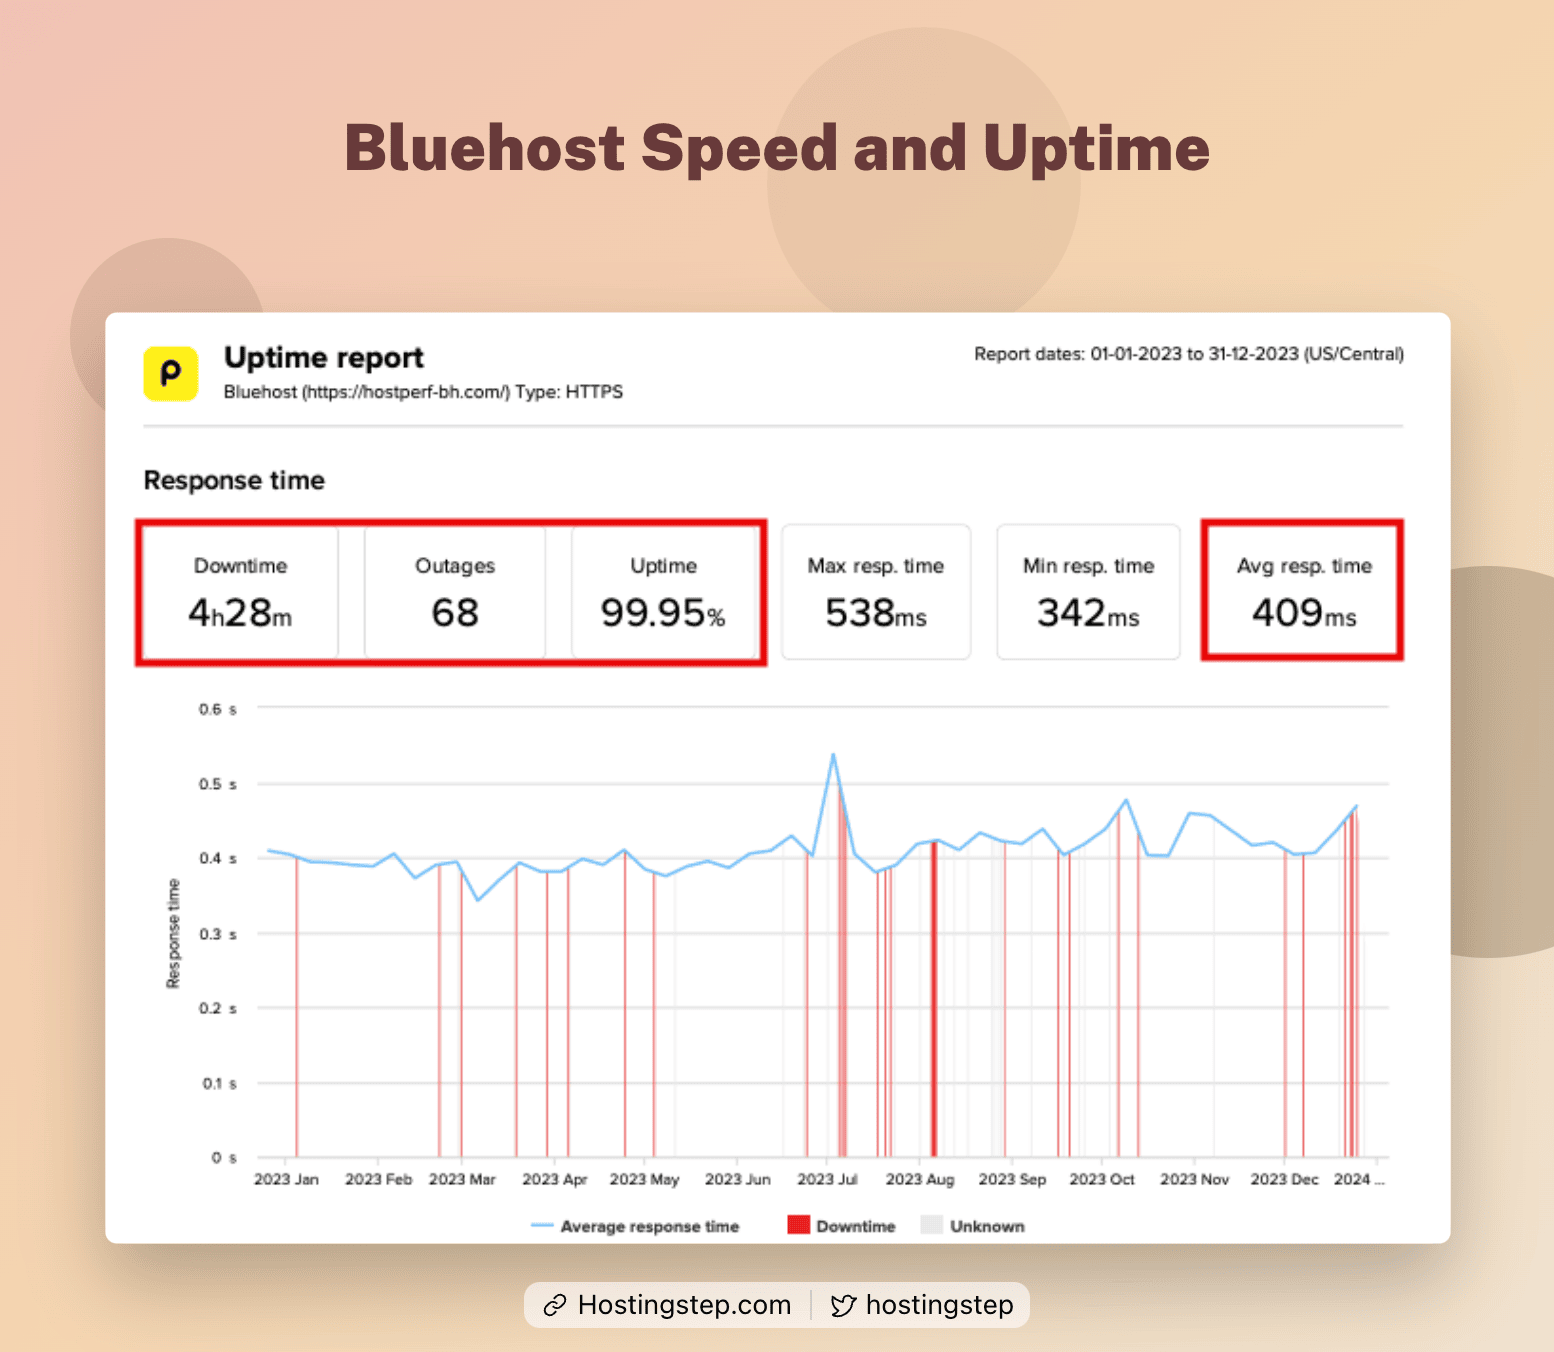
| Bluehost | 409 ms |
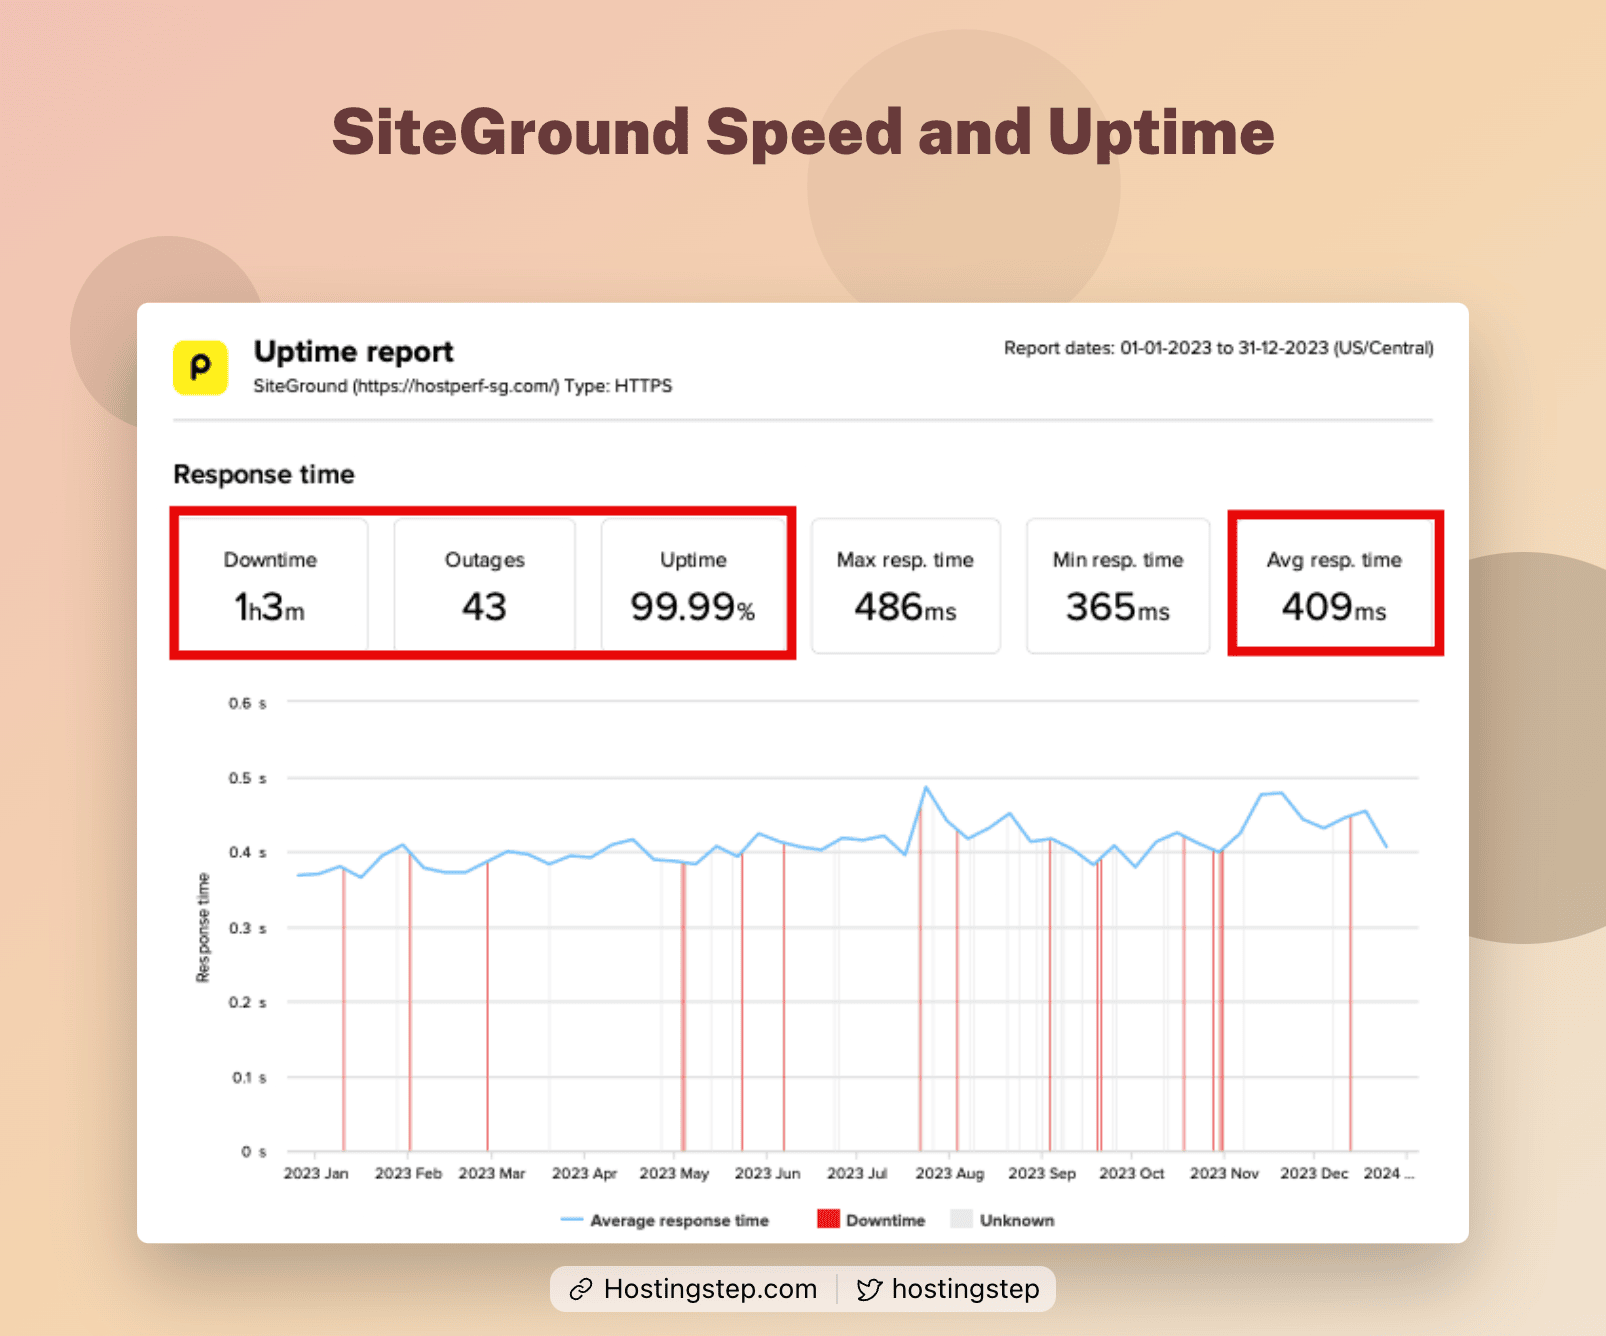
| SiteGround | 409 ms |
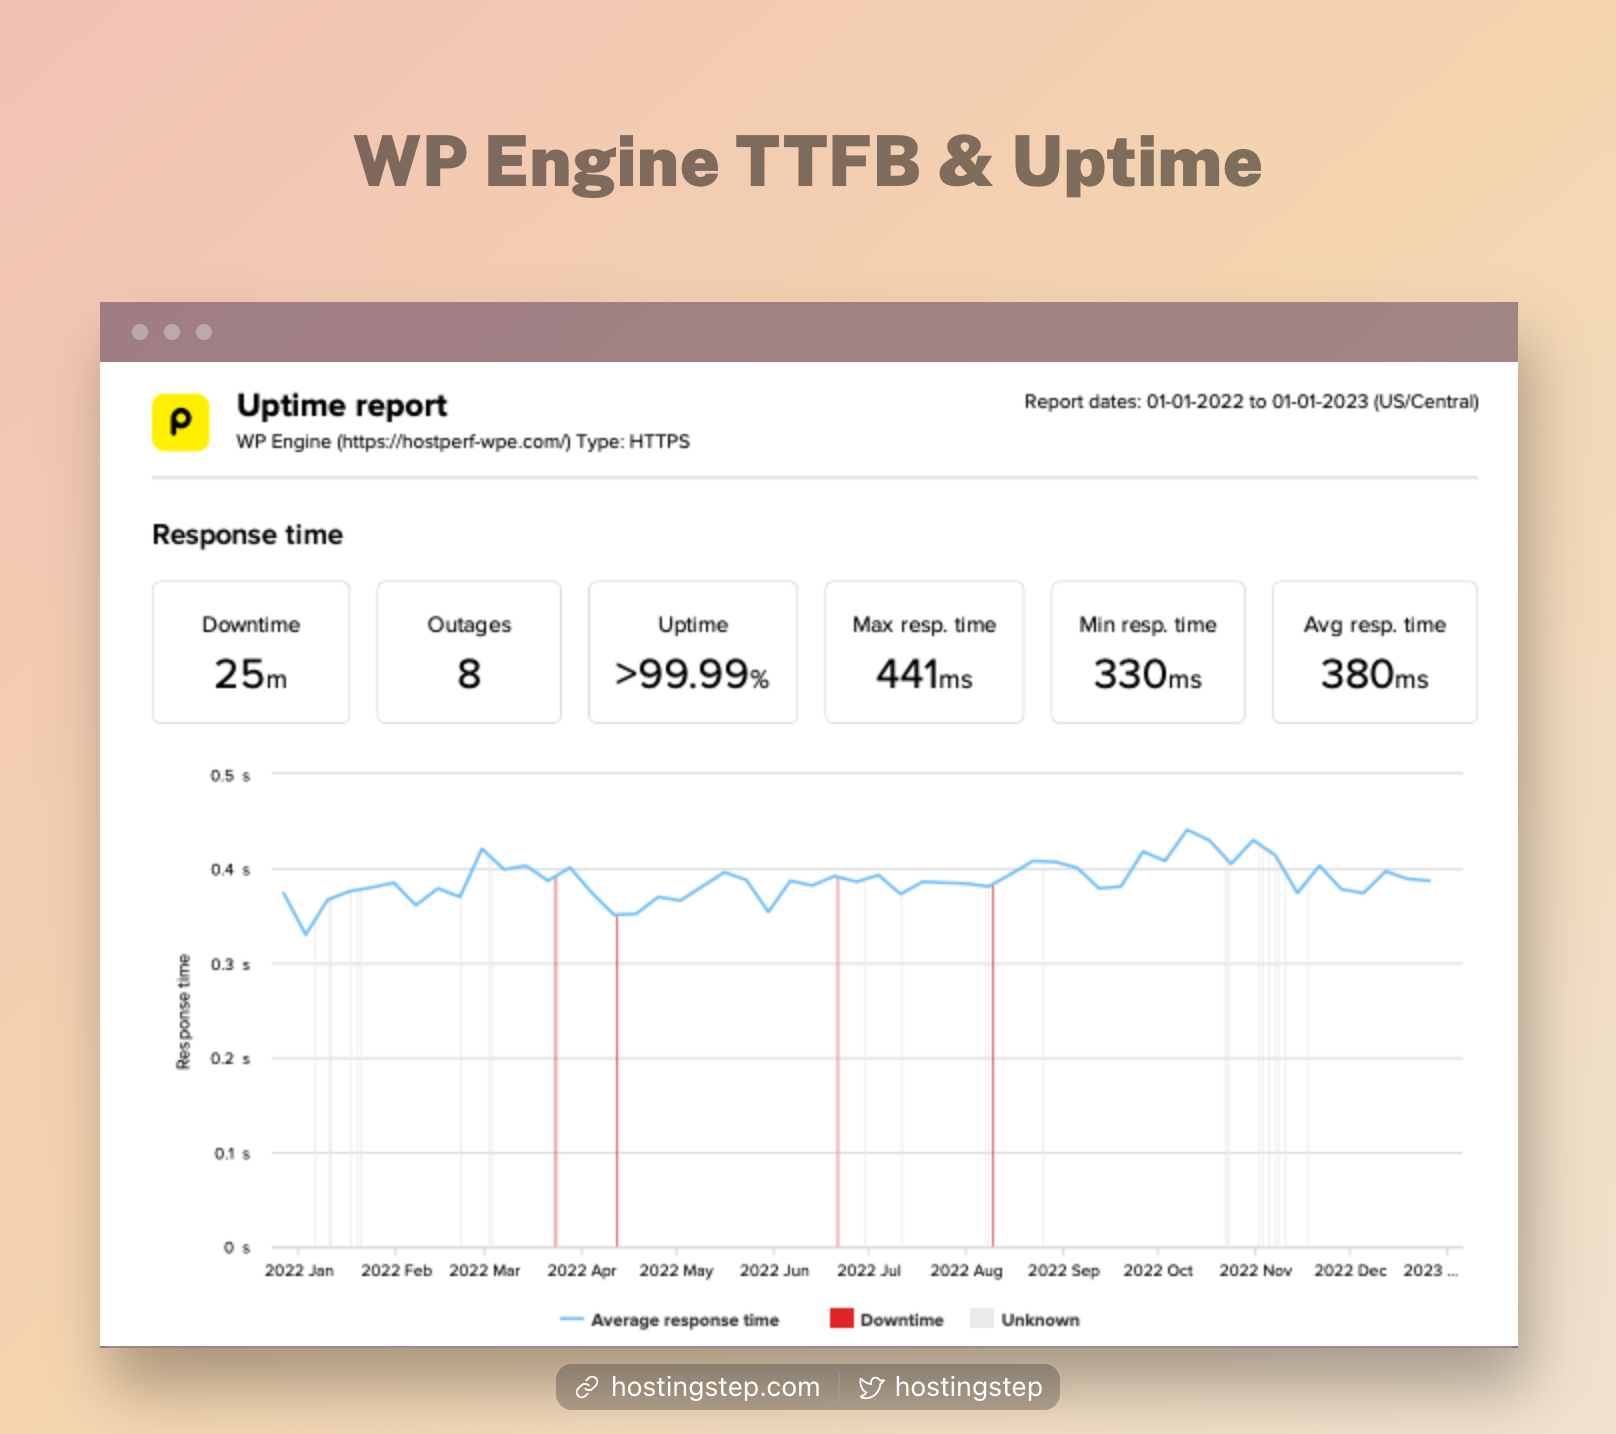
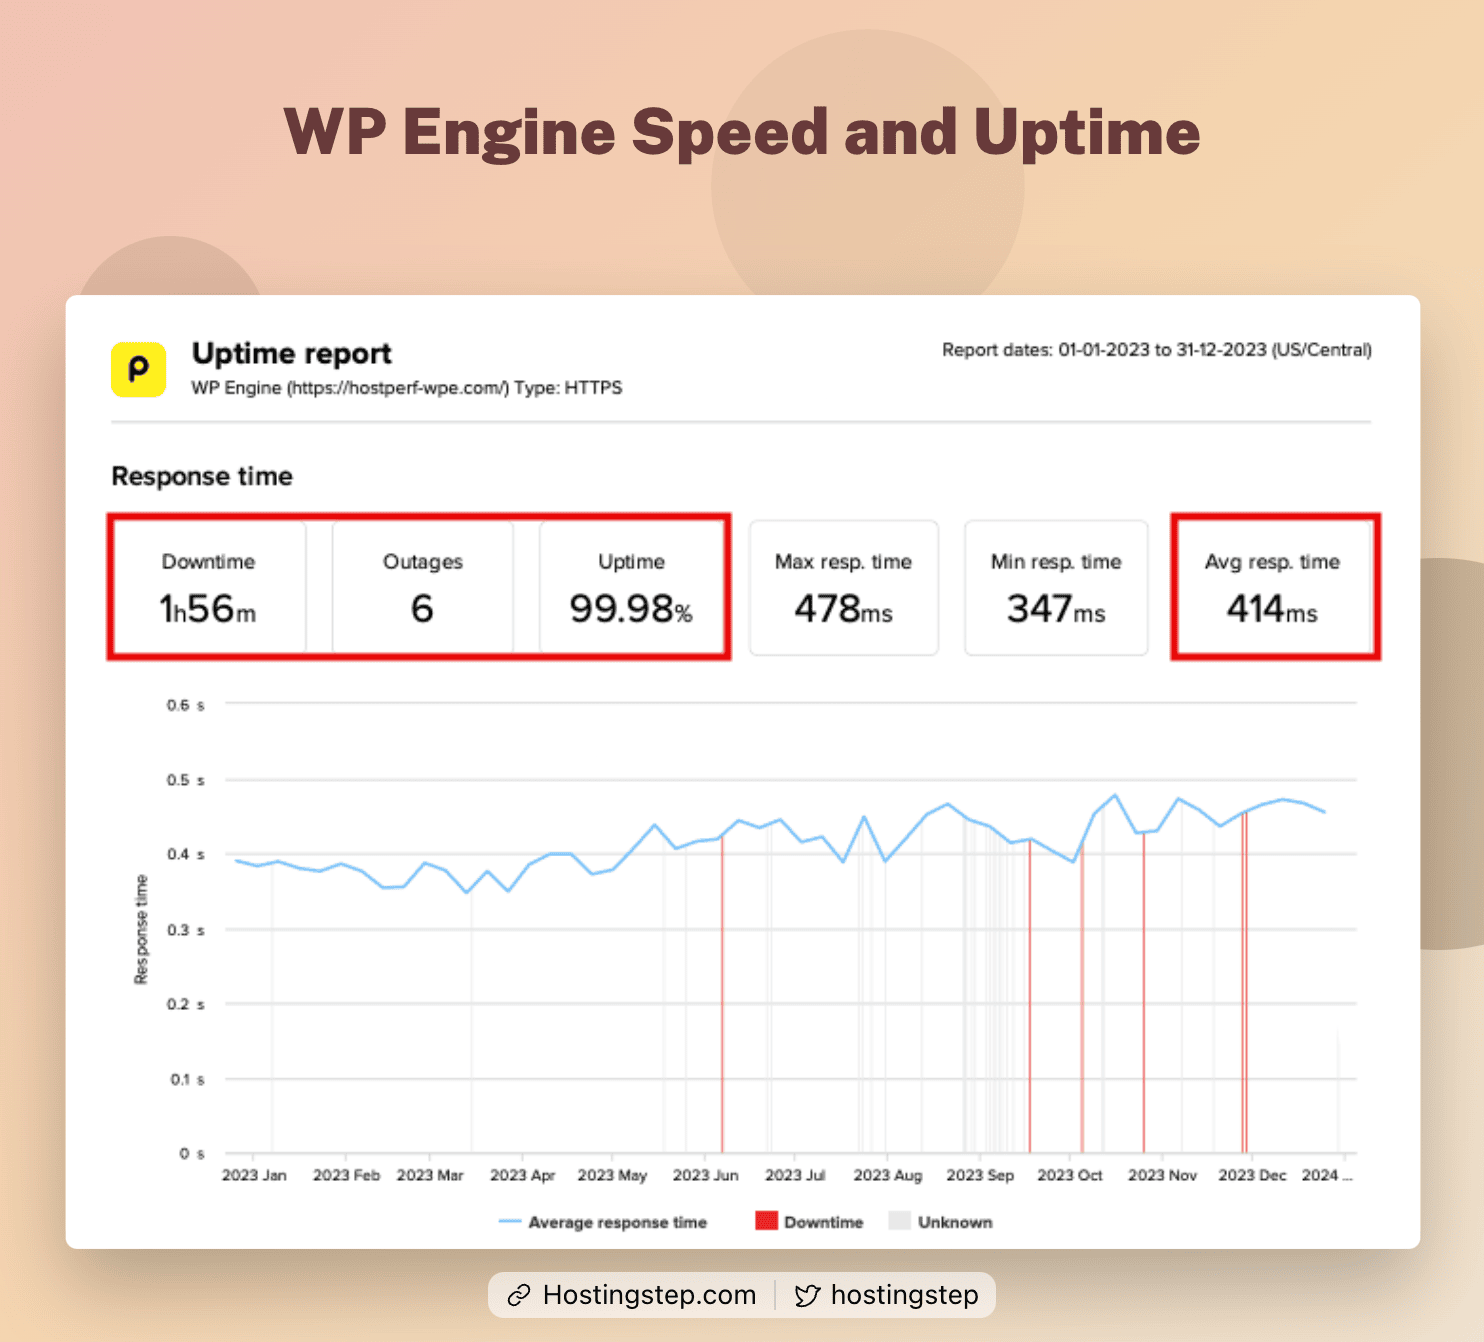
| WP Engine | 414 ms |
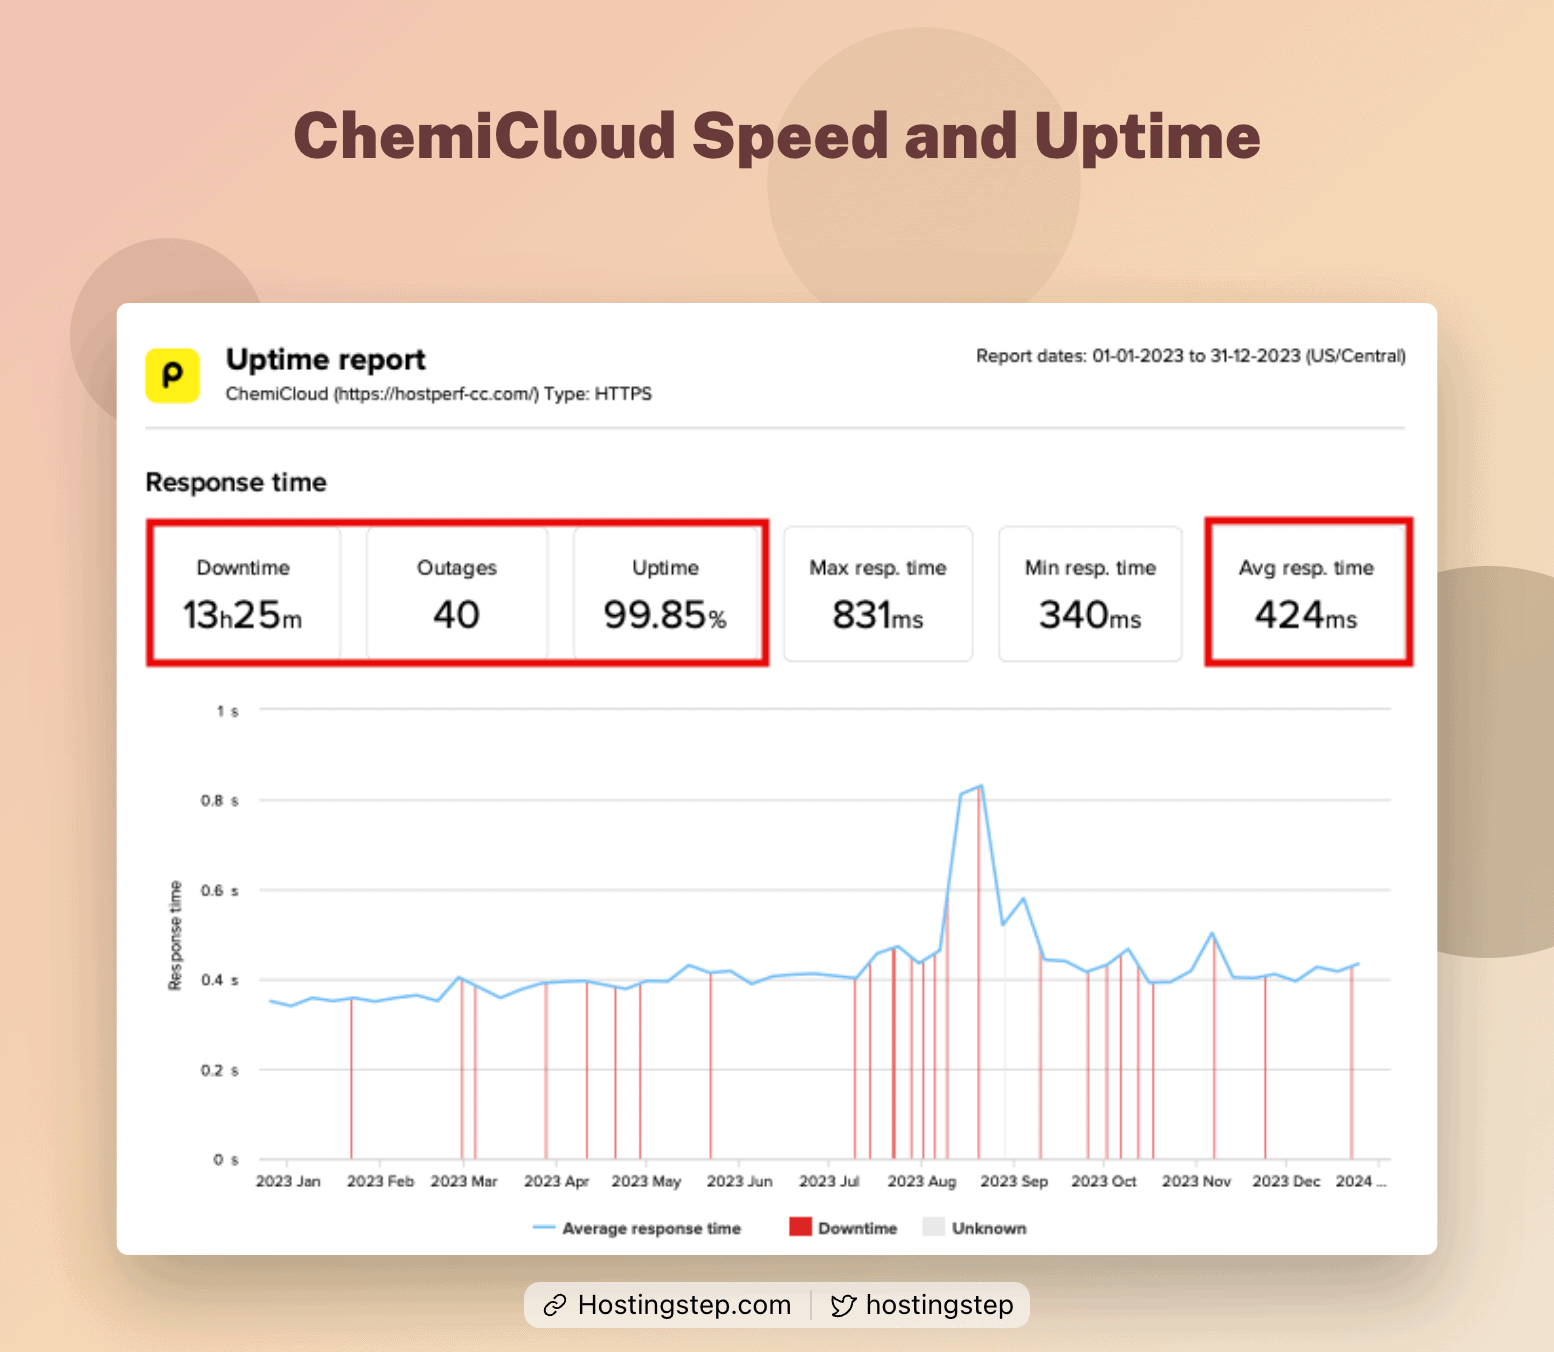
| ChemiCloud | 424 ms |
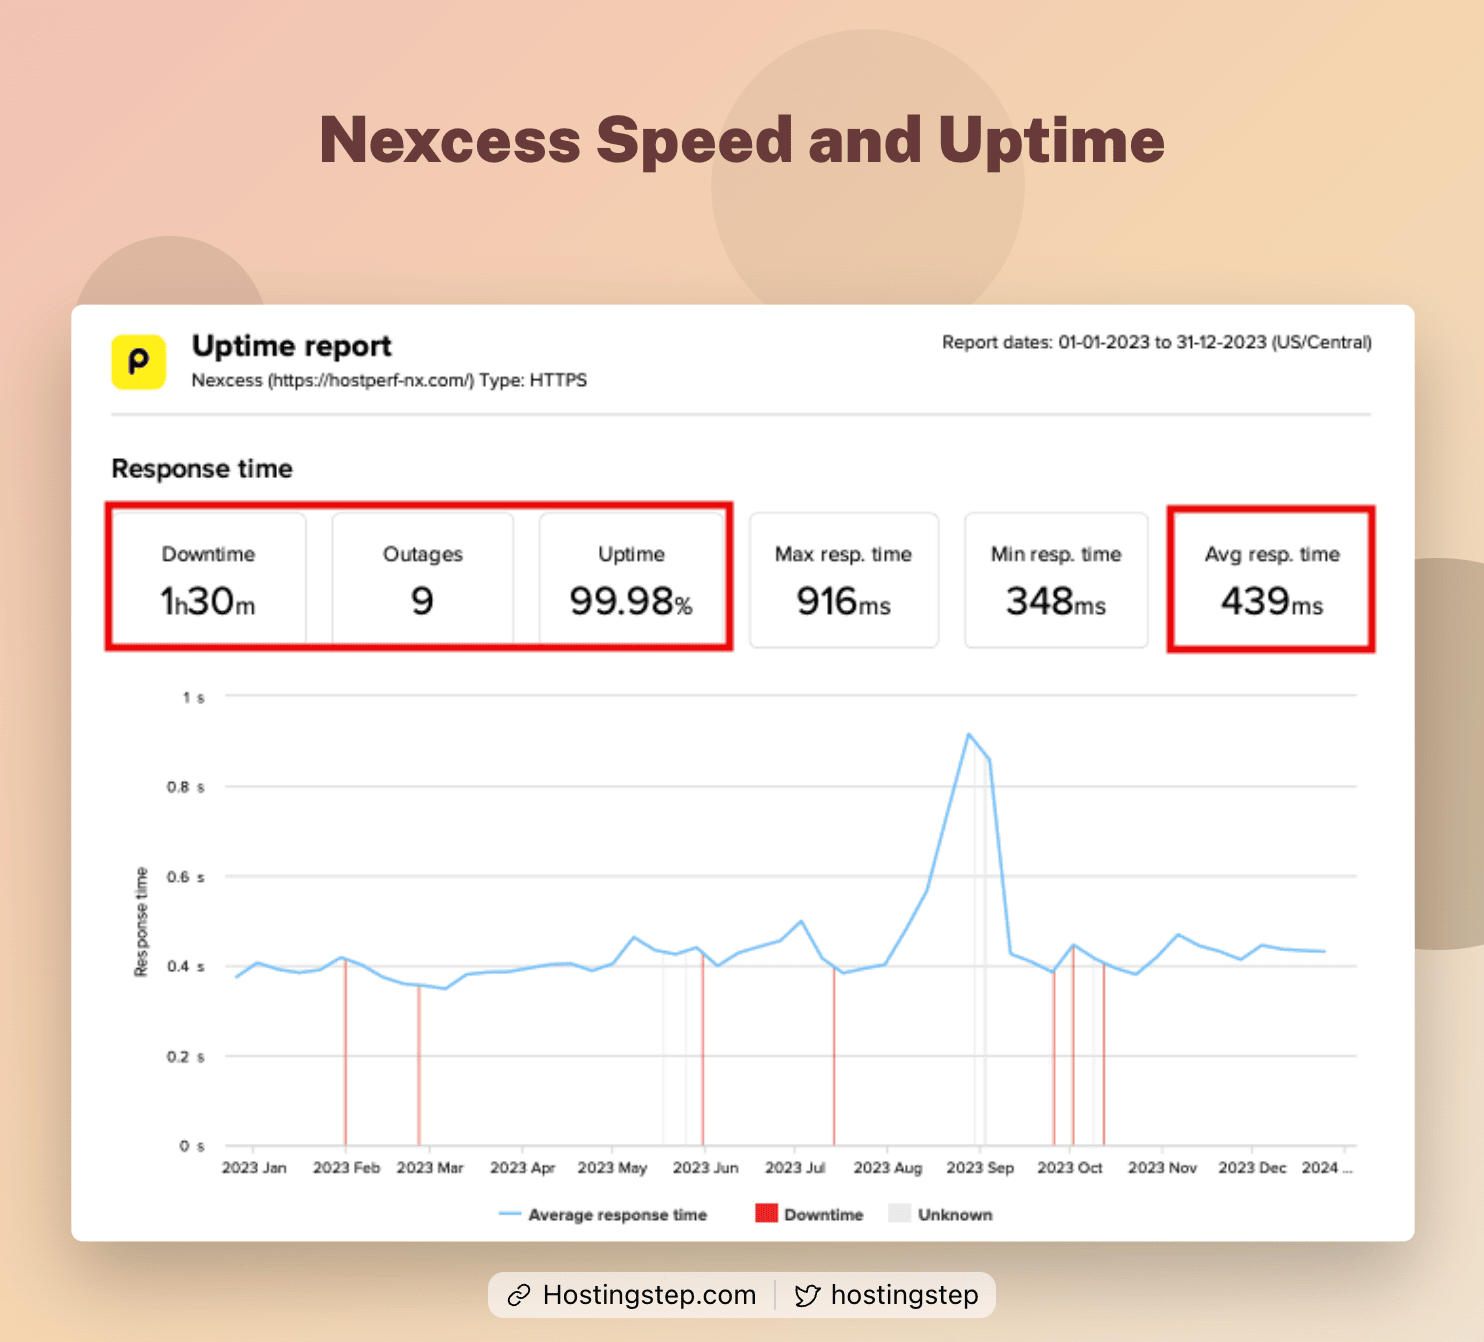
| Nexcess | 439 ms |
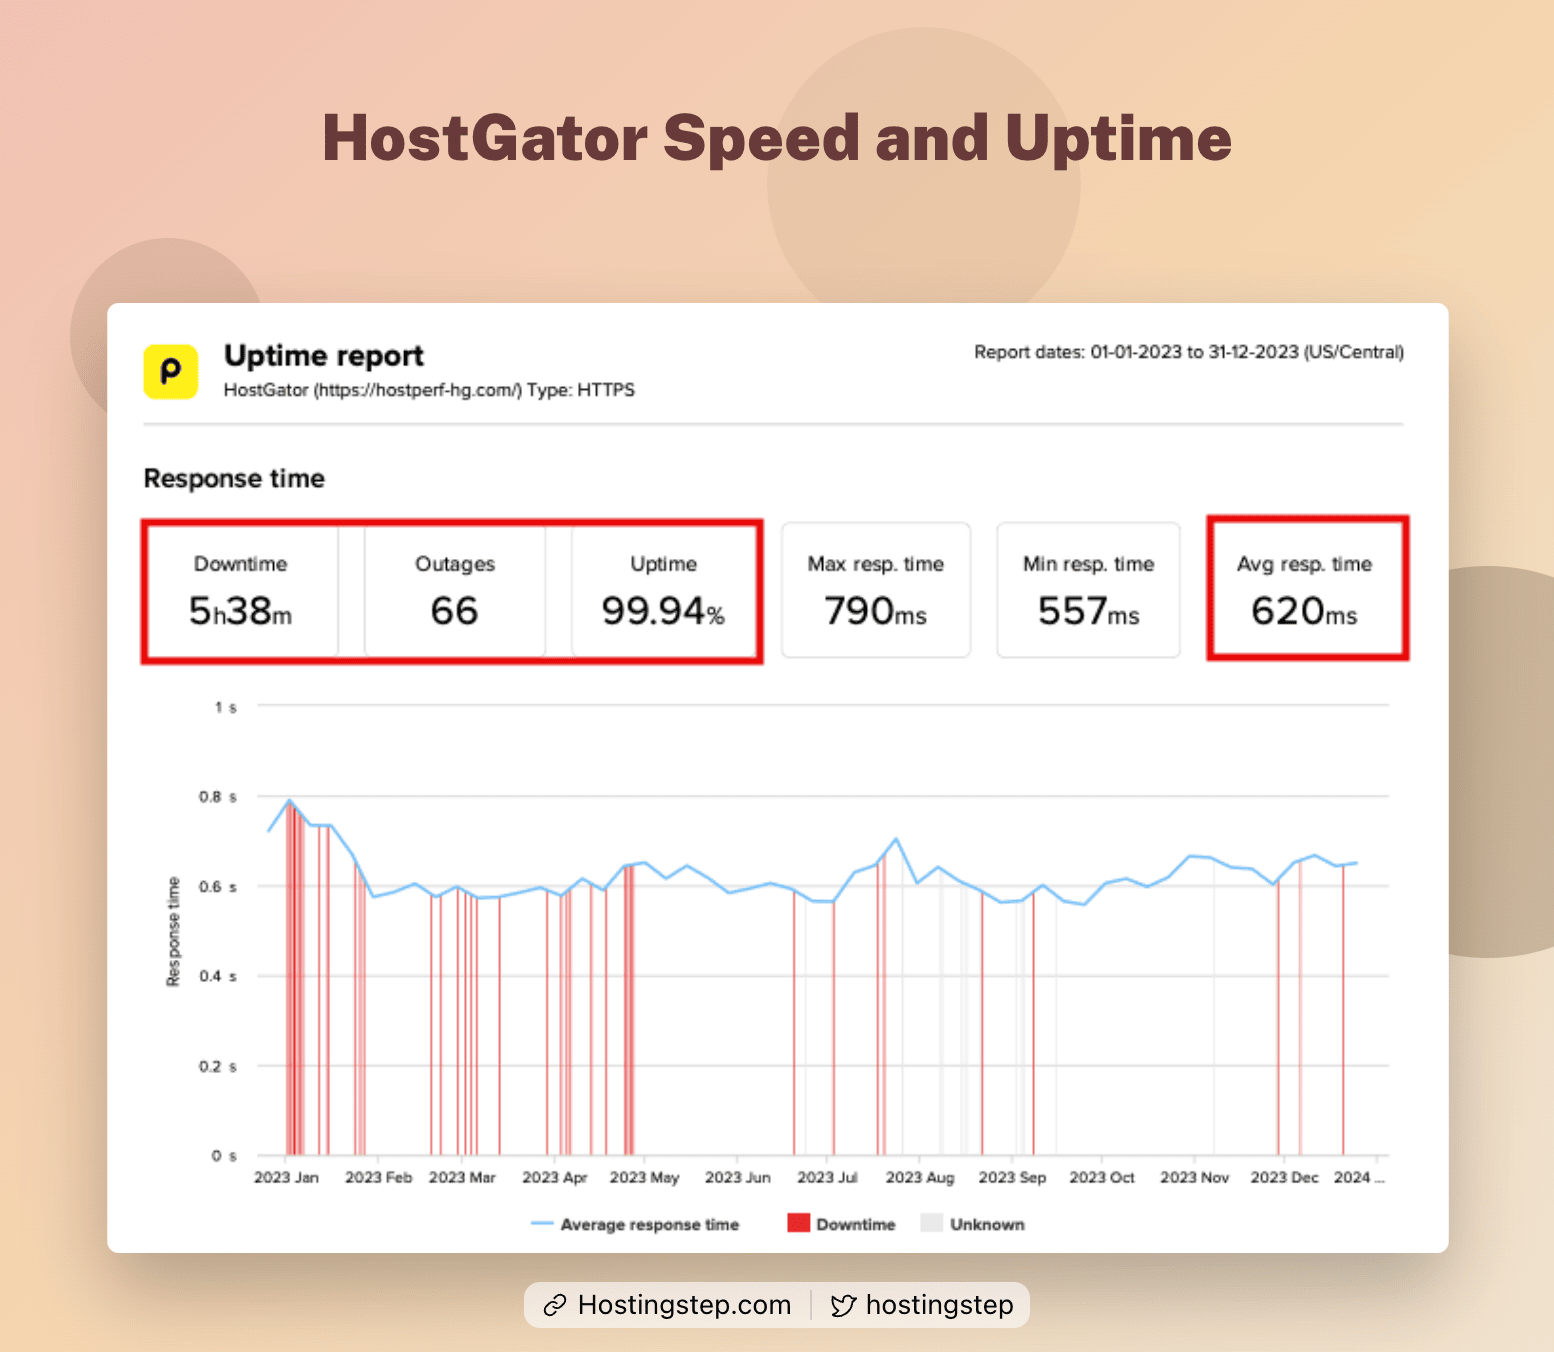
| HostGator | 620 ms |
Key takeaways:
Rocket, Cloudways, GreenGeeks, Templ, and A2 Hosting are the top five fastest hosts in our server TTFB test.
Shared hosting services like GreenGeeks, and A2 Hosting comfortably beat WP Engine and Kinsta in terms of TTFB.
HostGator is the slowest host, with a TTFB of 684ms.
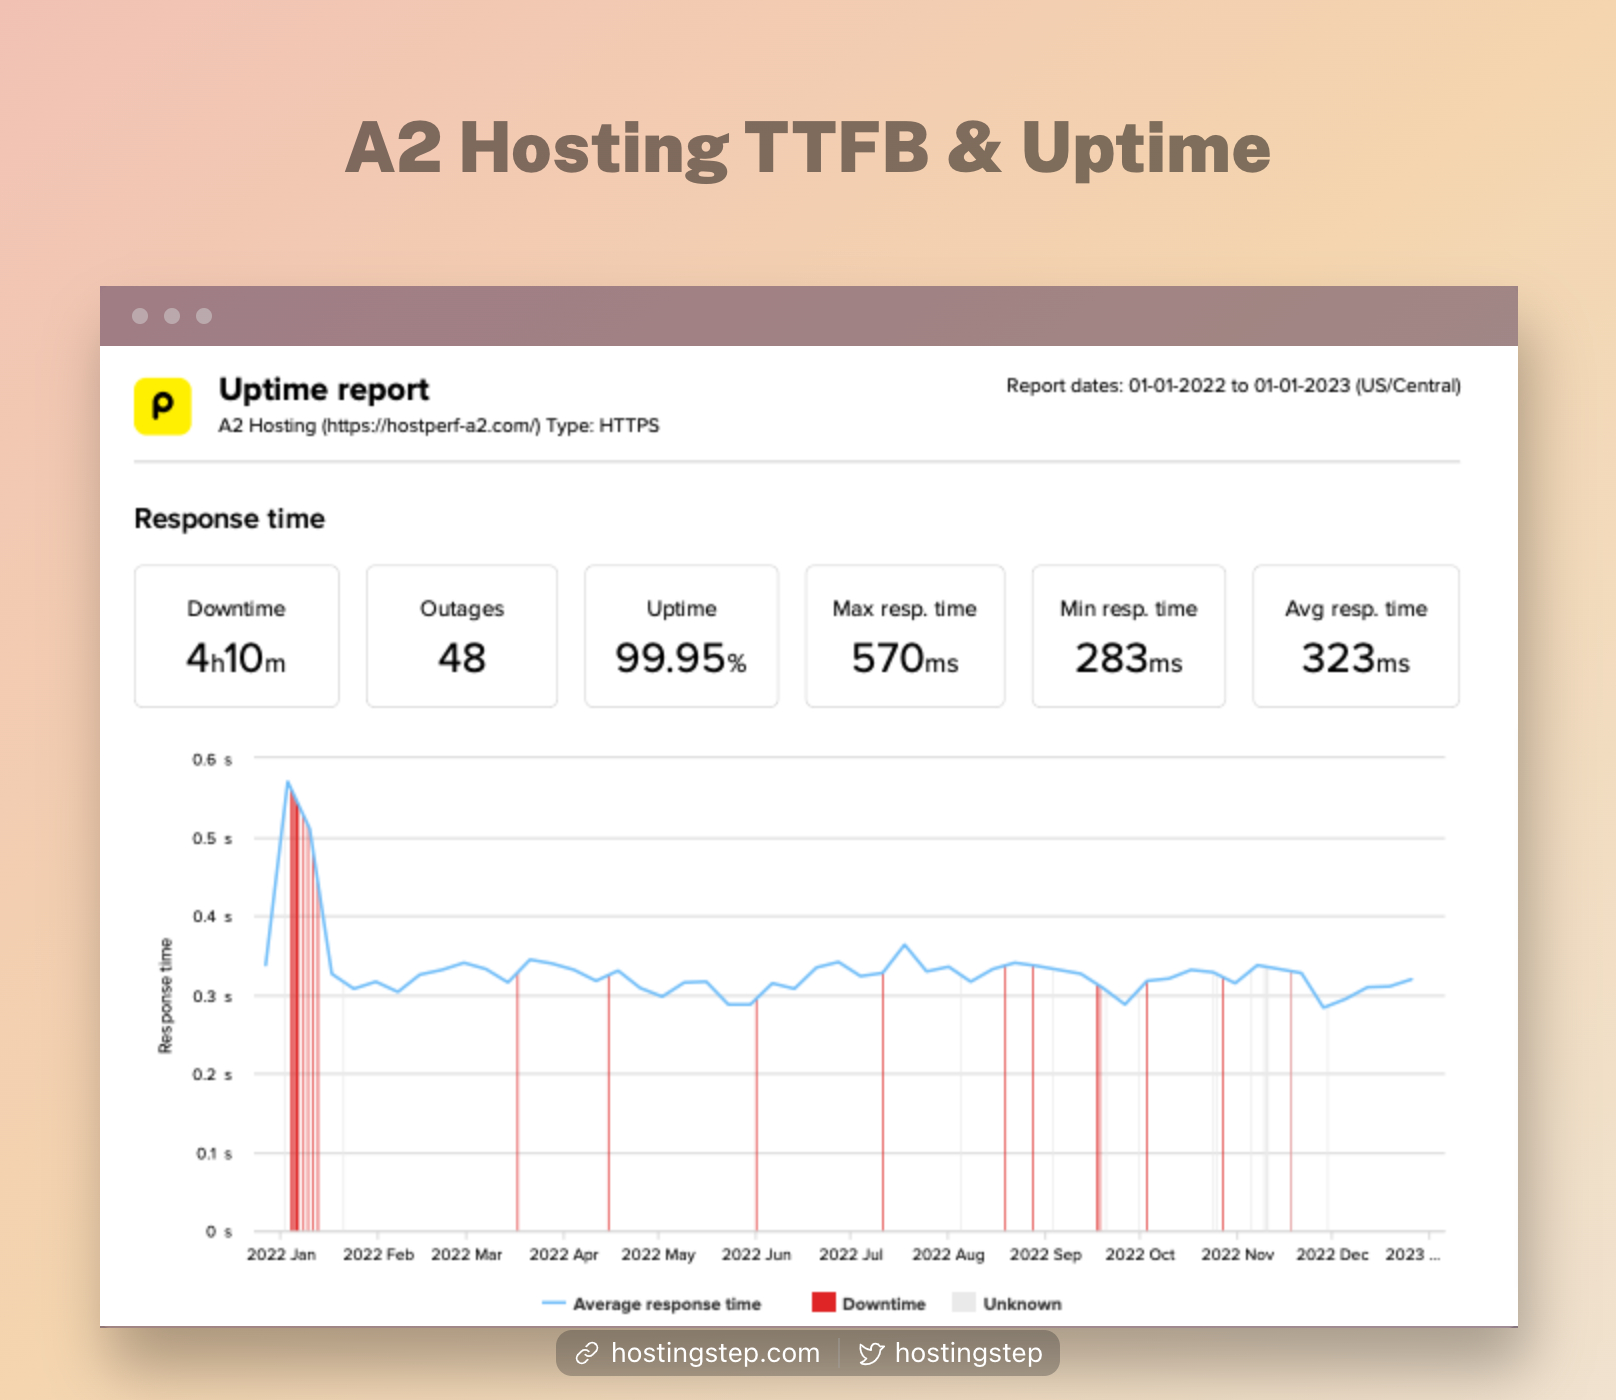
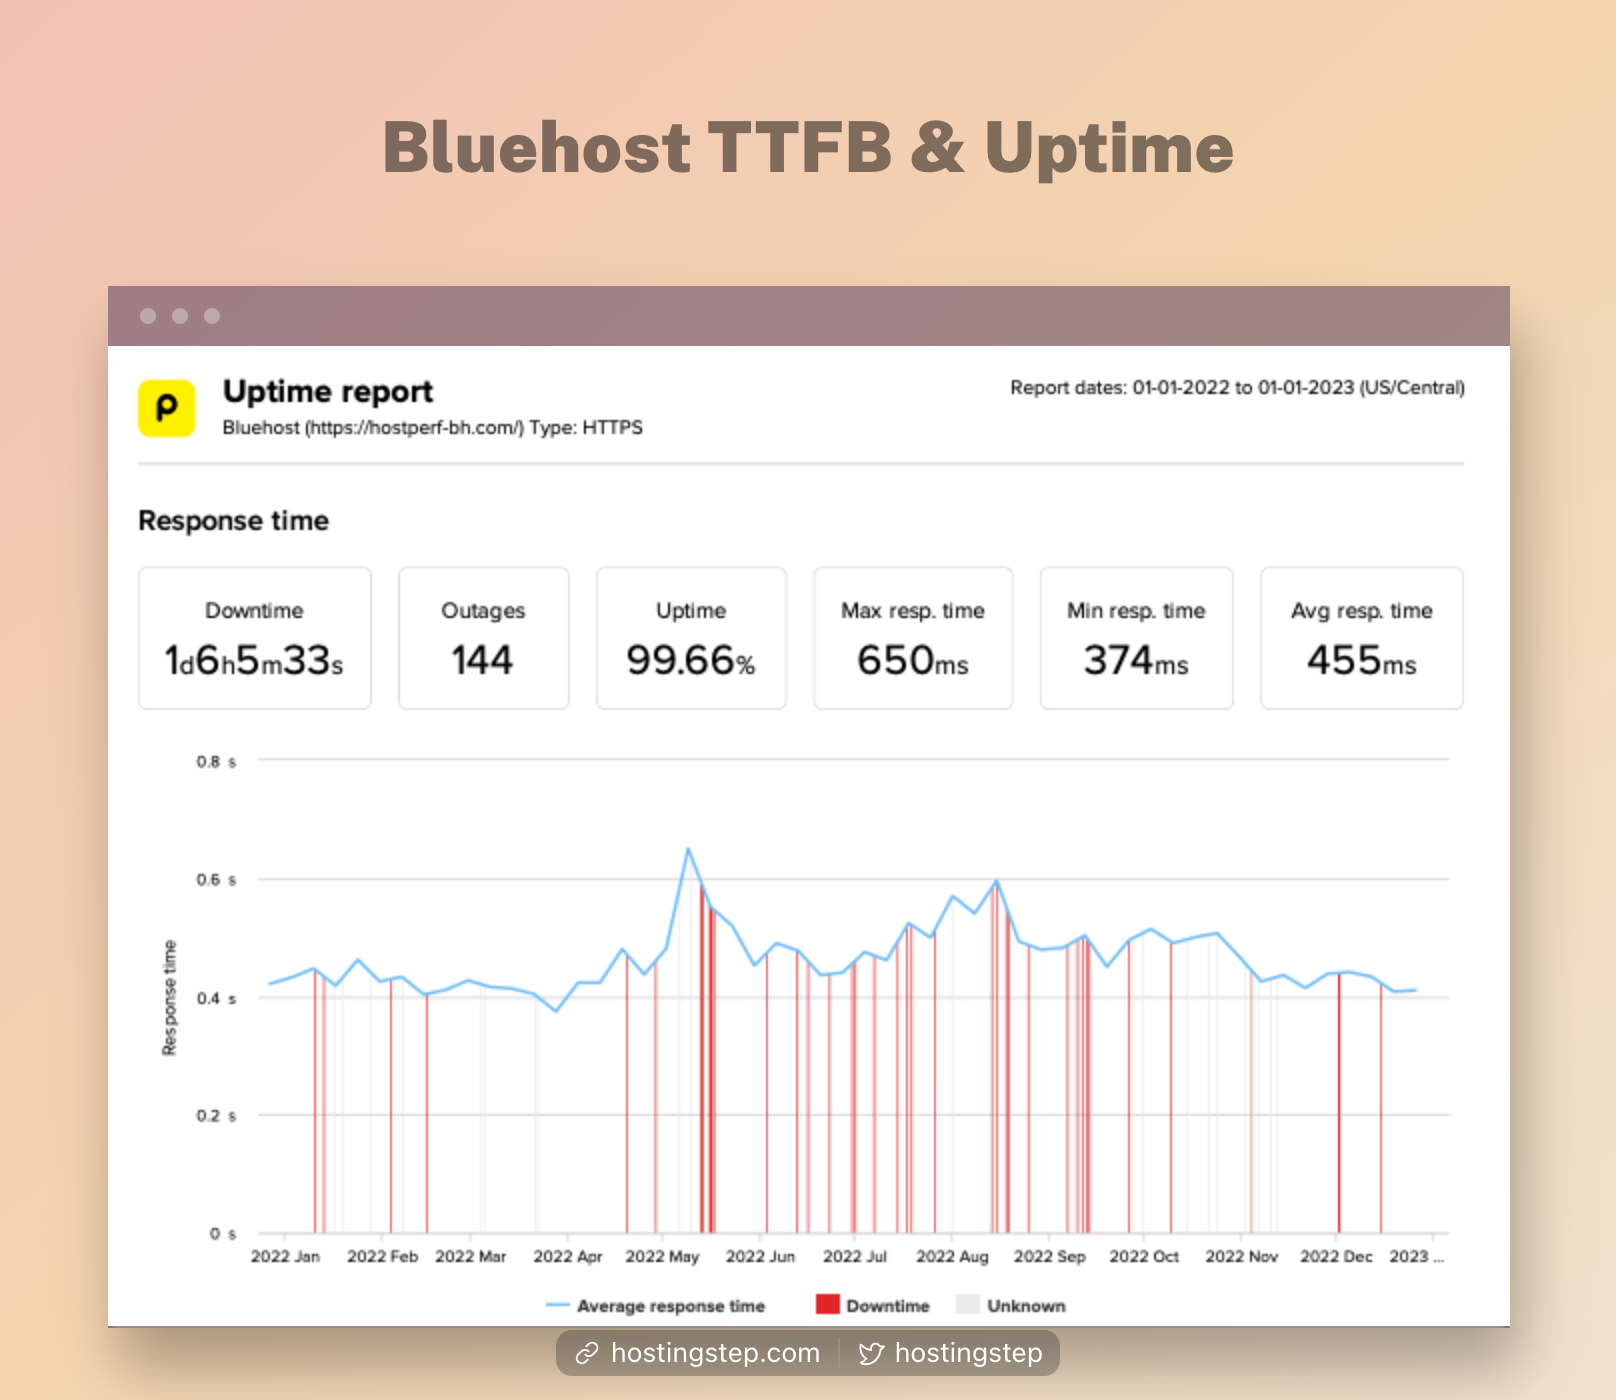
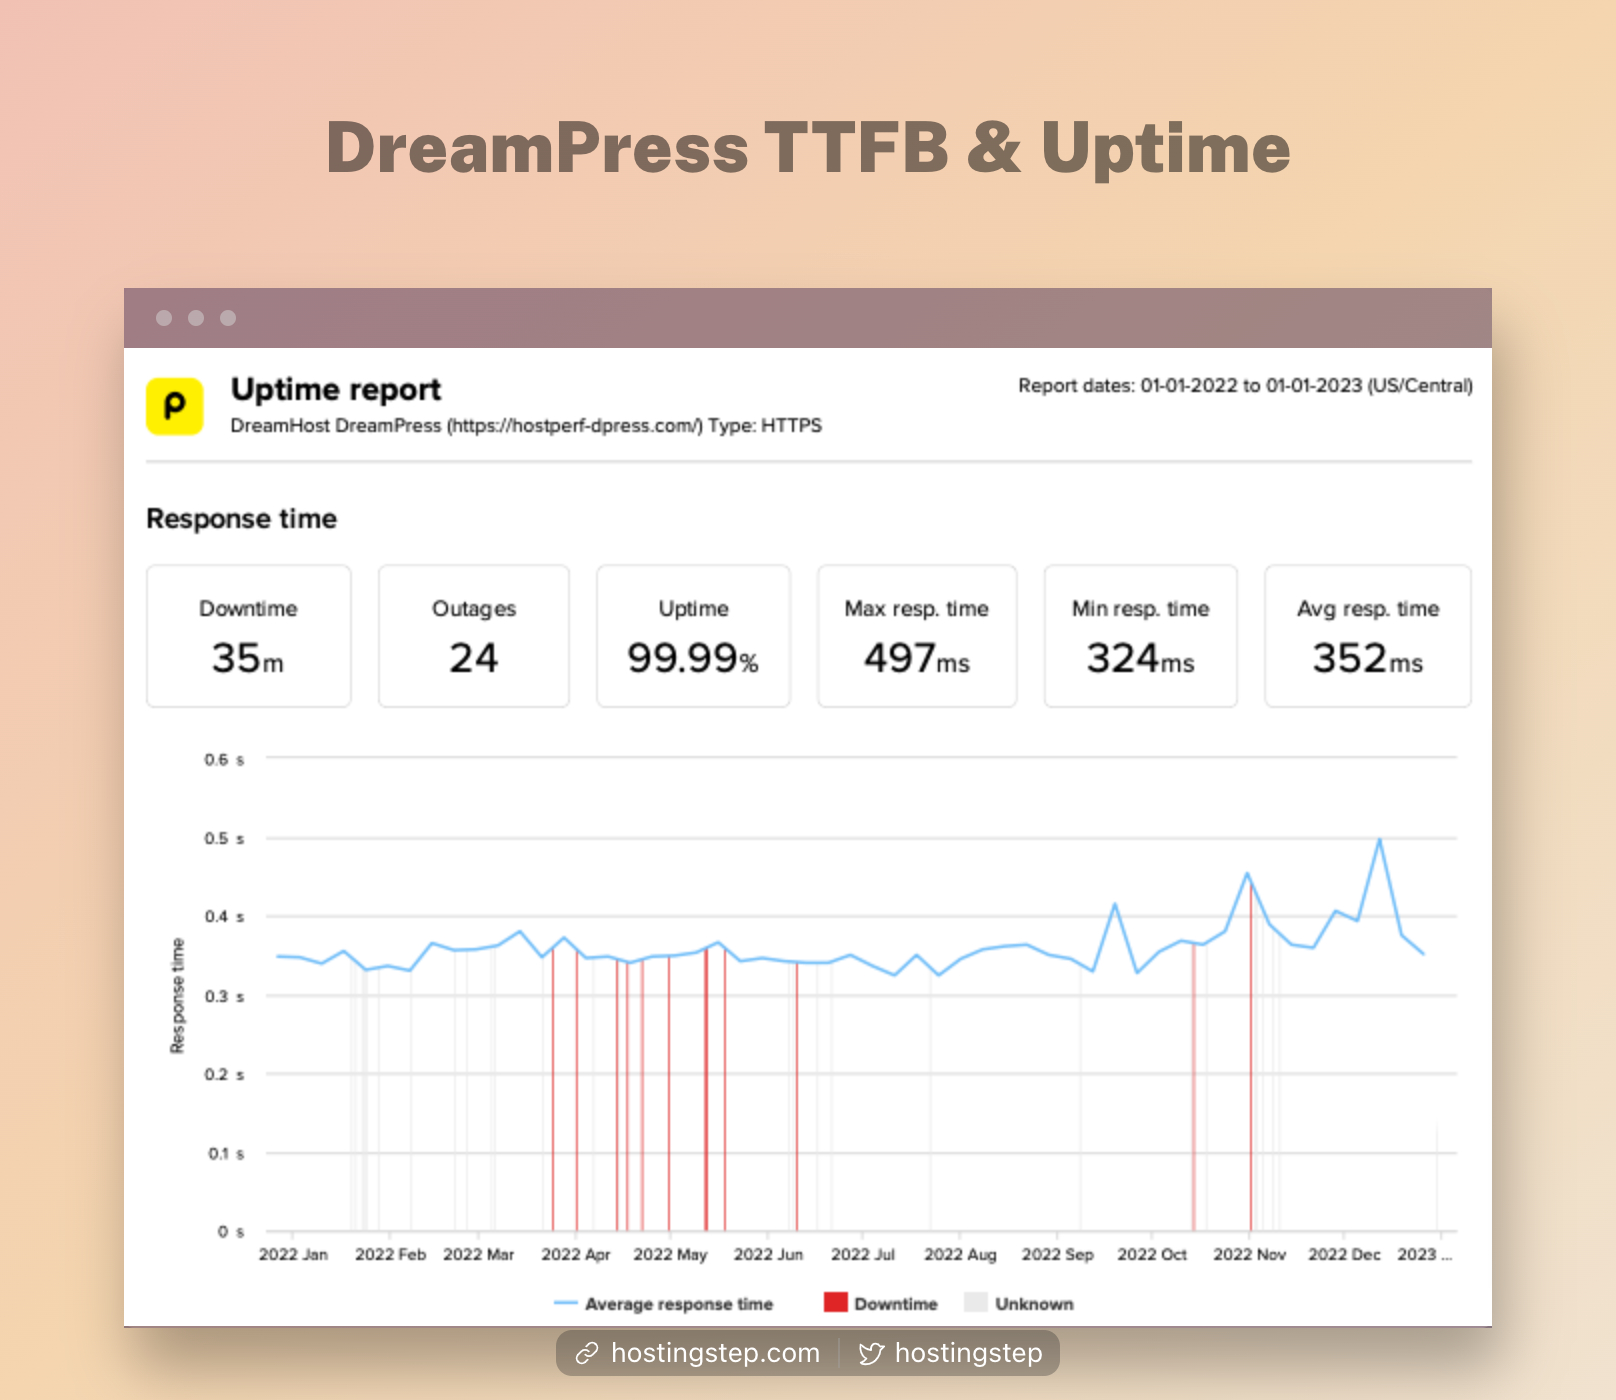
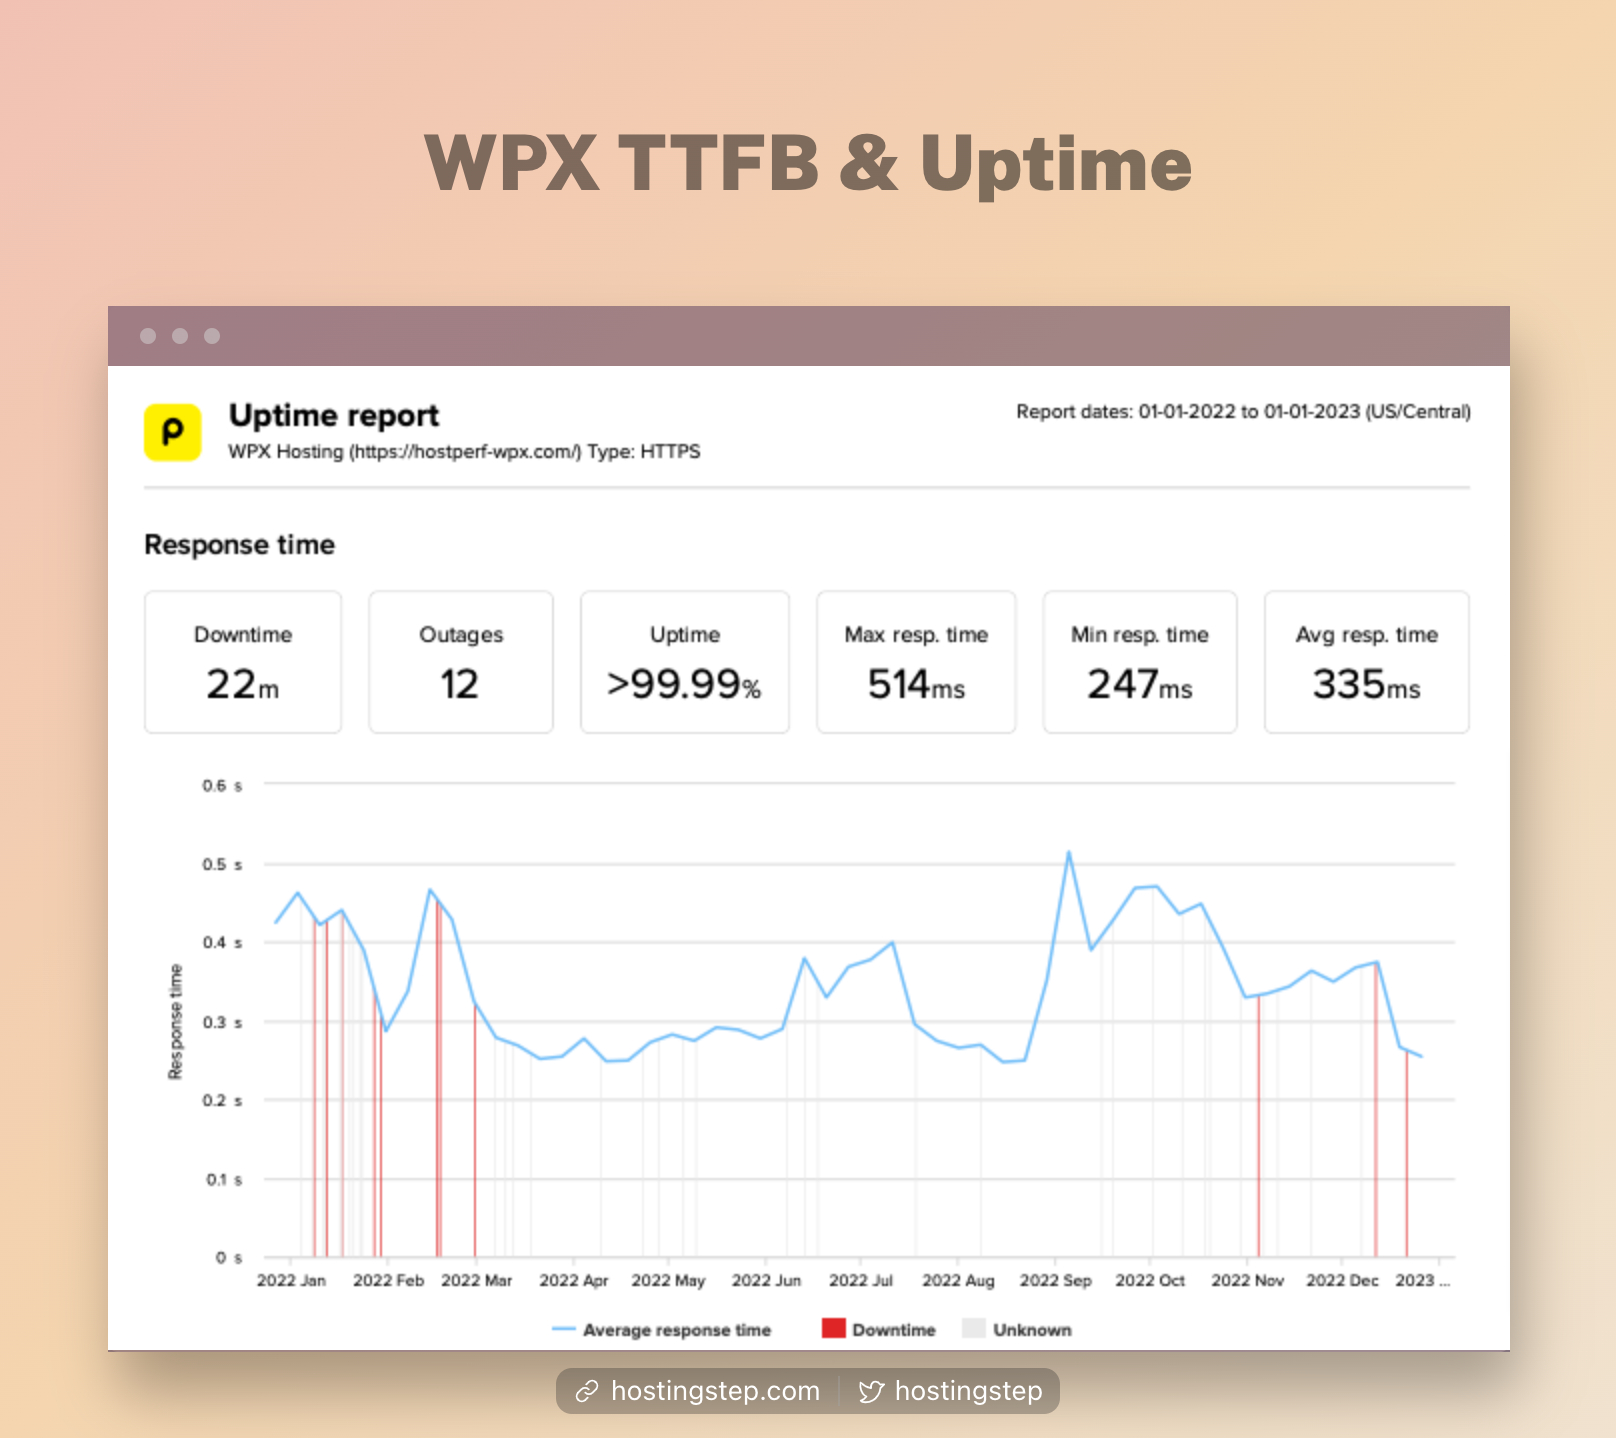


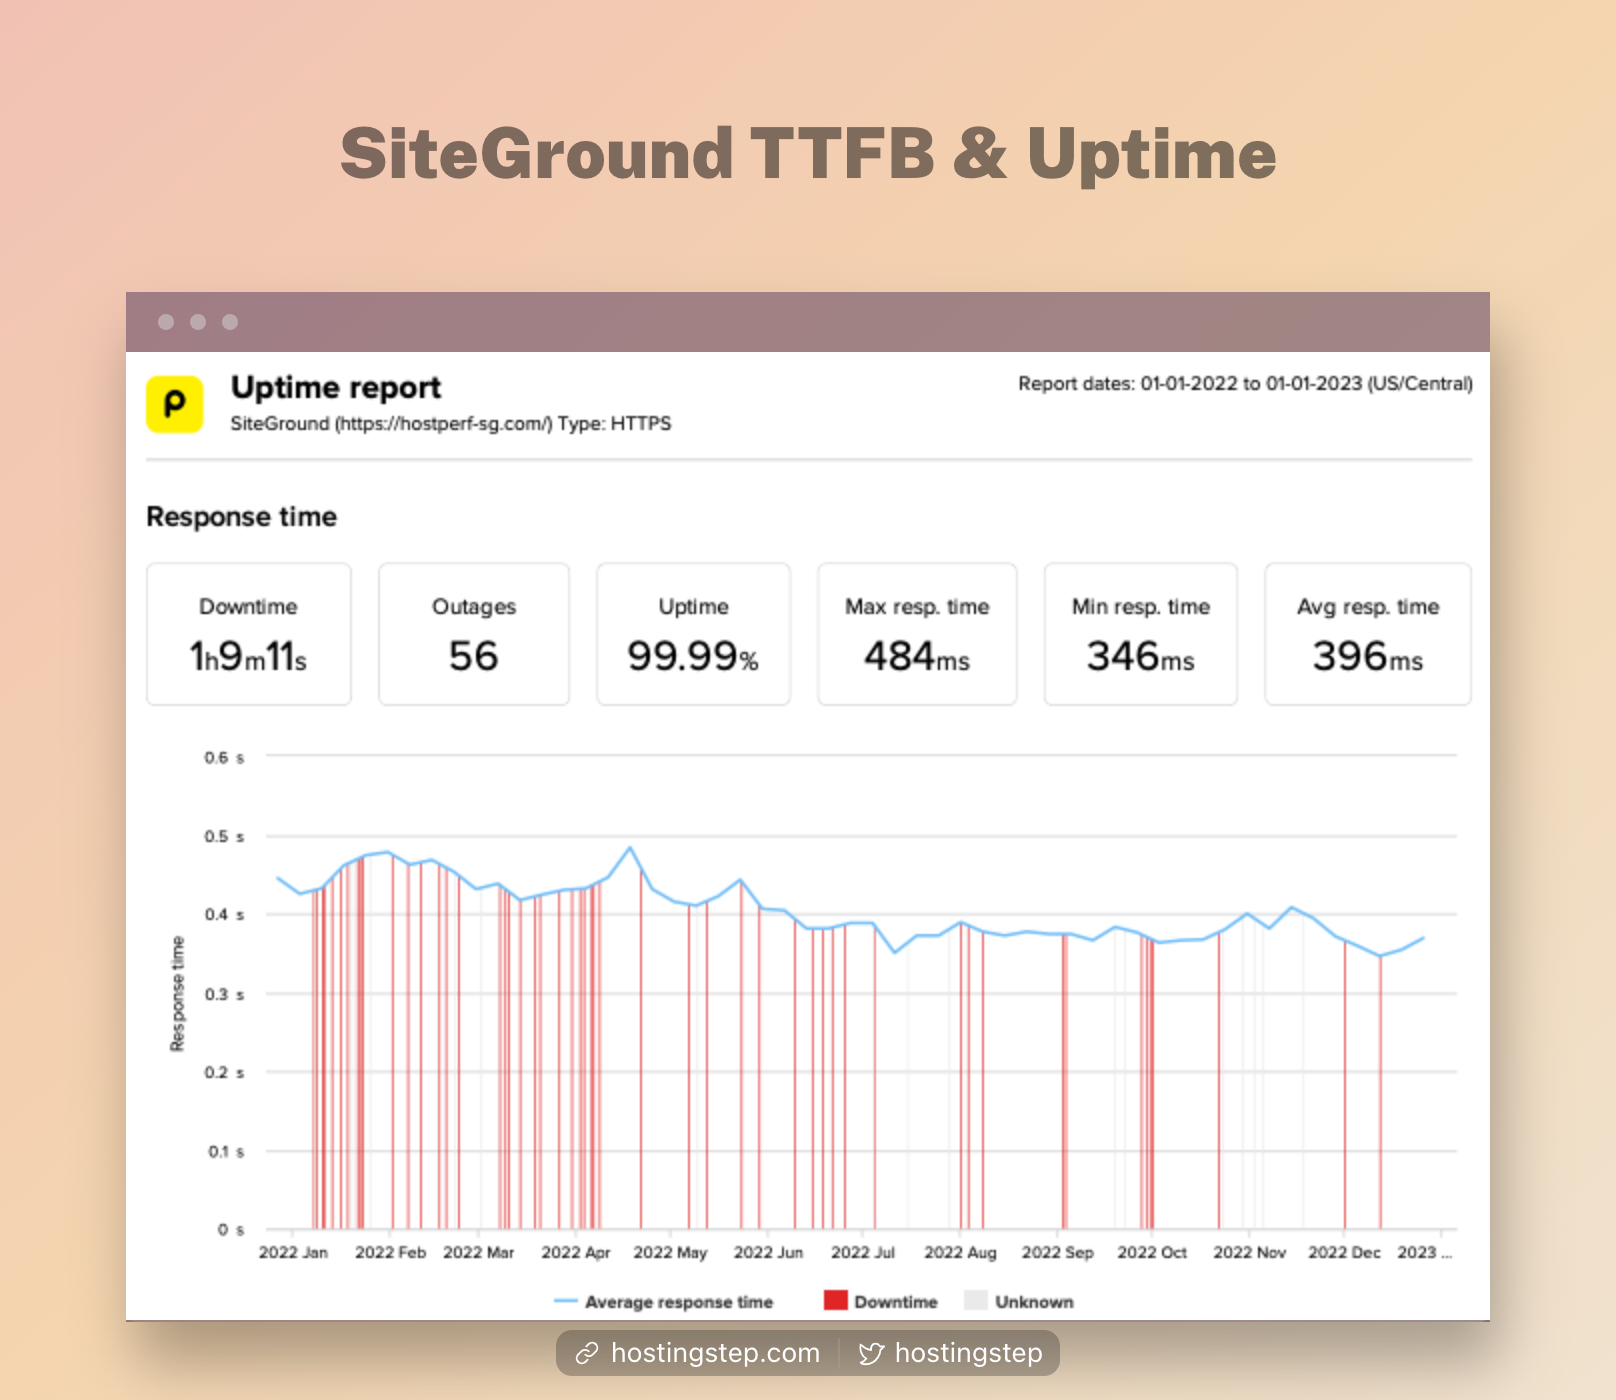
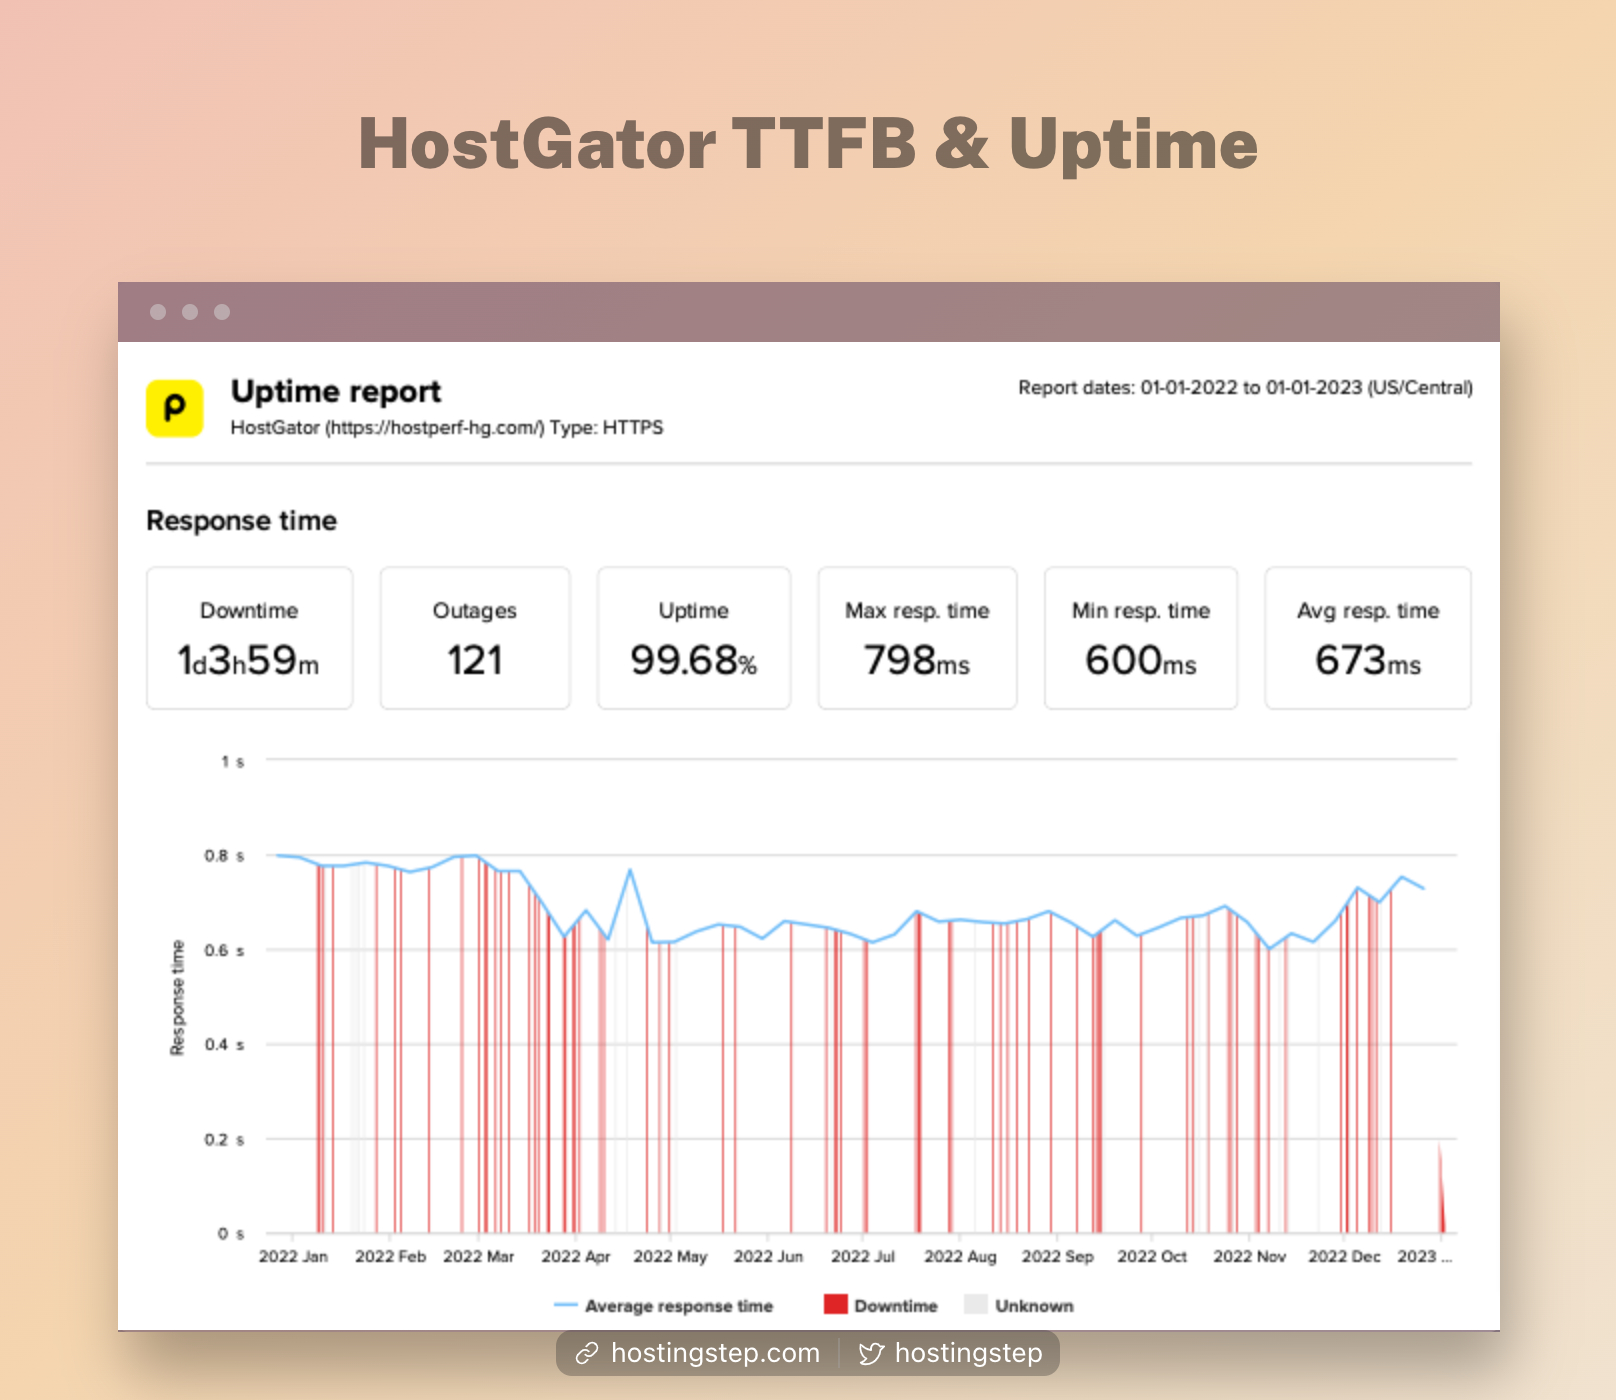
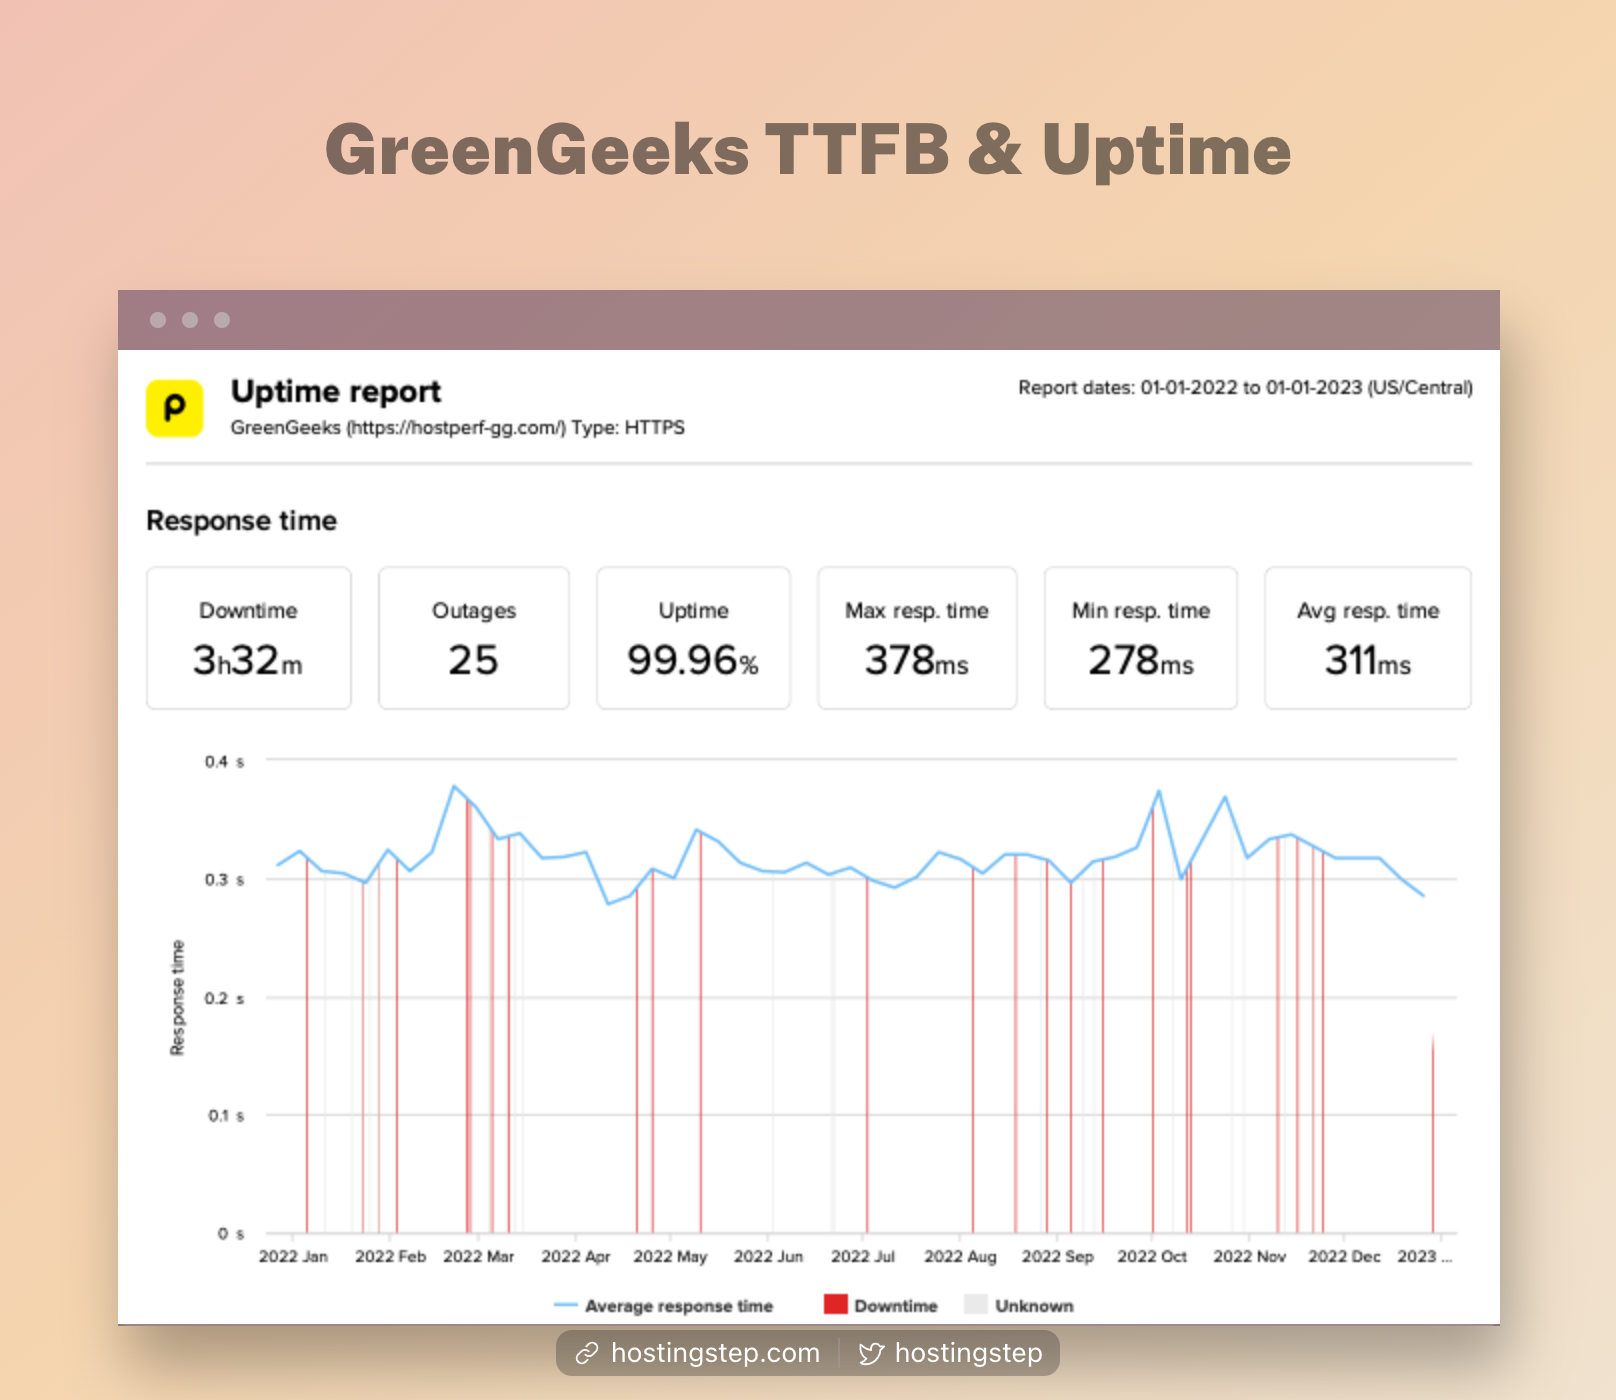

Benchmark Test 2 – Uptime
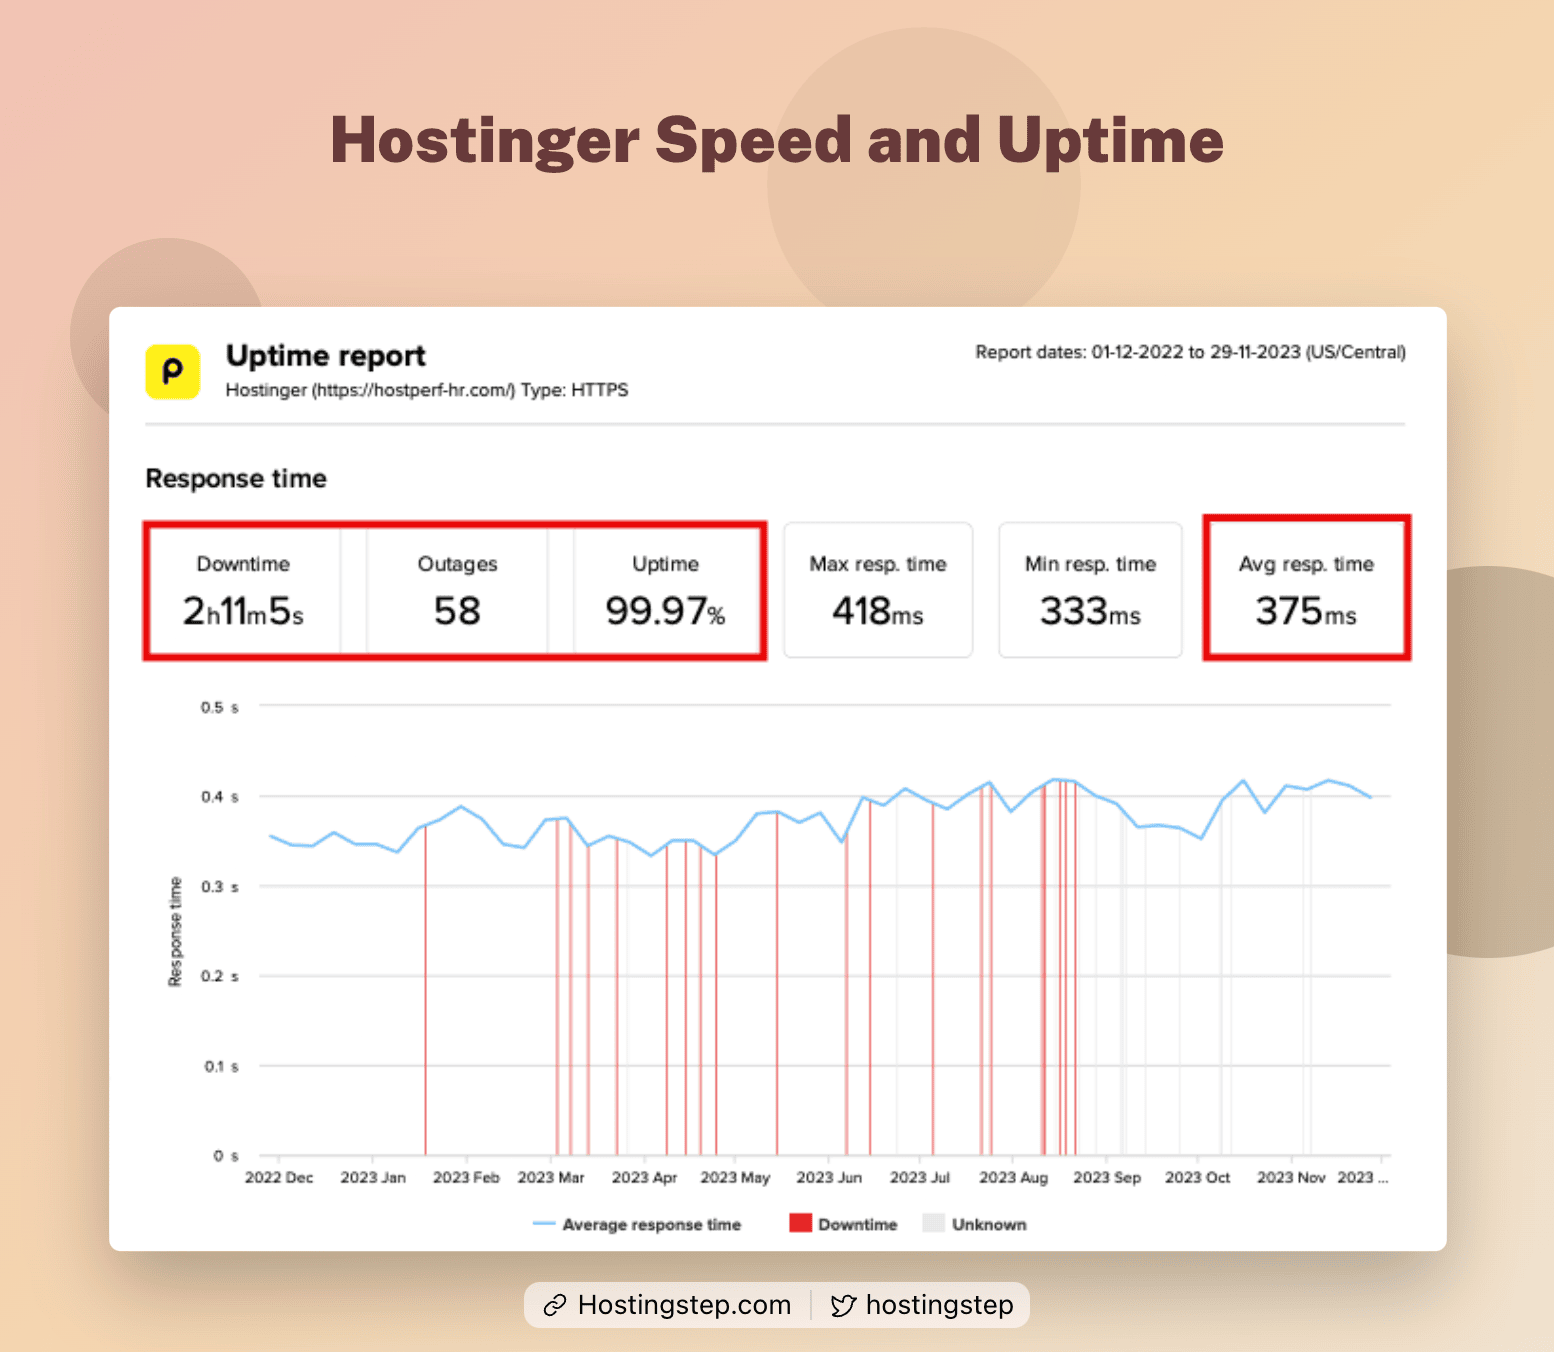
This uptime test is done to ensure the fastest WordPress hosting is also reliable. There is no use in using the fastest host with poor uptime records.
I used Pingdom to track the uptime from 20 USA locations. Refer to the above images for uptime data.
Results
| Hosting | Uptime | Total Downtime | Total Outages |
|---|---|---|---|
| Rocket.net | 100% | 0 | 0 |
| Templ | 100% | 0 | 0 |
| WPX Hosting | 100% | 0 | 0 |
| Cloudways | 99.99% | 2 mins | 1 |
| A2 Hosting | 99.99% | 30 mins | 14 |
| Kinsta | 99.99% | 25 mins | 1 |
| SiteGround | 99.99% | 1 hour 3mins | 43 |
| FastComet | 99.98% | 2 hours 1 min | 26 |
| WP Engine | 99.98% | 1 hour 56 mins | 6 |
| Nexcess | 99.98% | 1 hour 30 mins | 9 |
| GreenGeeks | 99.97% | 2 hours 43 mins | 16 |
| Hostinger | 99.97% | 2 hours 11 mins | 58 |
| Bluehost | 99.95% | 4 hours 28 mins | 68 |
| HostGator | 99.94% | 5 hours 30 mins | 66 |
| ChemiCloud | 99.85% | 13 hours 25 mins | 40 |
| DreamPress | 99.82% | 15 hours 58 mins | 42 |
Key takeaways:
Out of all hosts, Rocket is the only host to secure 100% uptime in the last 12 months. There are seven companies that recorded 99.99% uptime.
Hostinger, HostGator, and Bluehost recorded the lowest uptime.
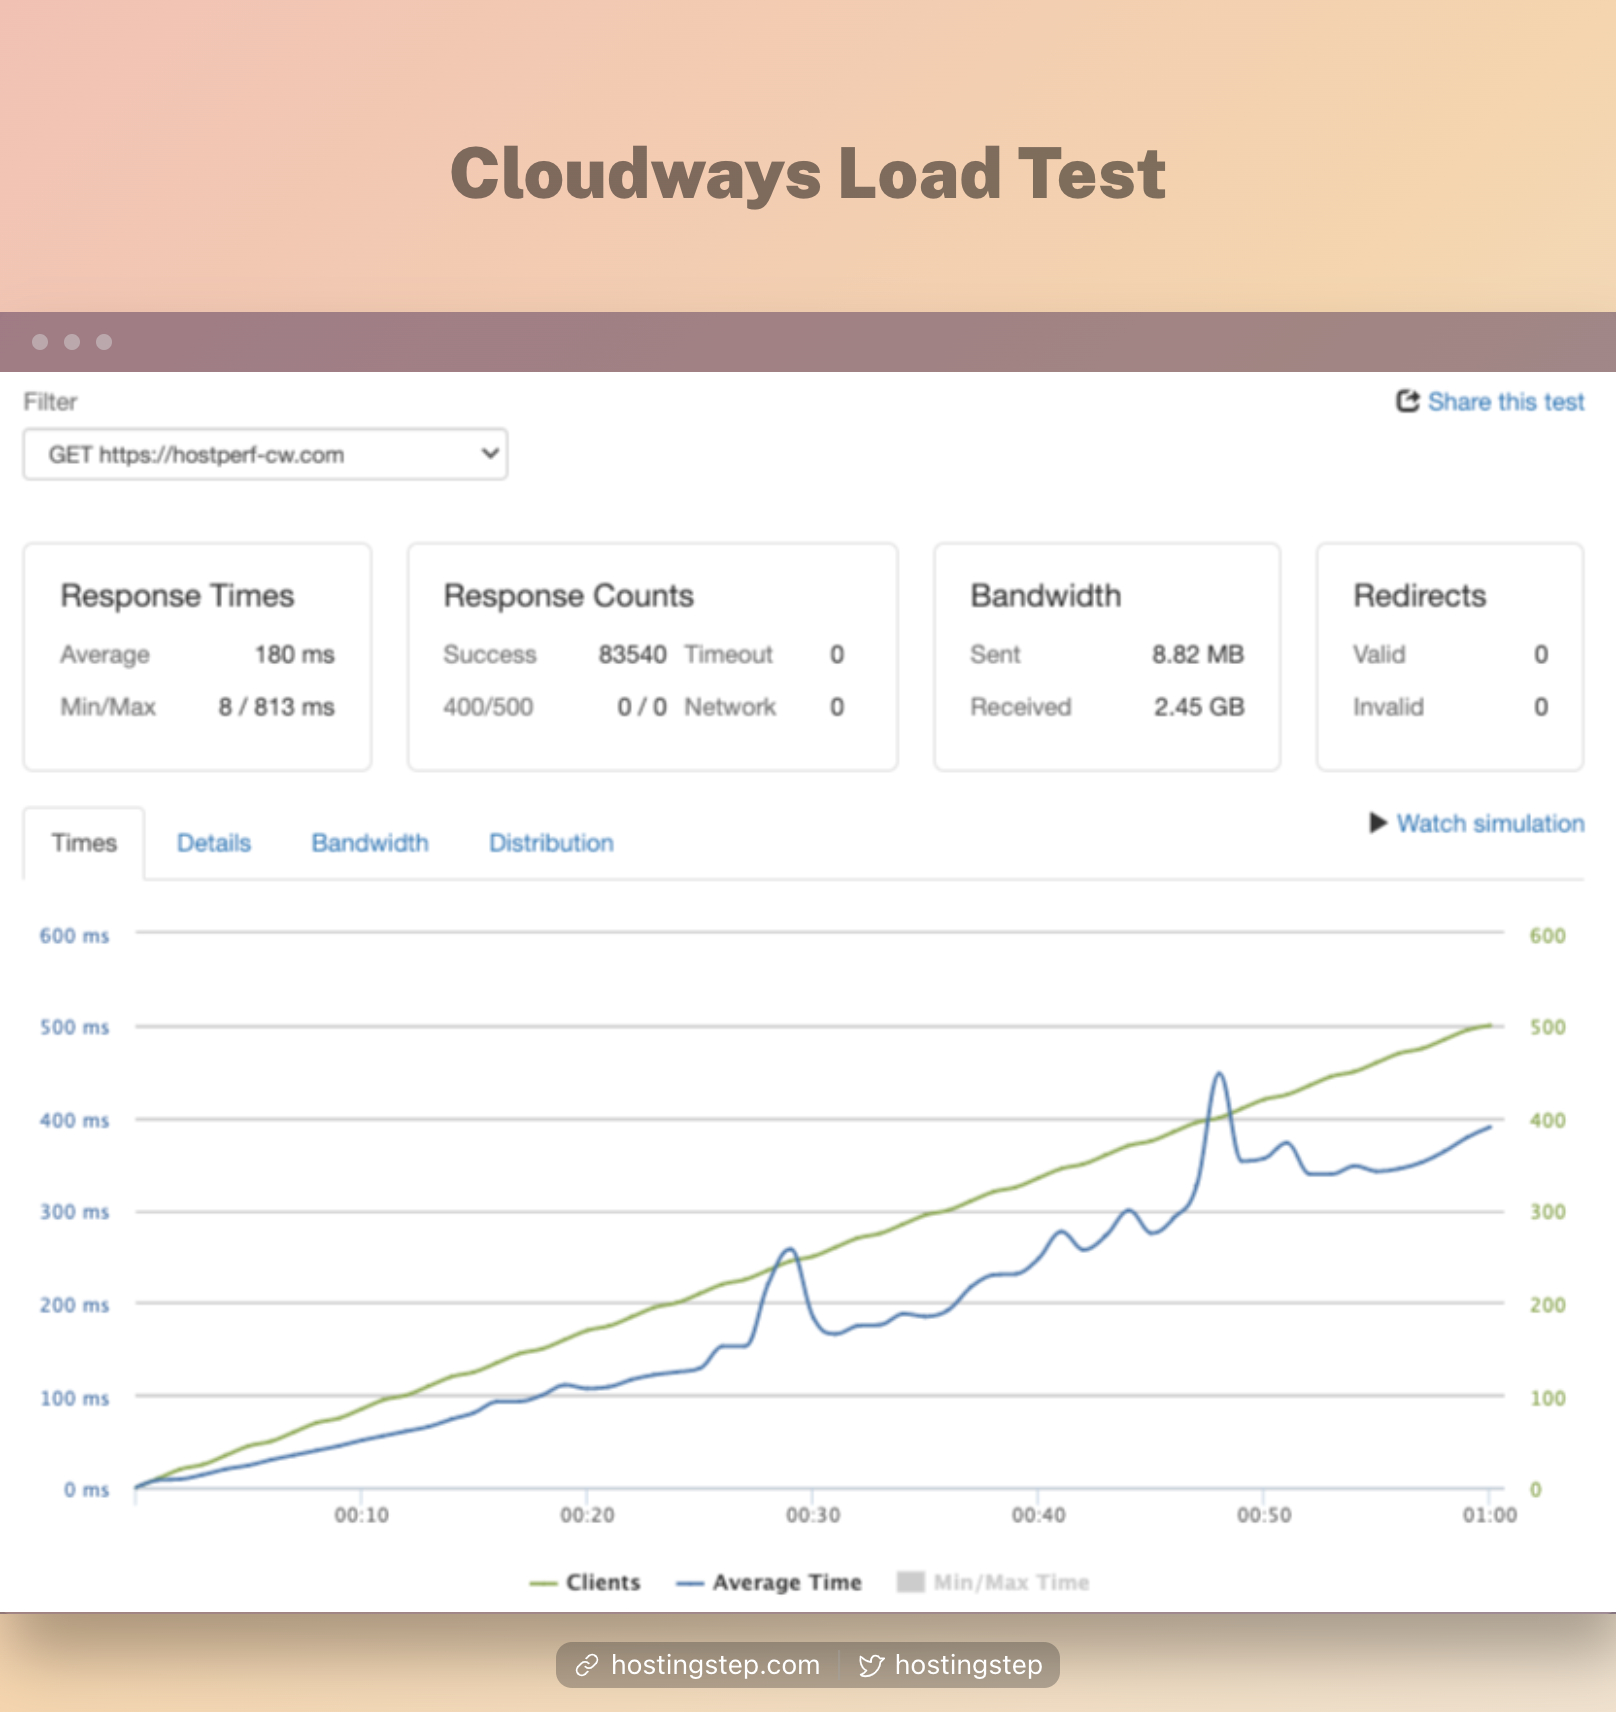
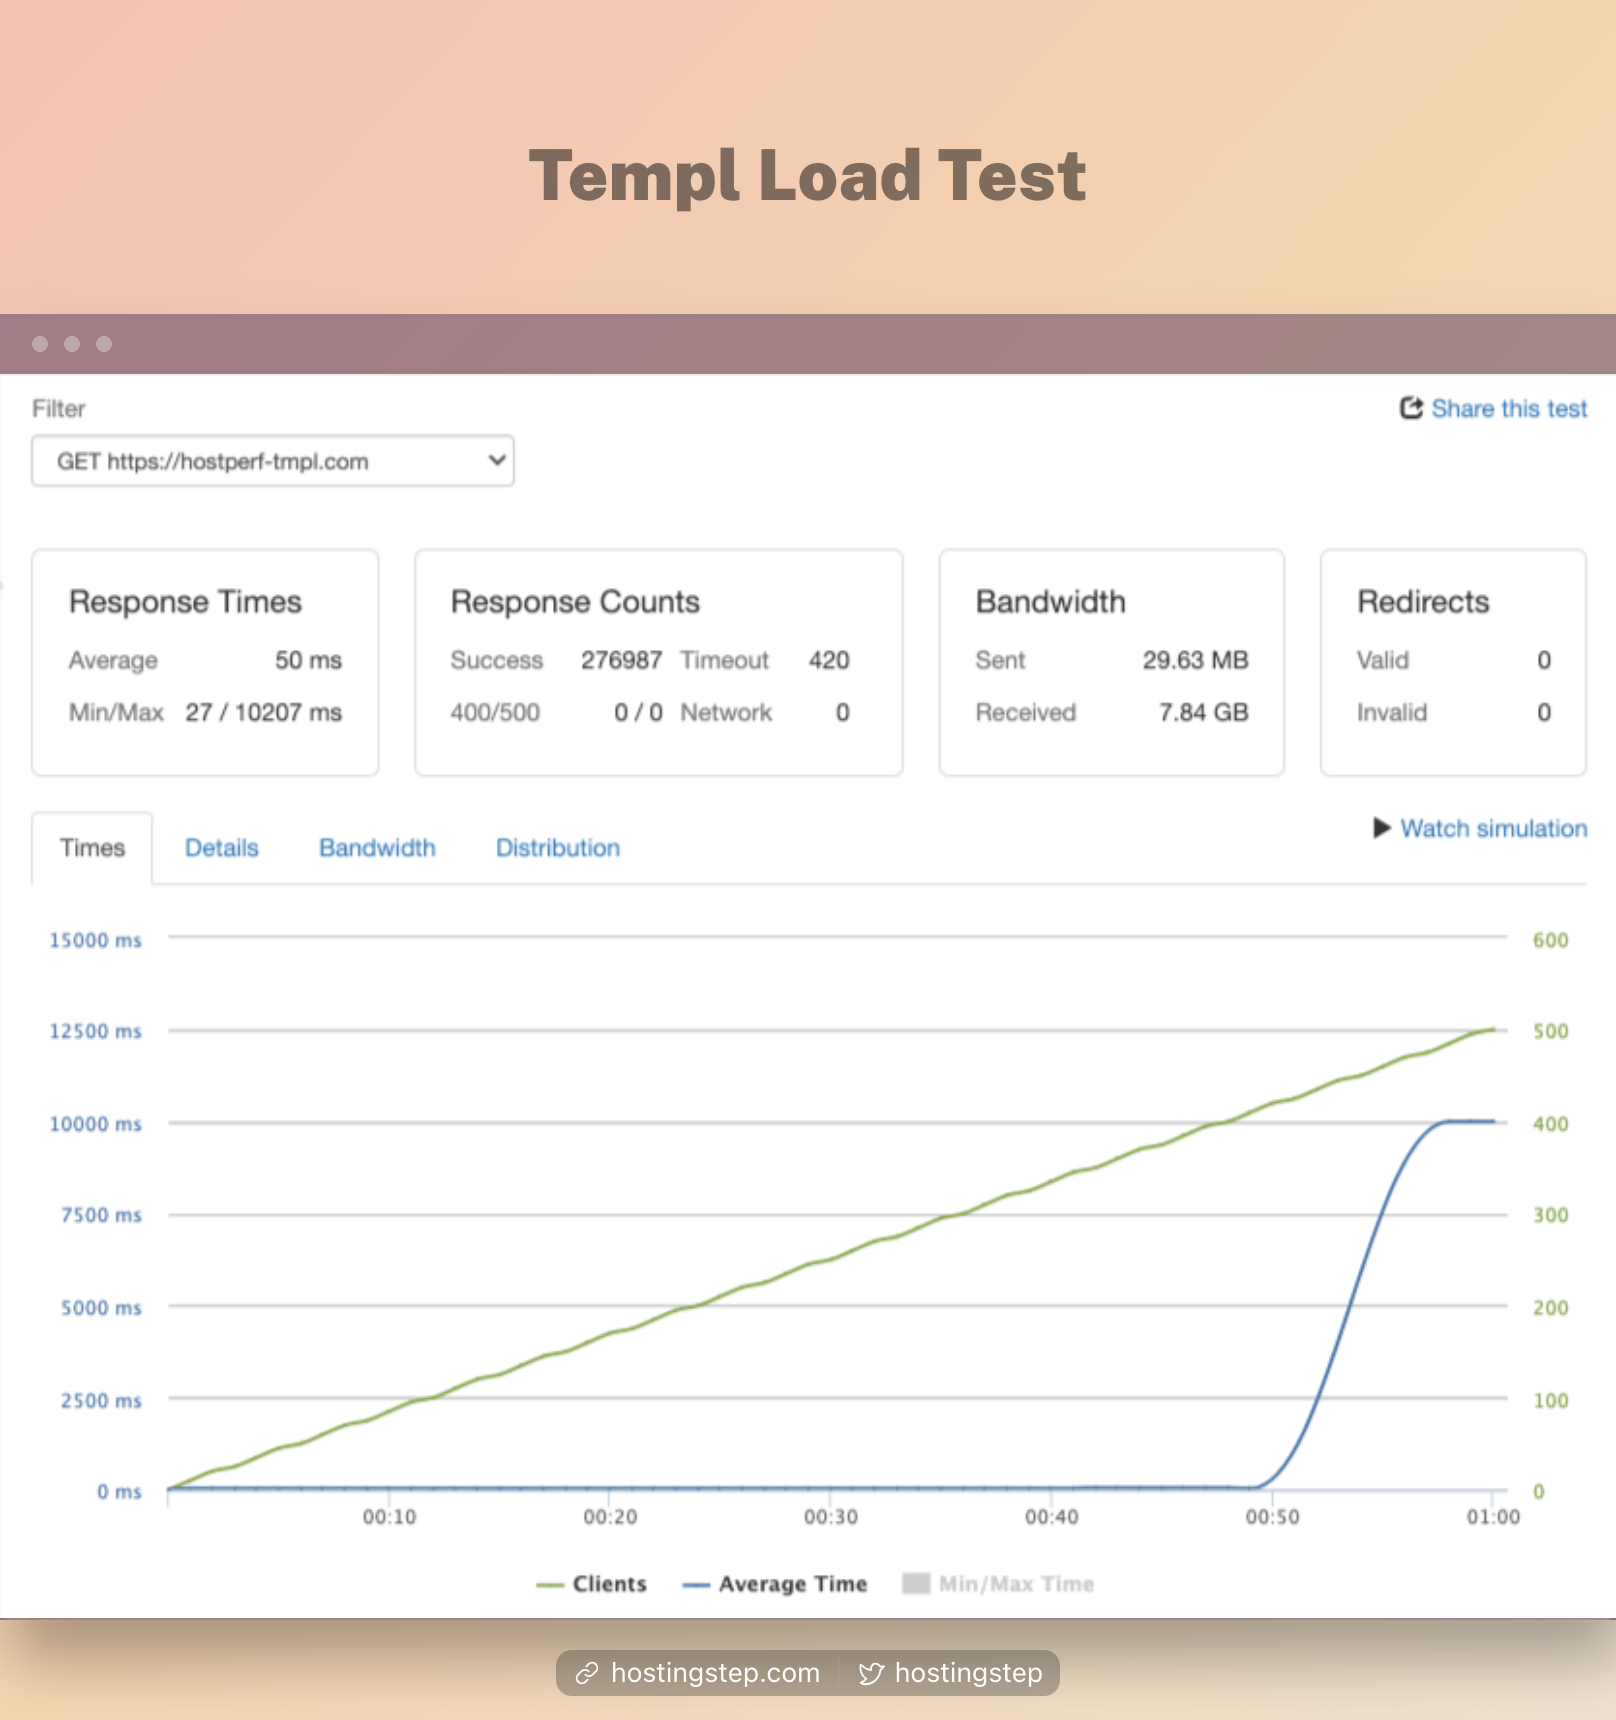
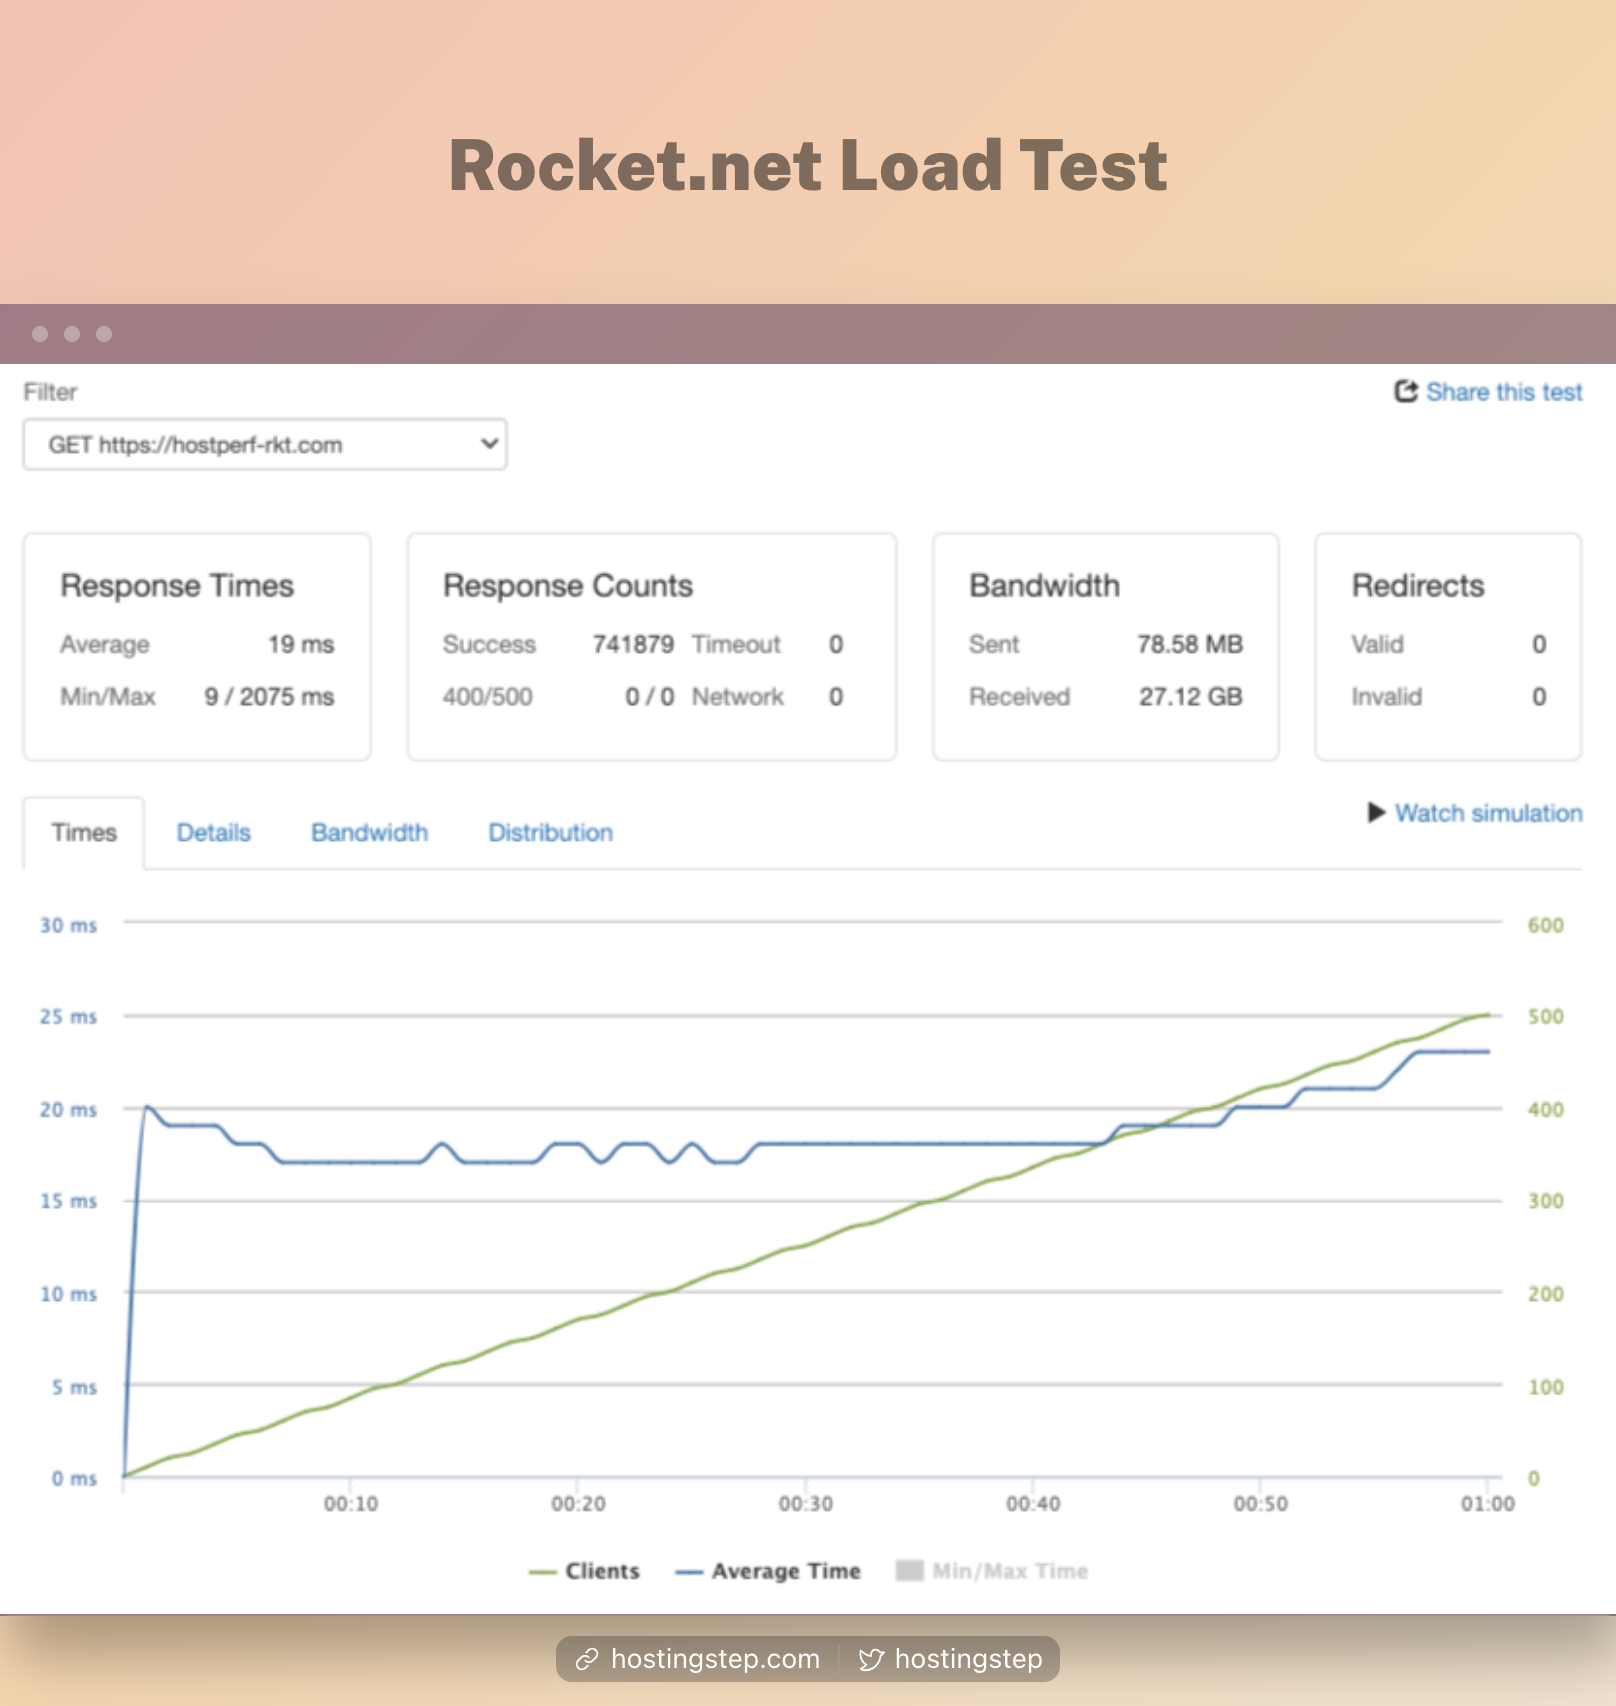
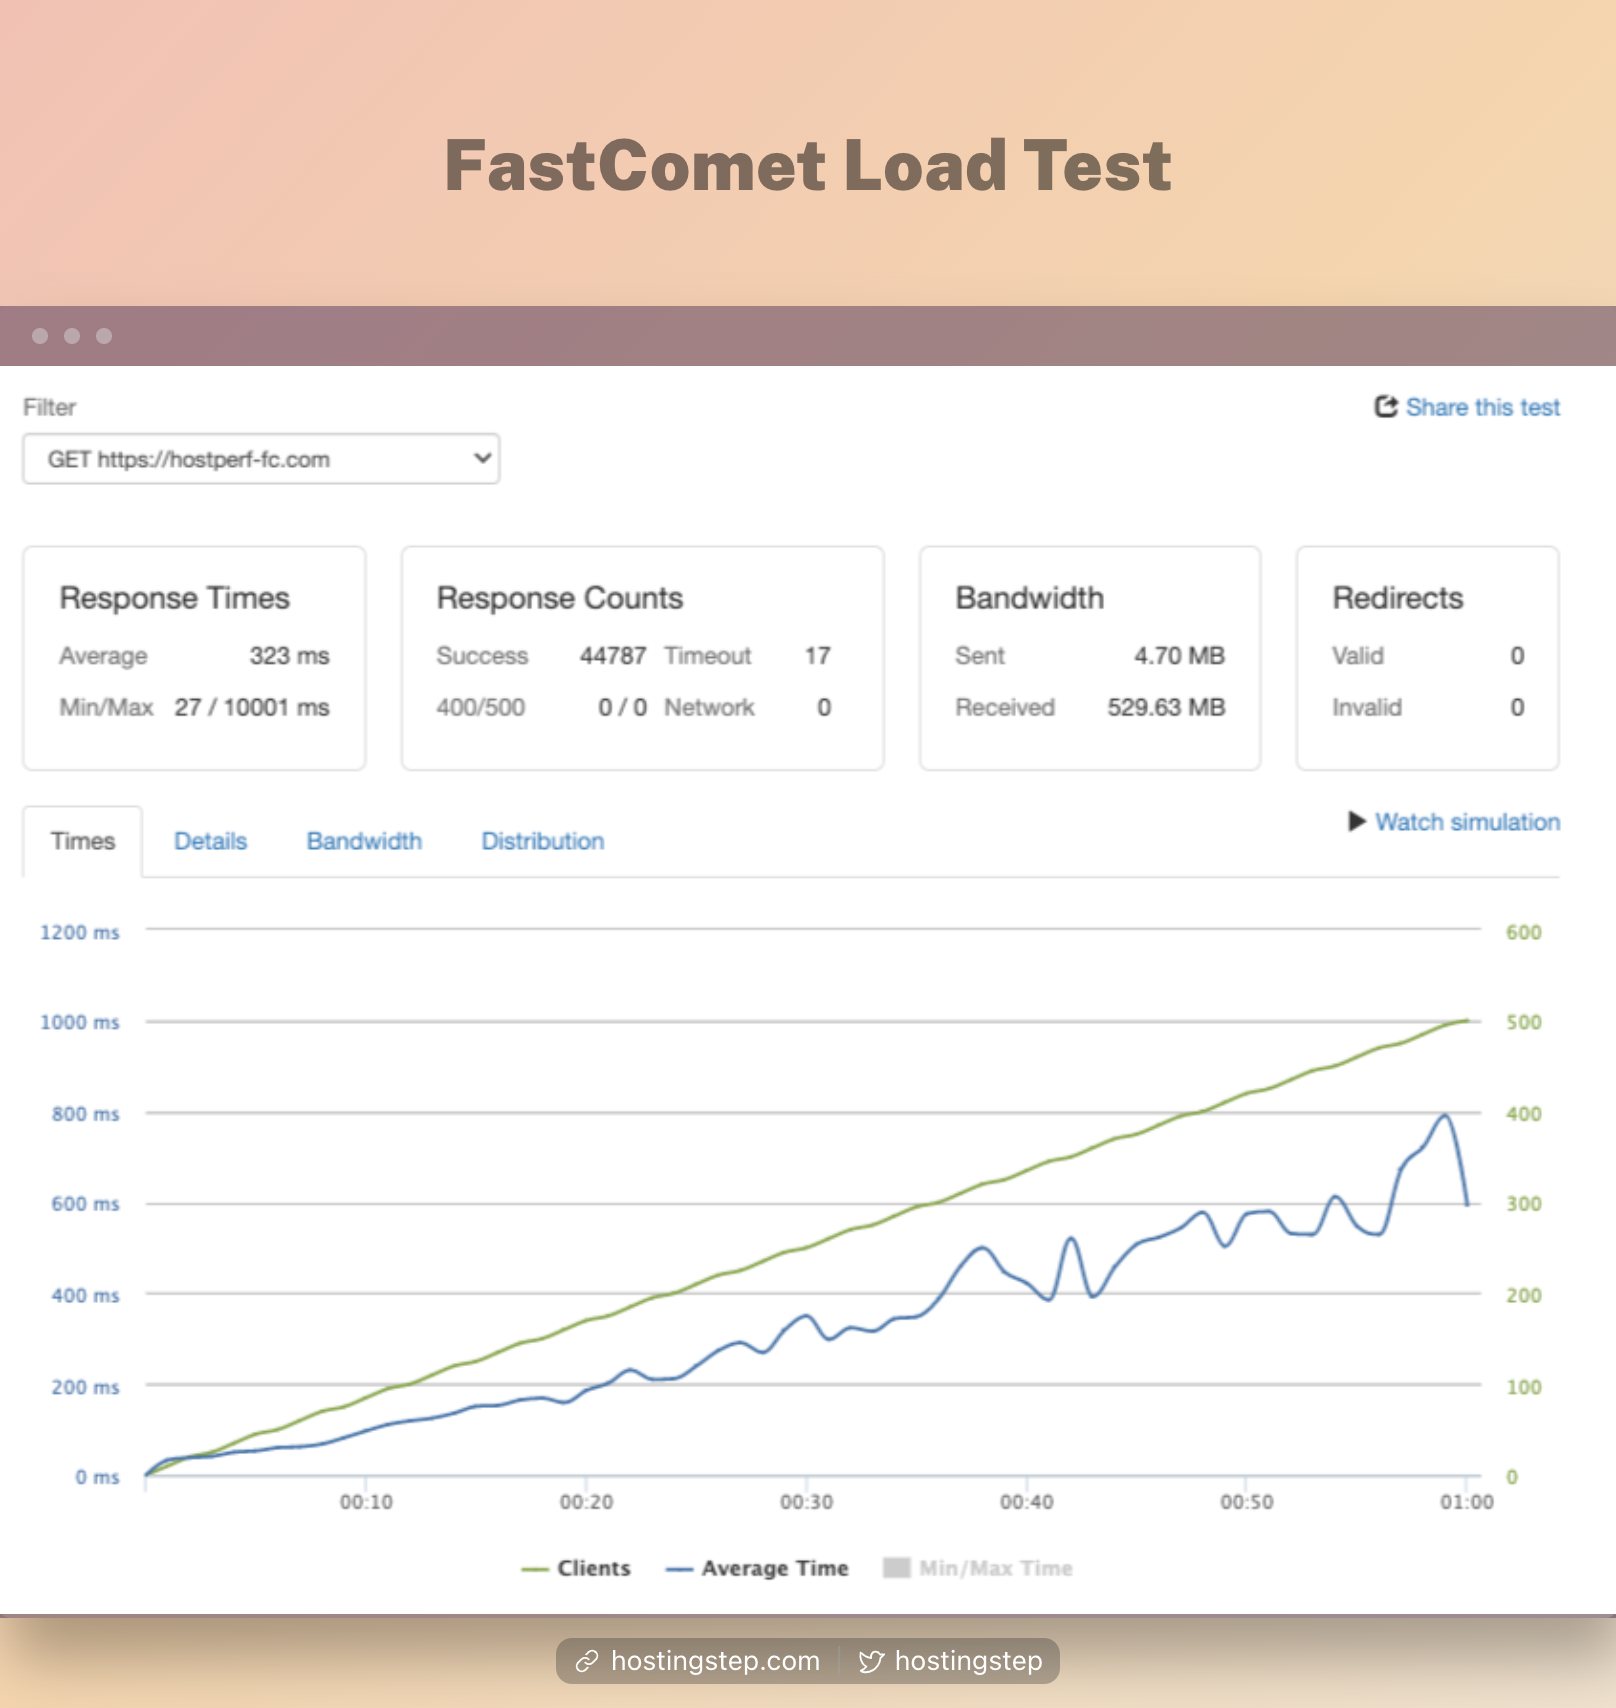
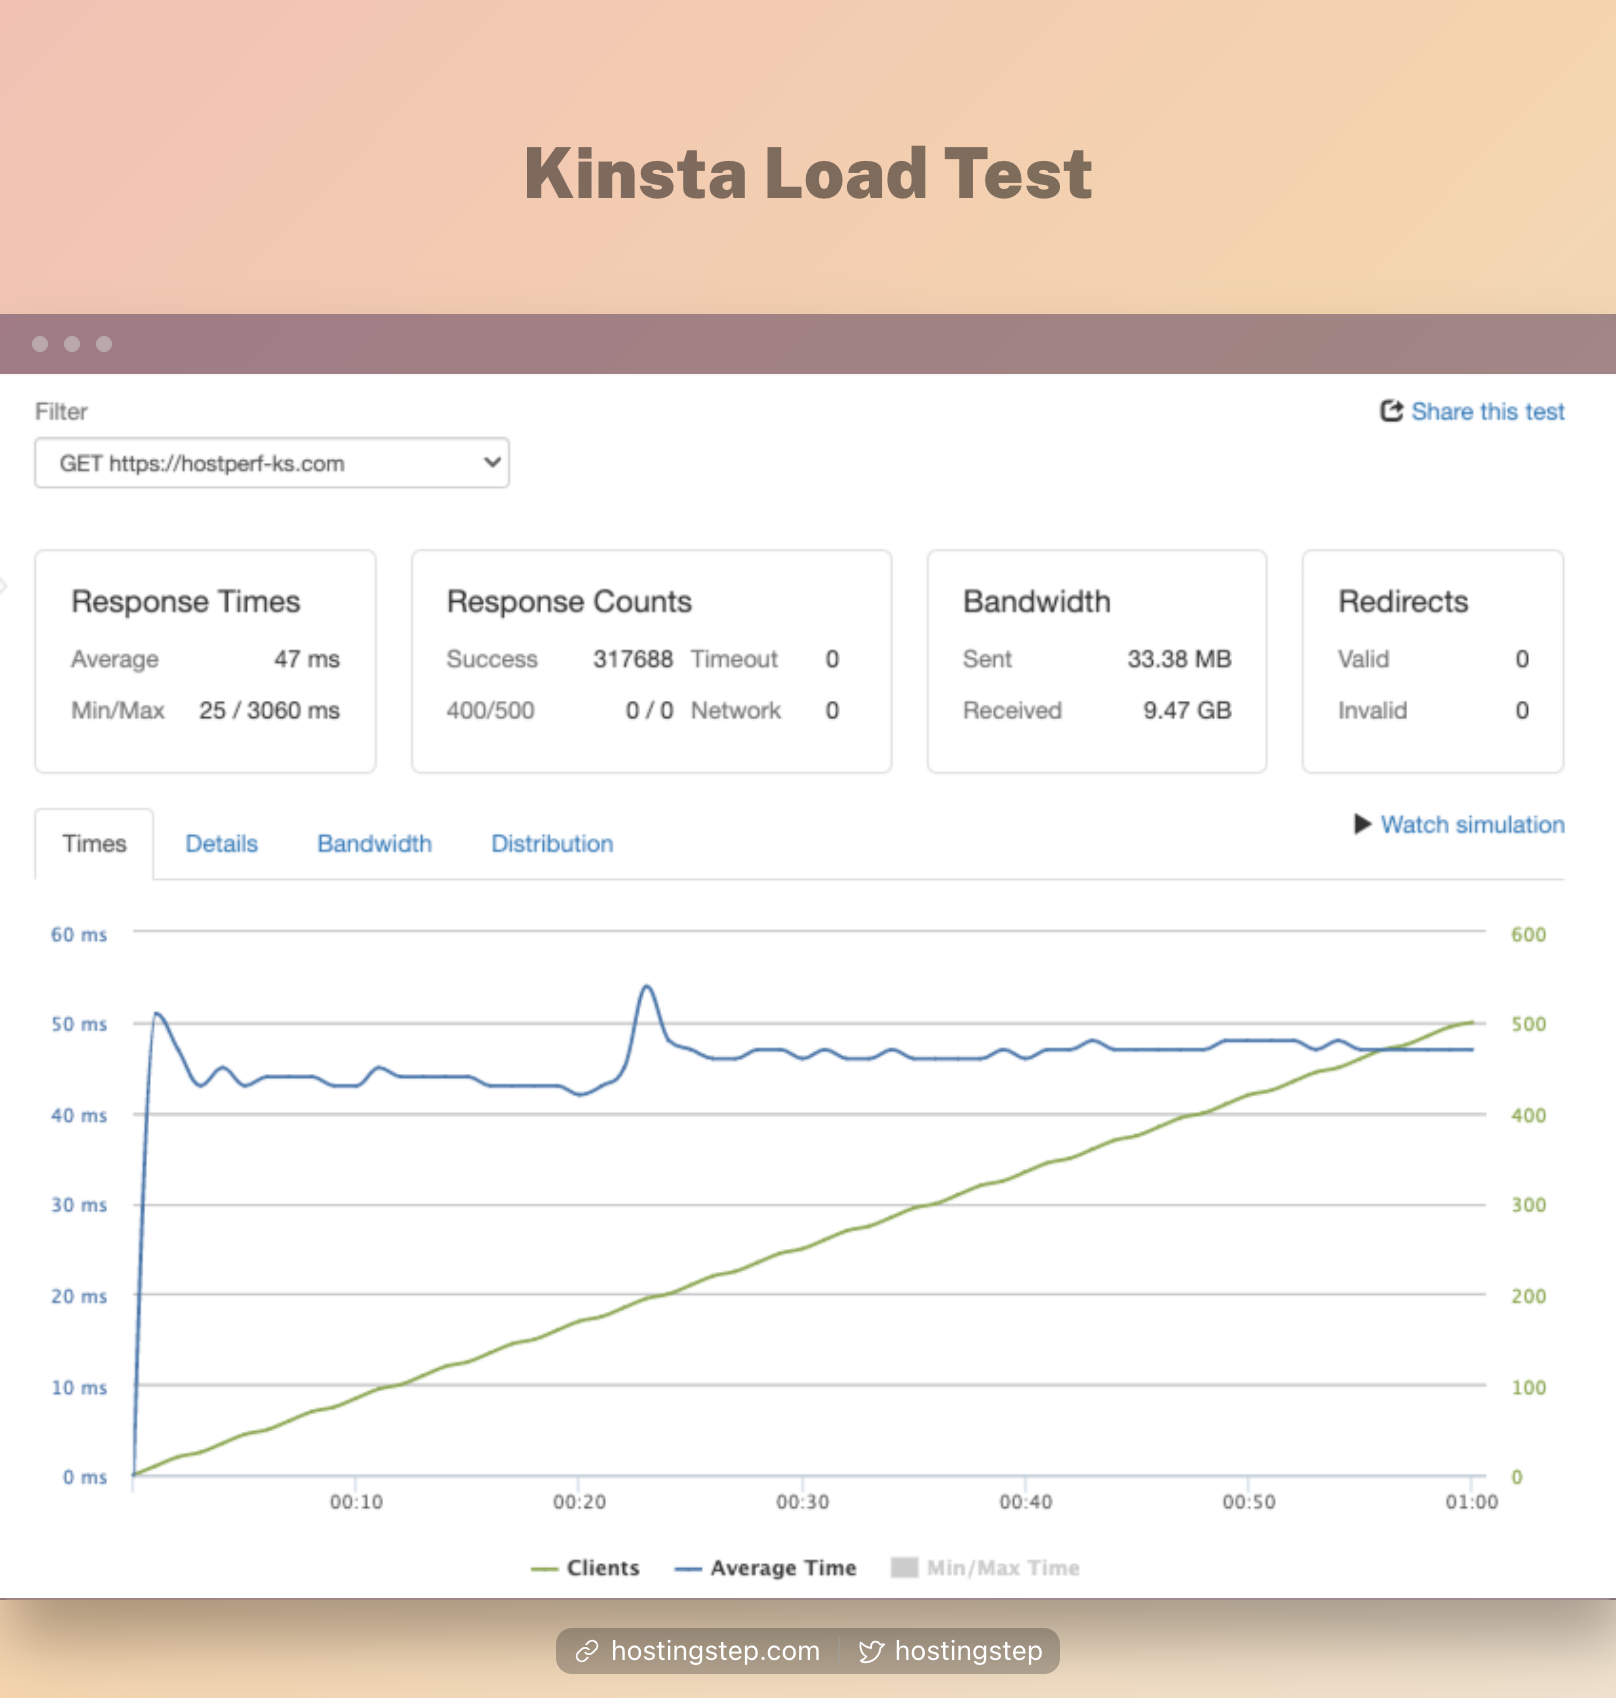
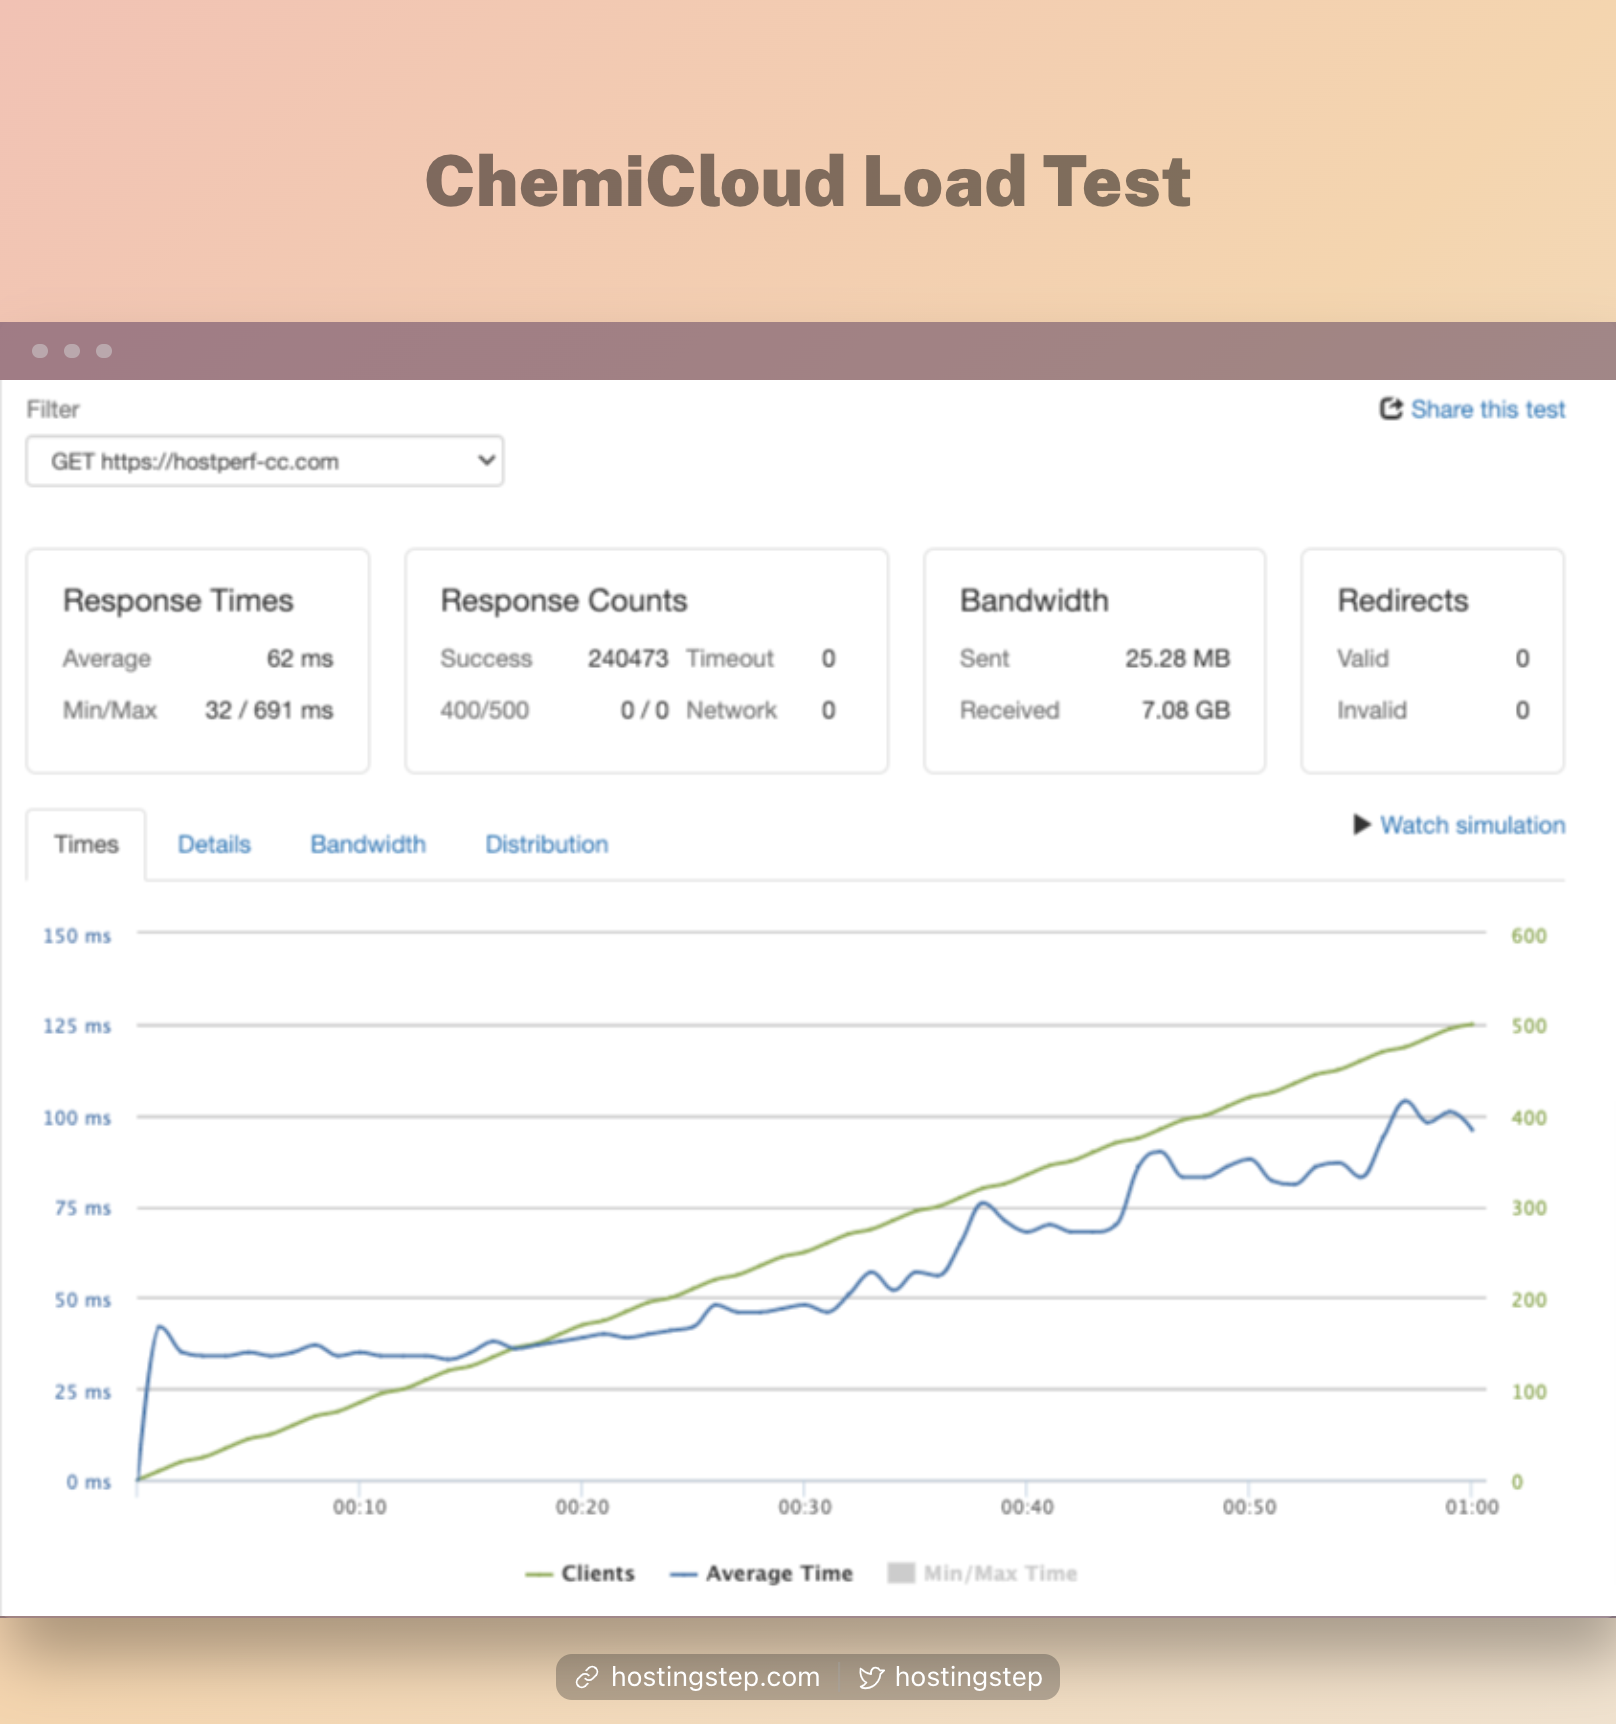
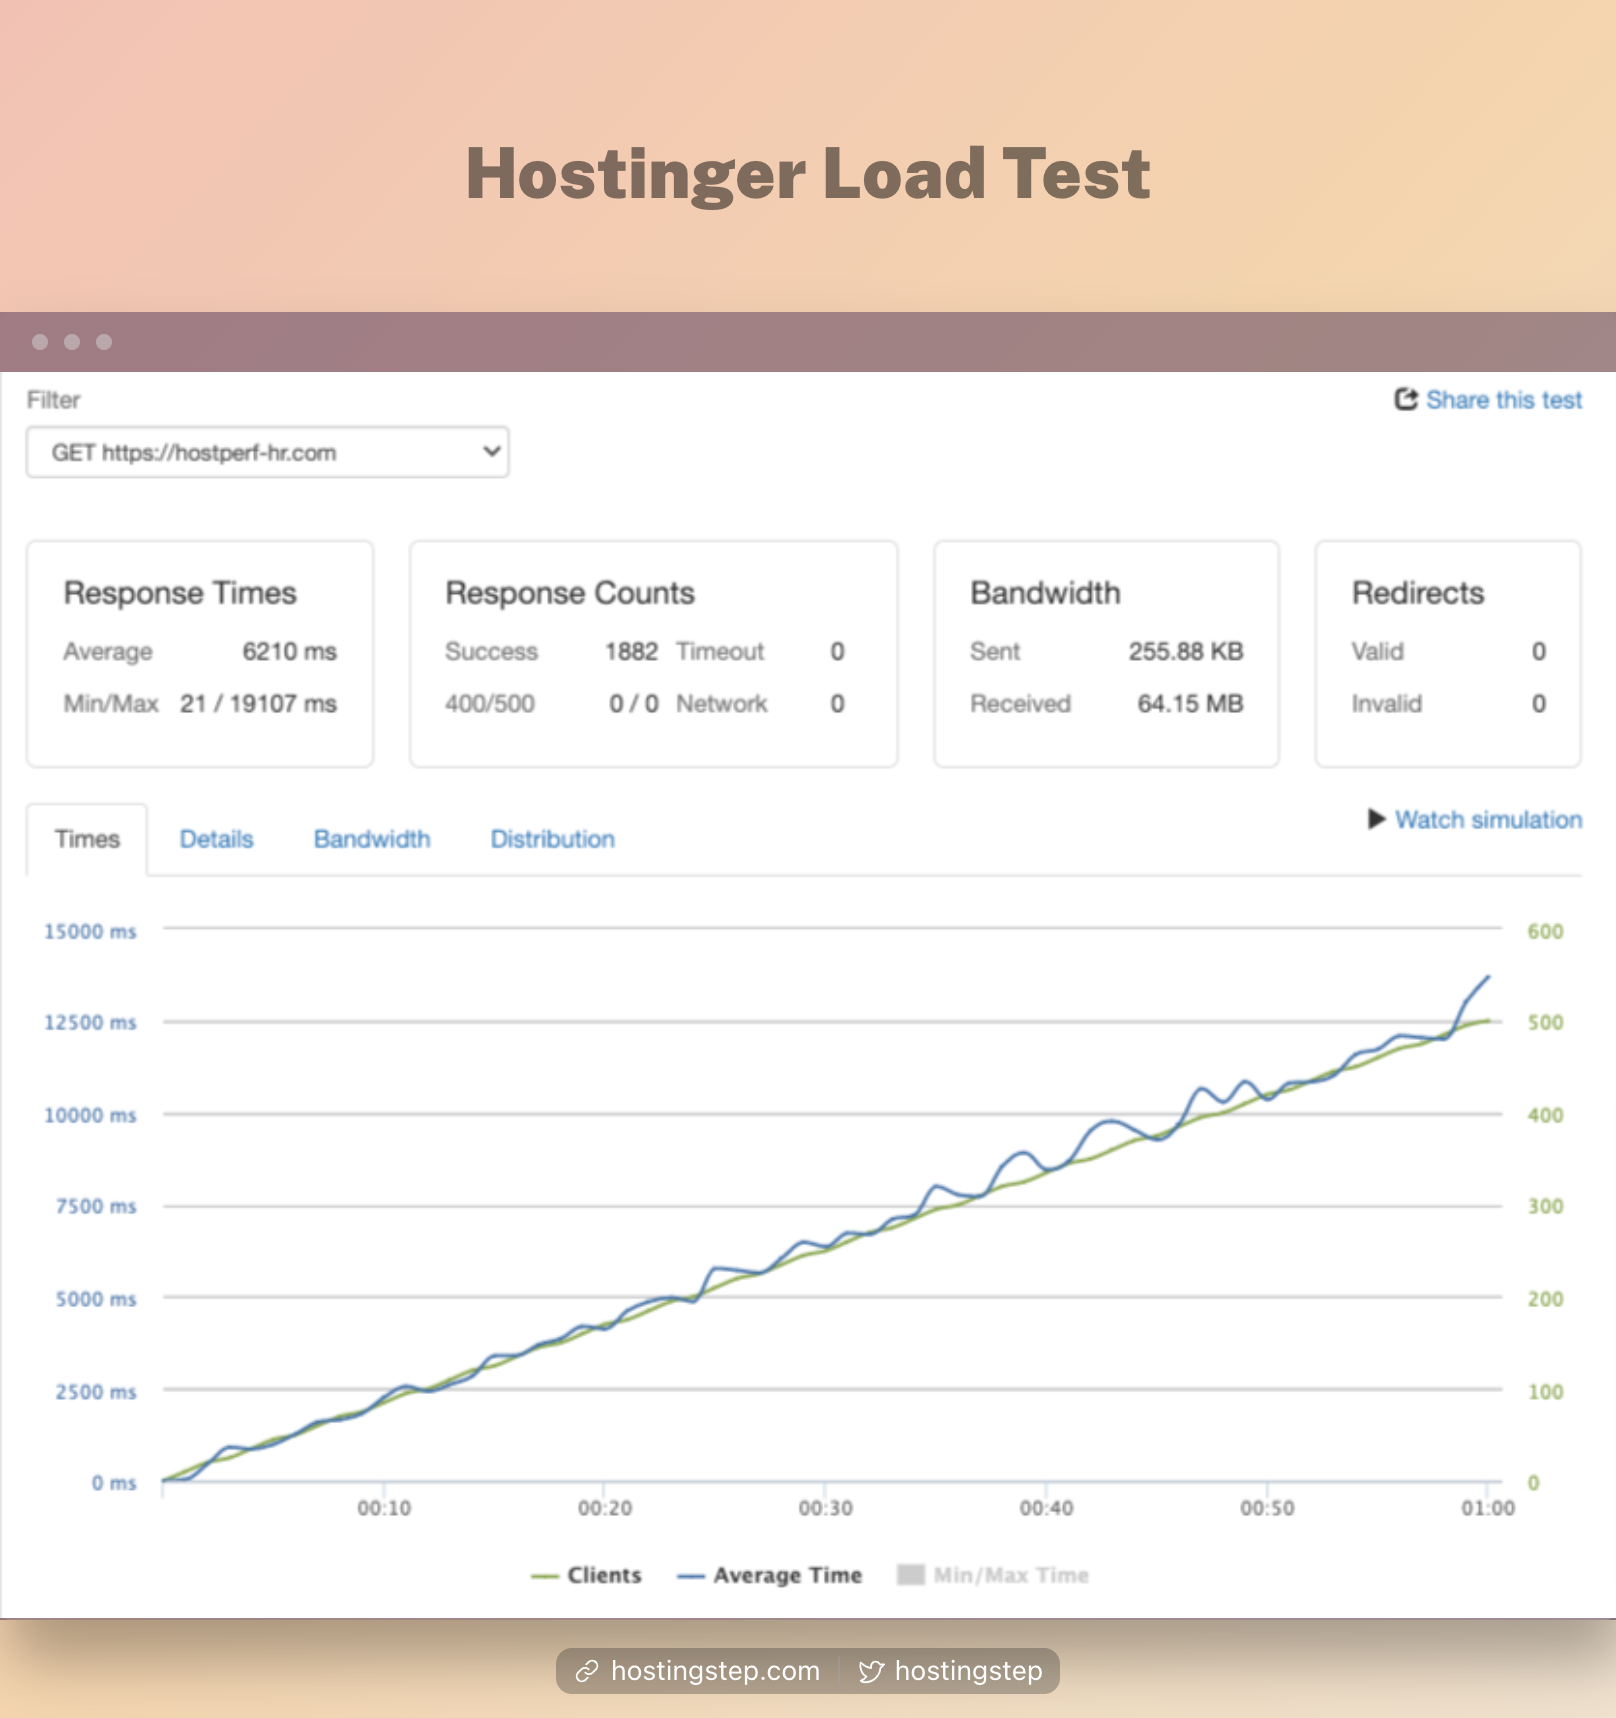
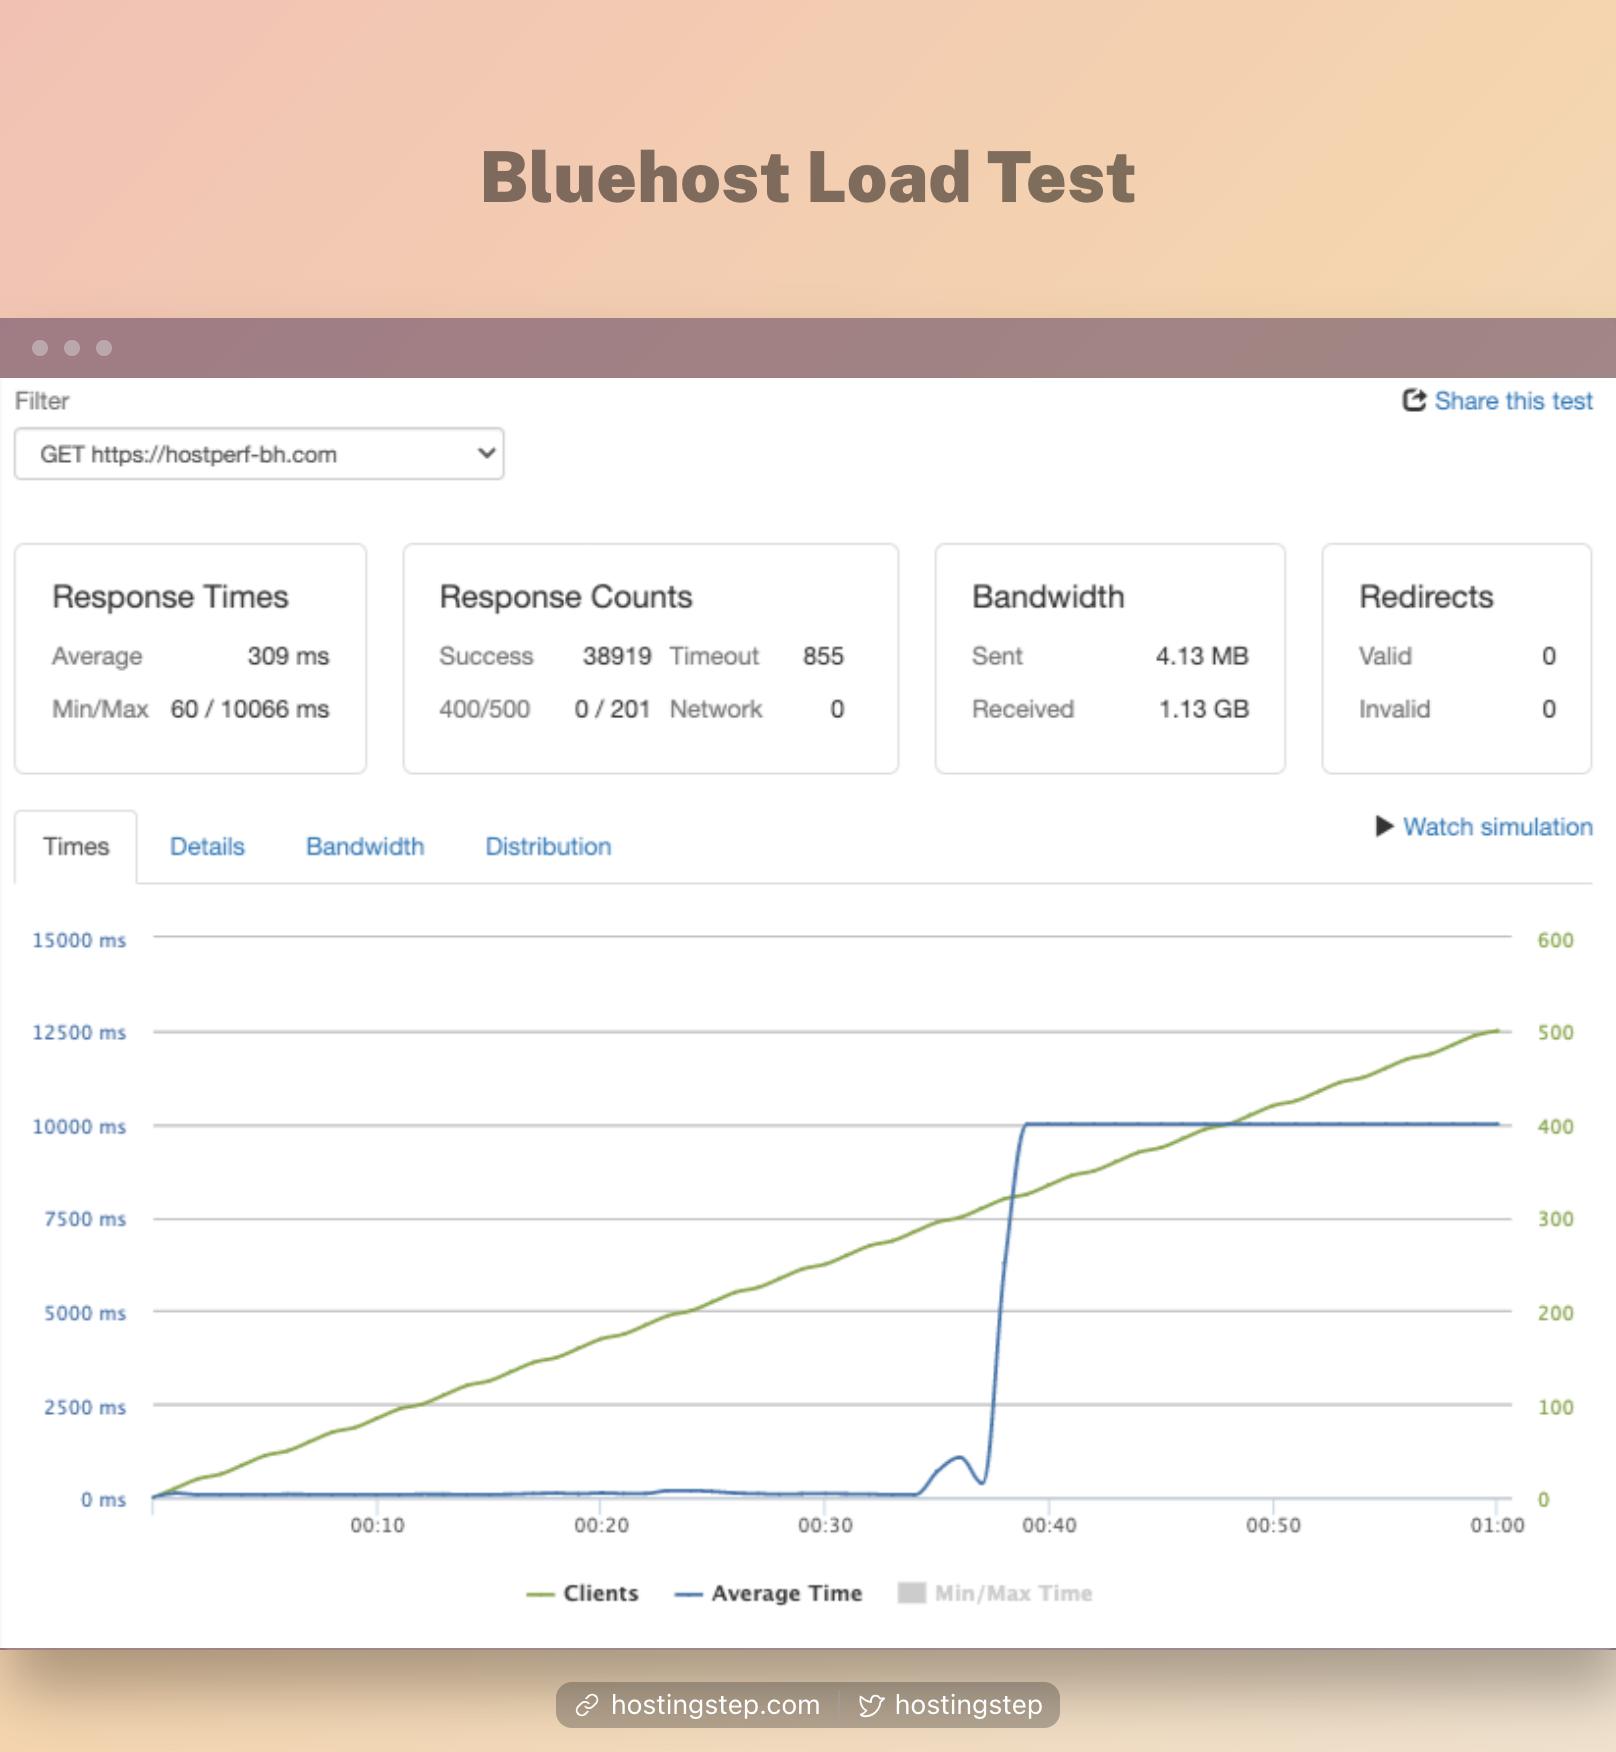
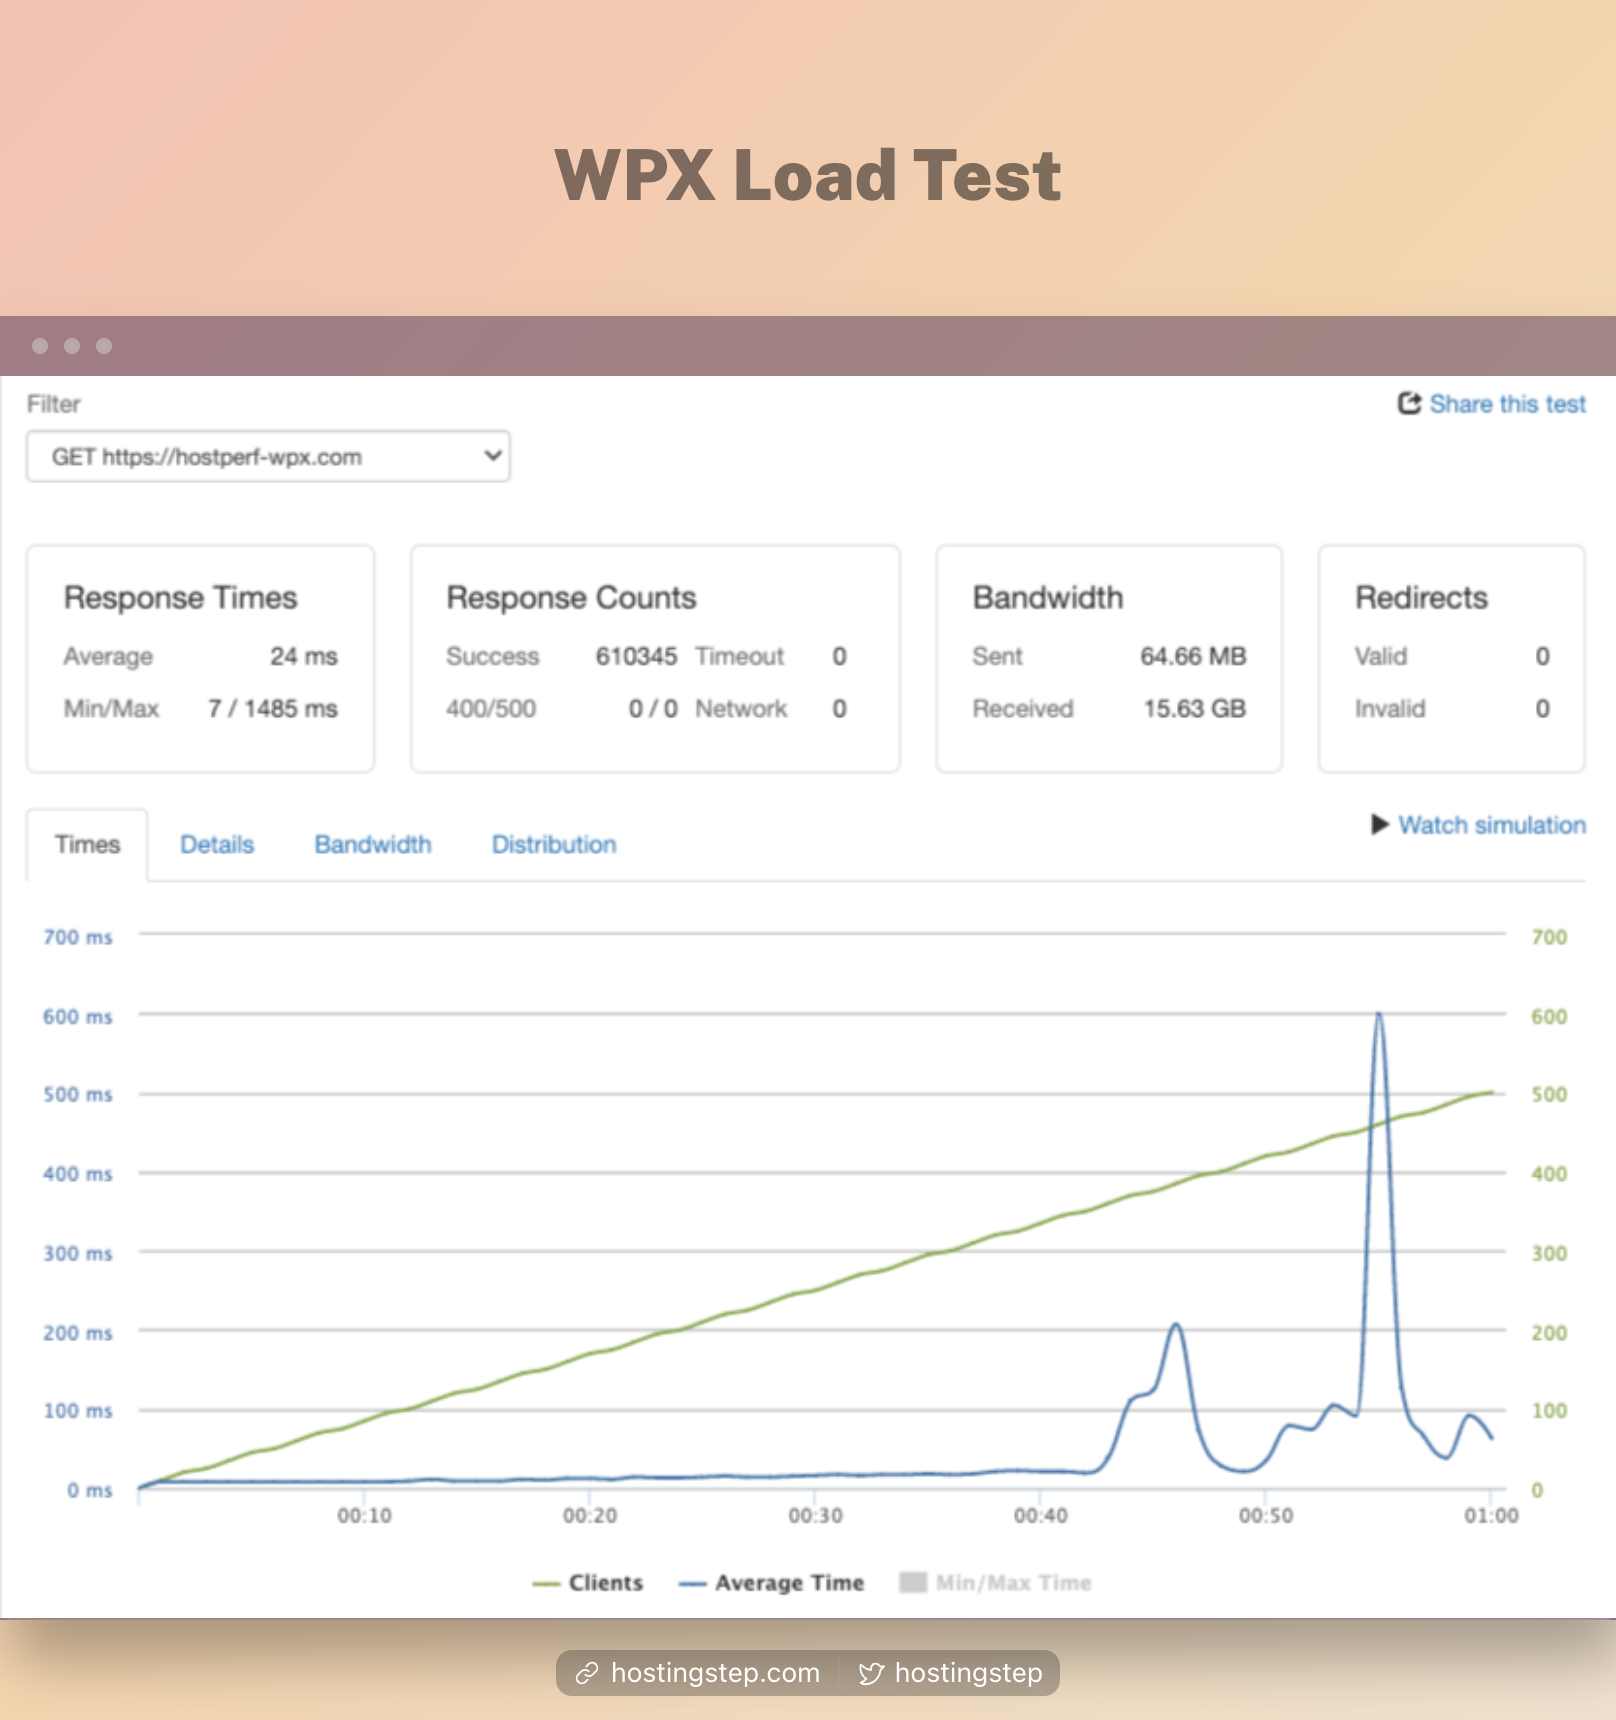
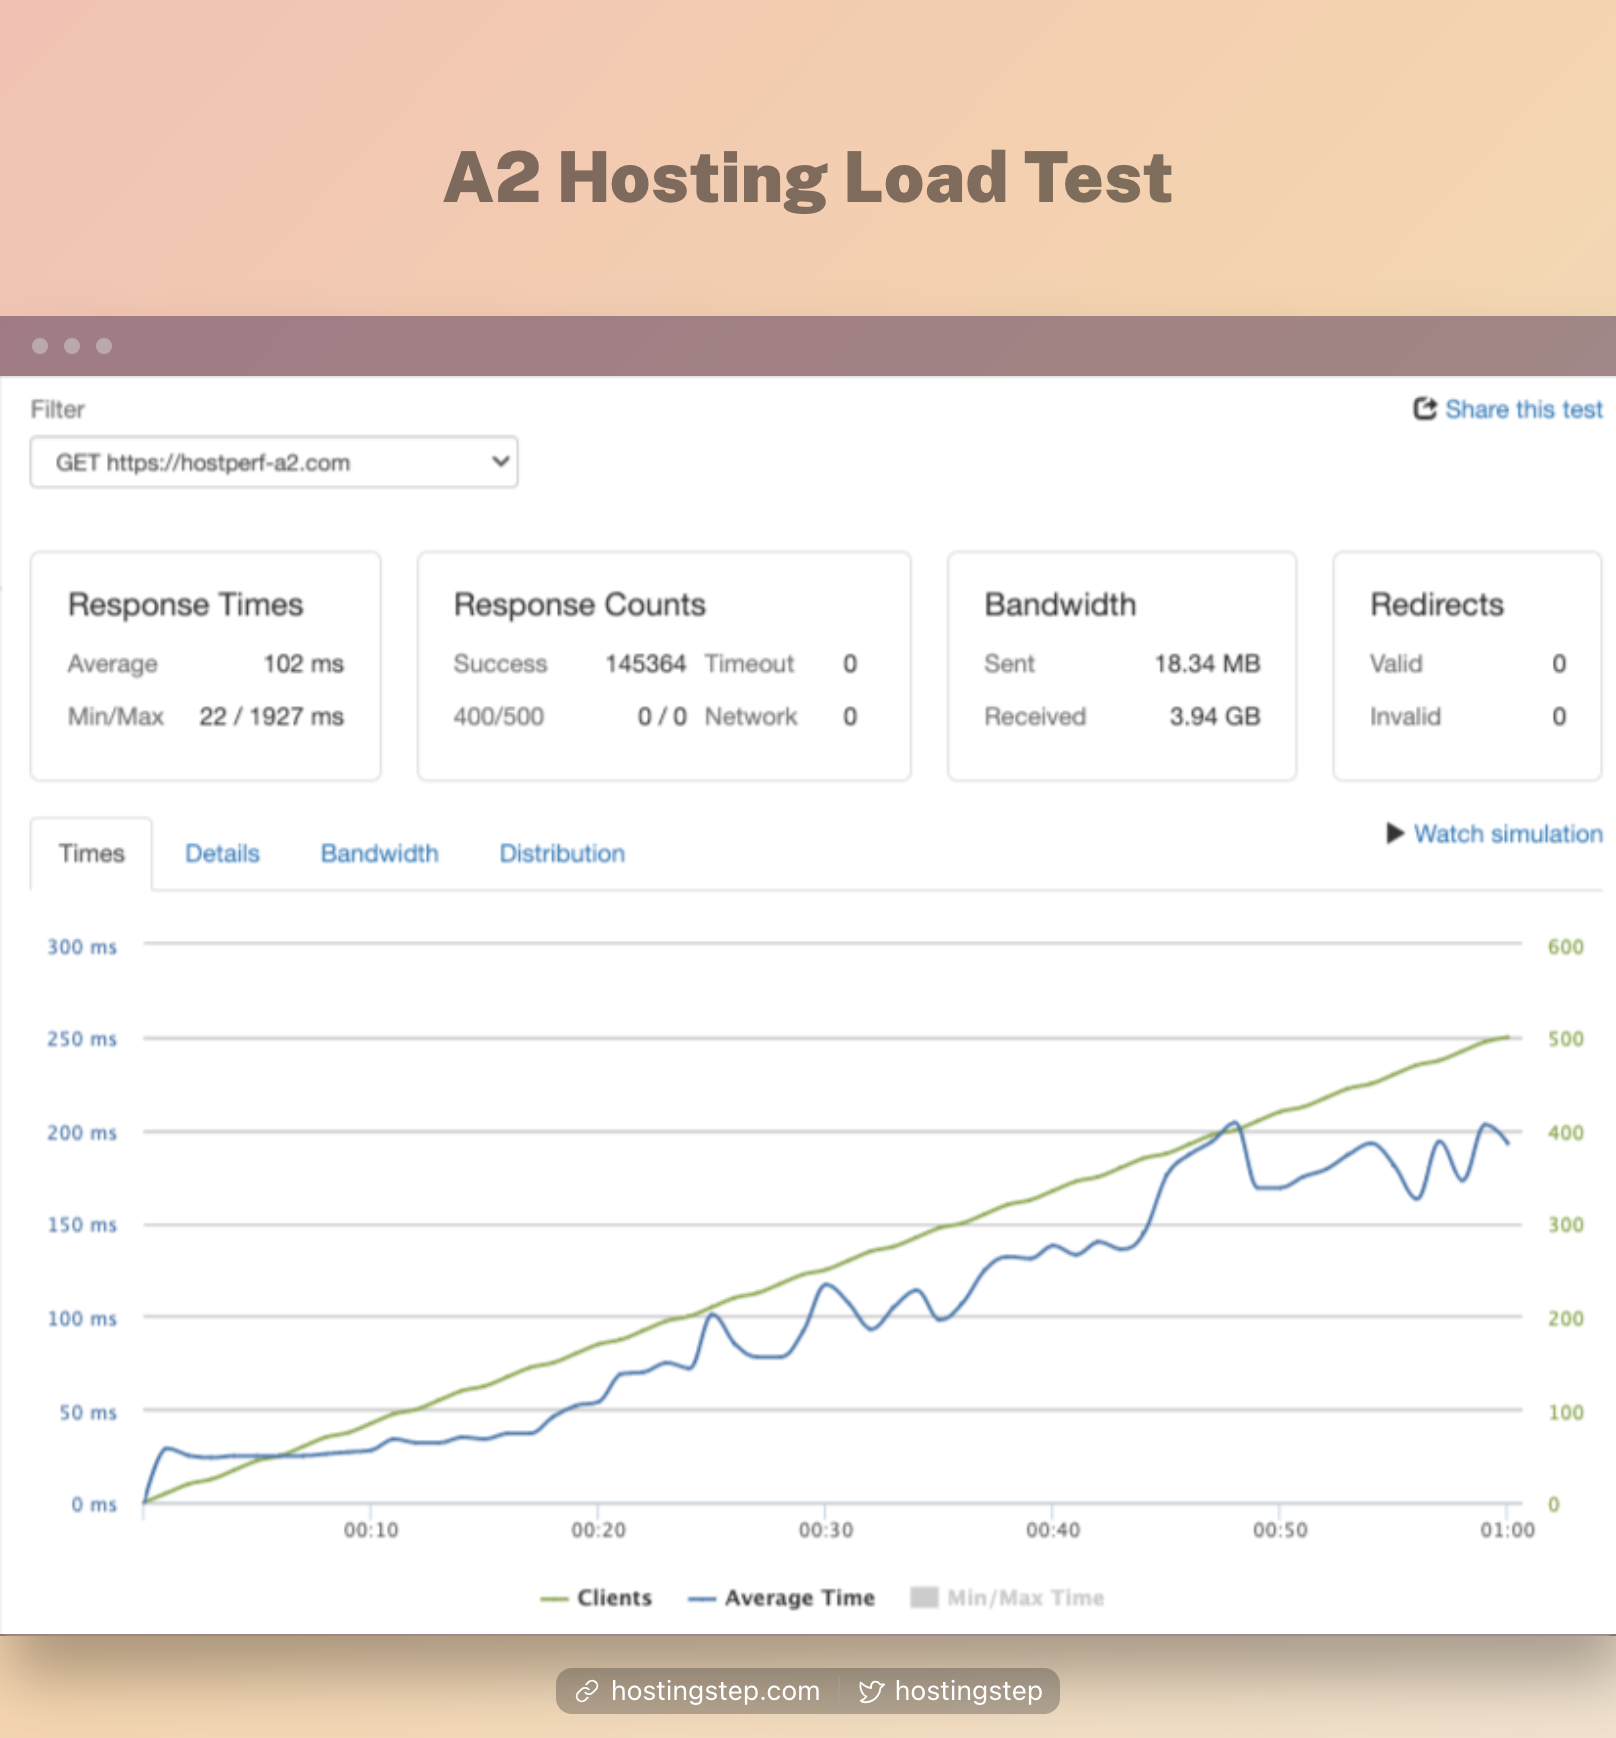
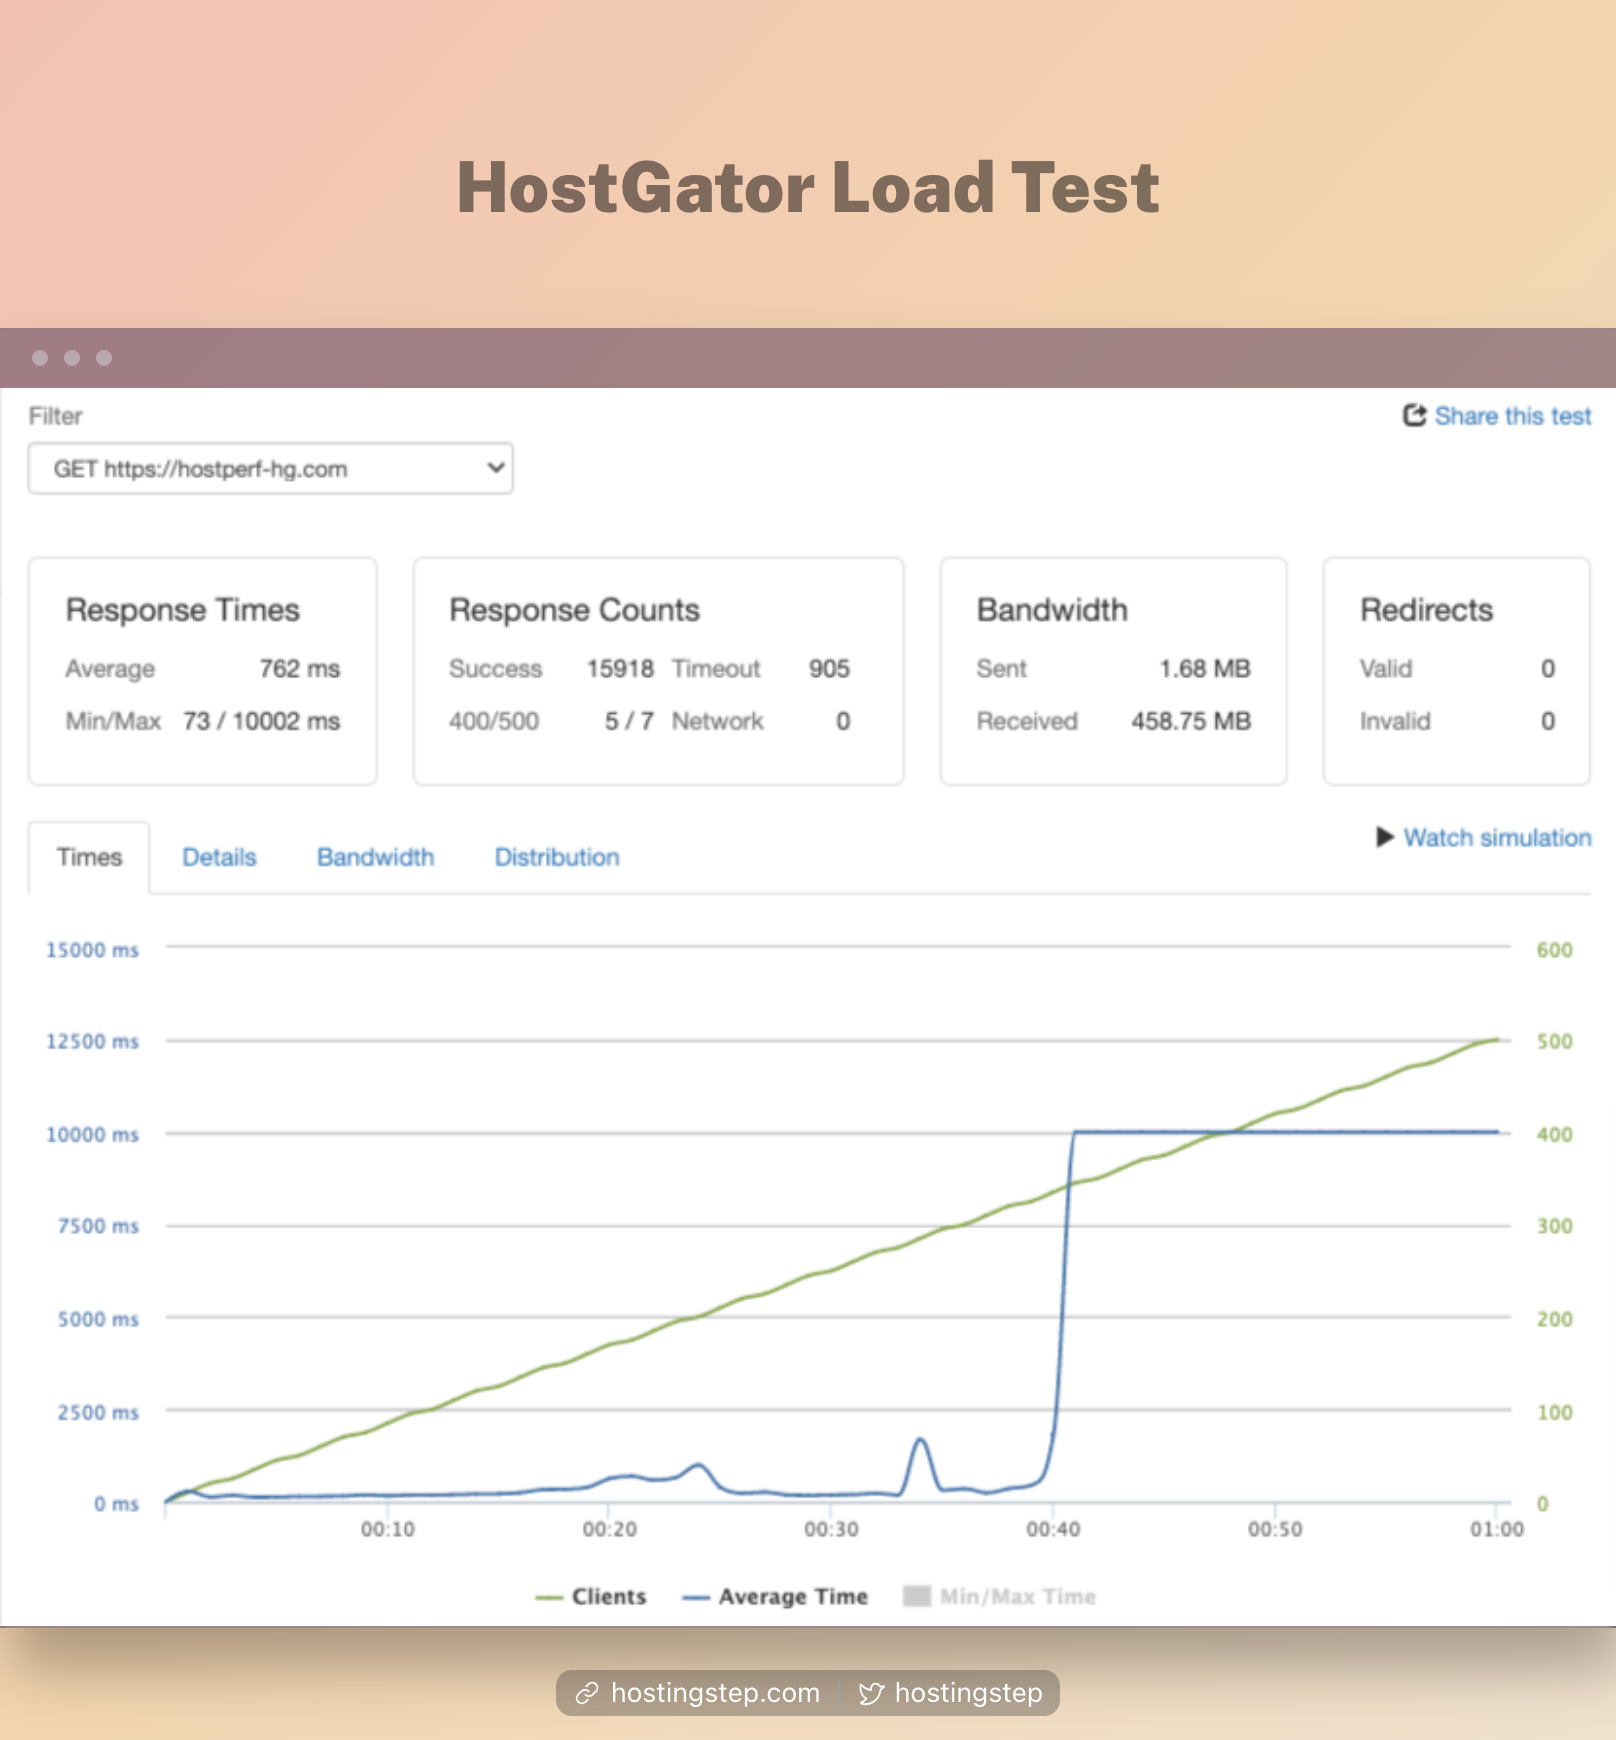
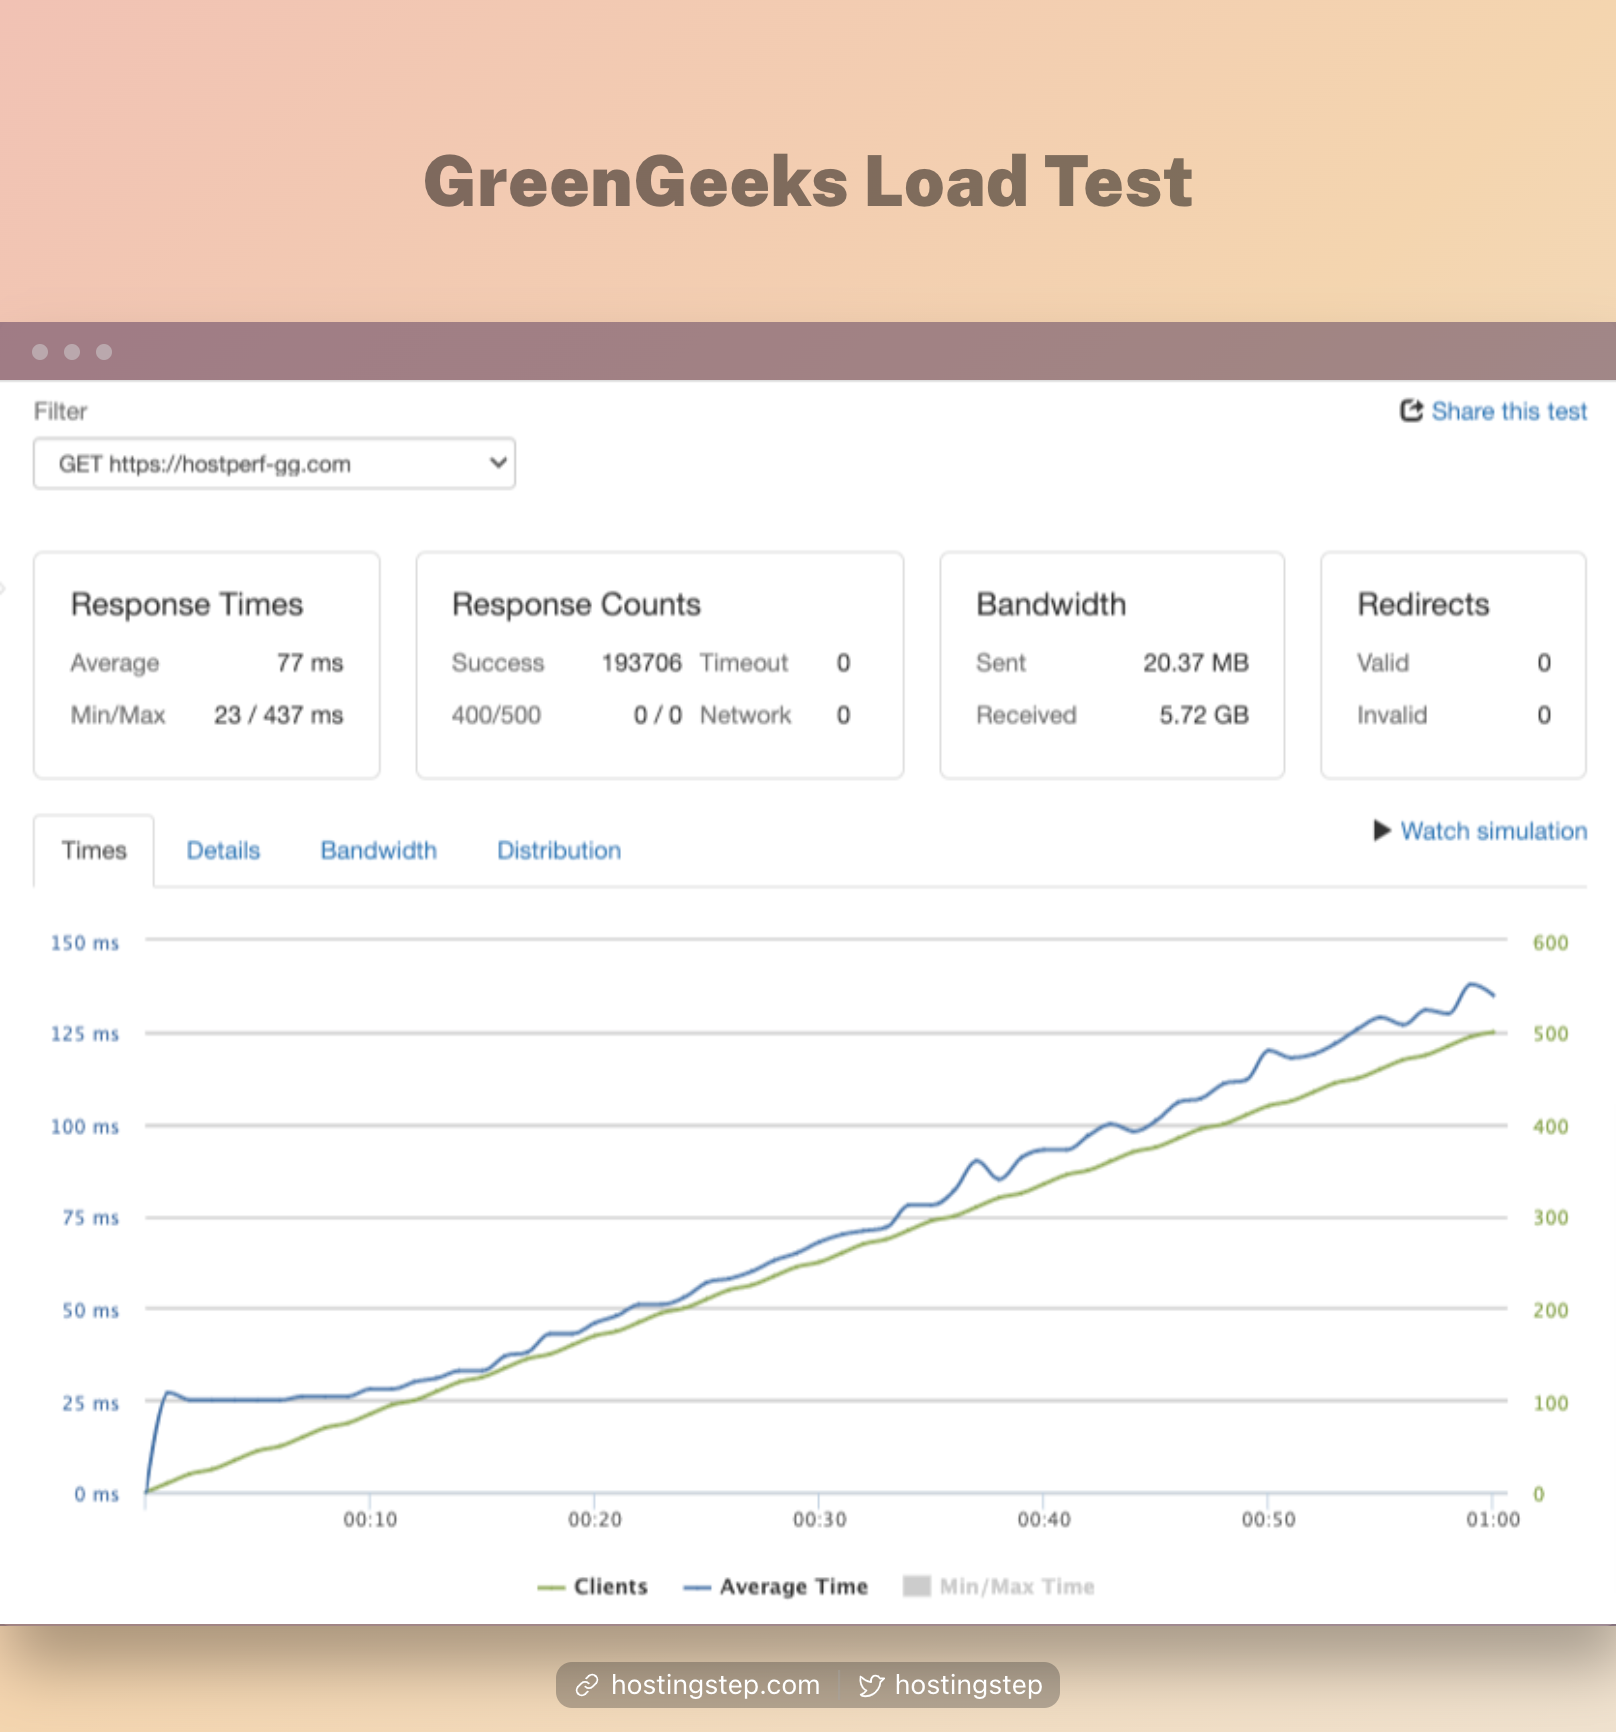
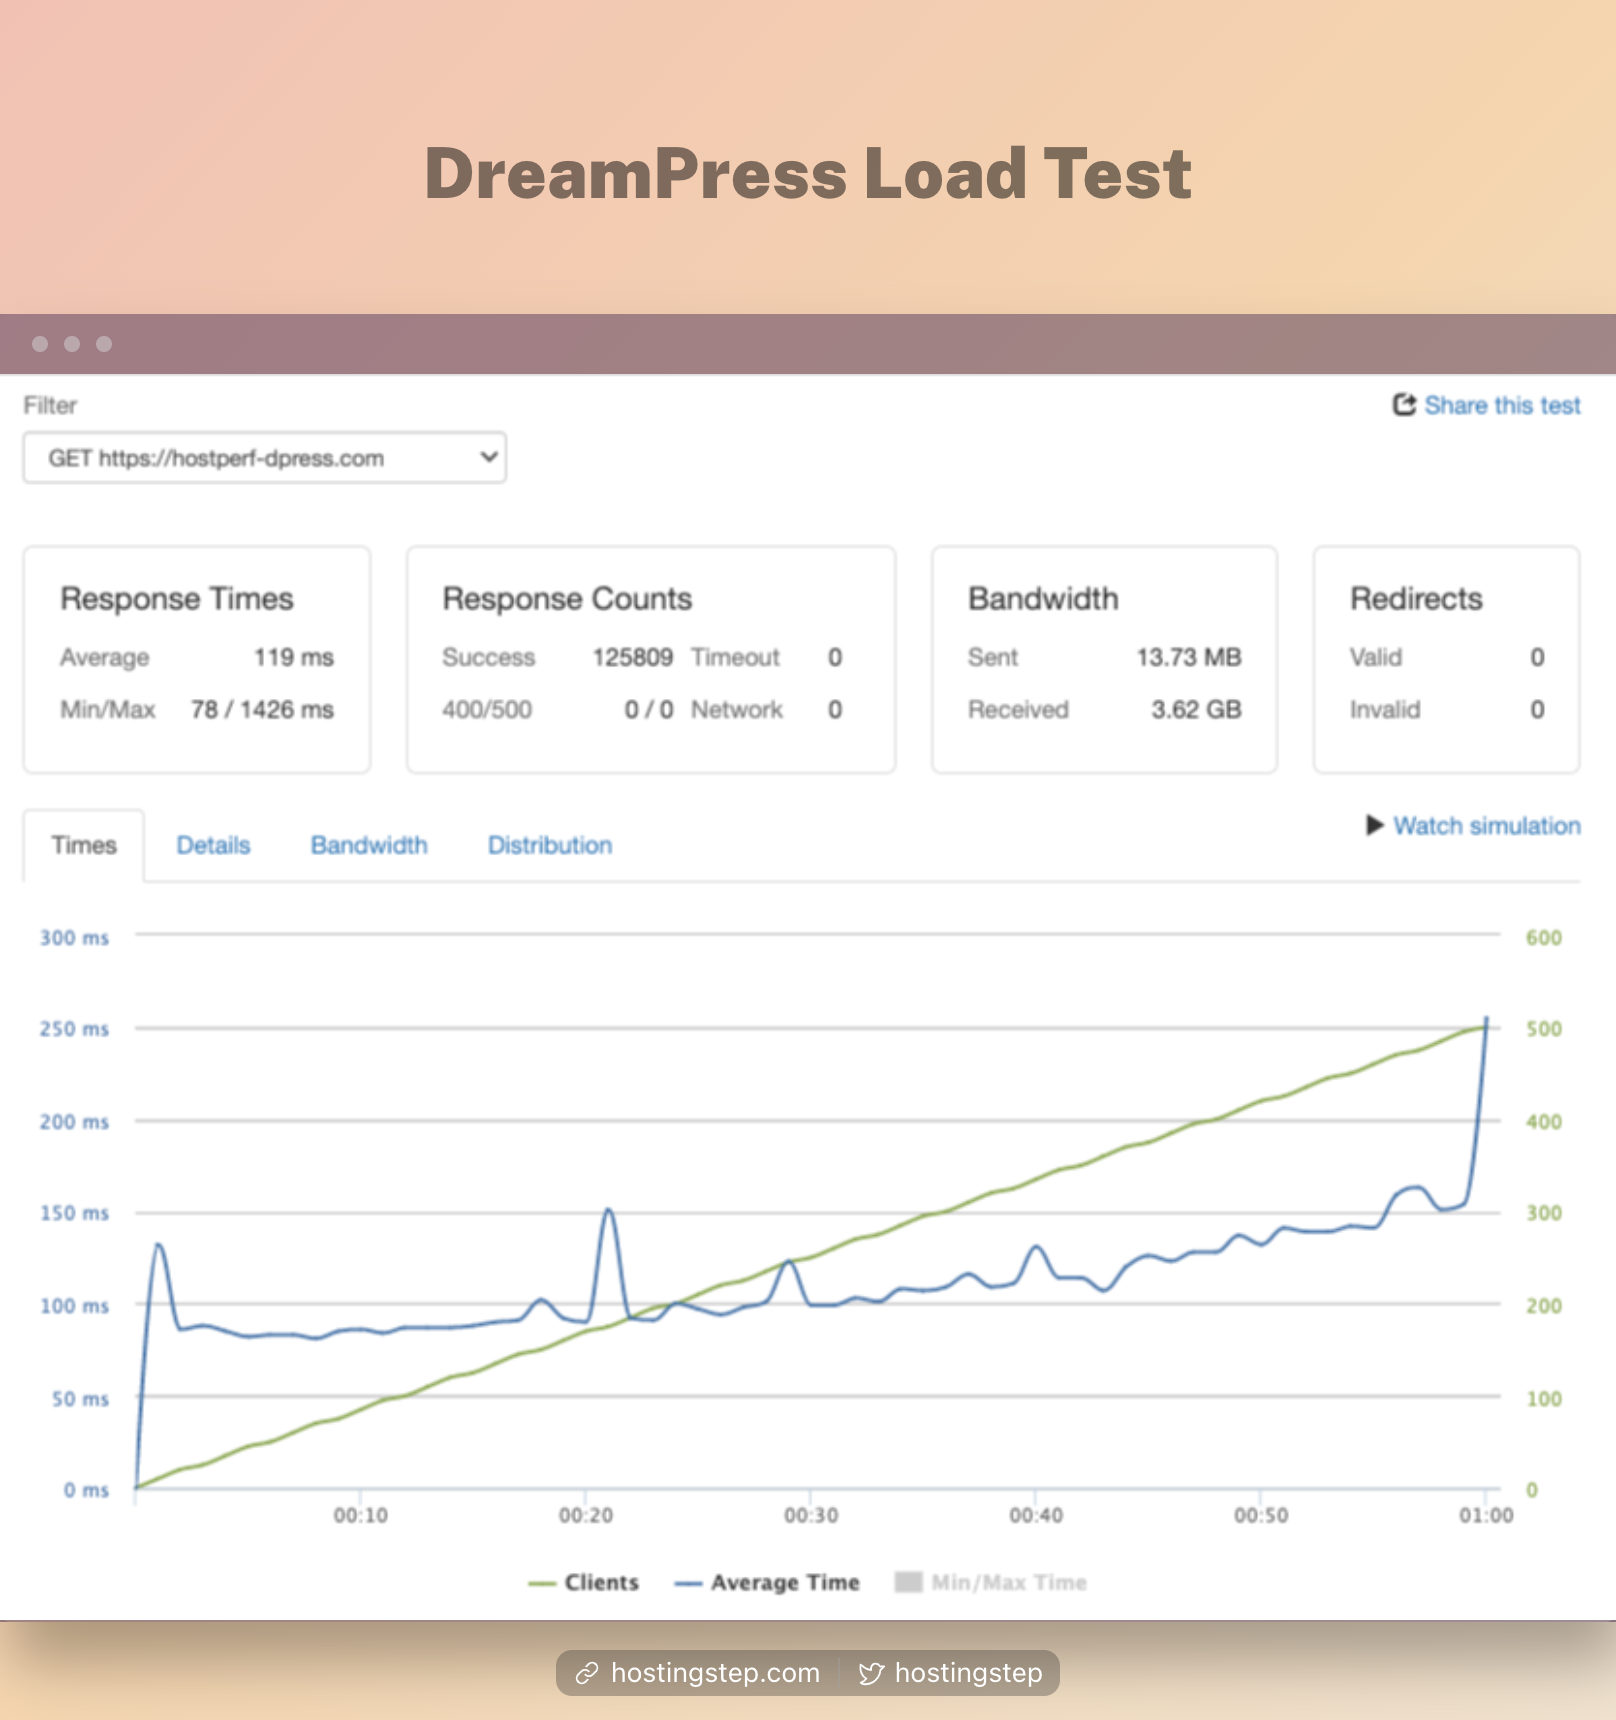
Benchmark Test 3 – Load Testing
WordPress load testing is a process to measure how much traffic the test sites can handle.
In this test, 500 simultaneous visitors are sent to the site, and the average response time is calculated. (lower the response time faster the servers)
Results
| Host | Avg. Response Time (lower is better) | Min. Response Time (lower is better) | Max. Response Time (lower is better) | Response Counts (Higher is better) | Data |
|---|---|---|---|---|---|
| Rocket | 19 ms | 9 ms | 2075 ms | 741879 | Check Data |
| Kinsta | 27 ms | 11 ms | 631 ms | 532636 | Check Data |
| WPX | 32 ms | 8 ms | 424 ms | 464964 | Check Data |
| SiteGround | 179 ms | 28 ms | 2132 ms | 83238 | Check Data |
| A2 Hosting | 185 ms | 22 ms | 1433 ms | 80447 | Check Data |
| FastComet | 190 ms | 31 ms | 2111 ms | 78547 | Check Data |
| GreenGeeks | 200 ms | 20 ms | 1774 ms | 74574 | Check Data |
| Cloudways | 266 ms | 8 ms | 874 ms | 56069 | Check Data |
| Templ | 294 ms | 30 ms | 4531 ms | 49348 | Check Data |
| Nexcess | 296 ms | 39 ms | 5115 ms | 49195 | Check Data |
| Bluehost | 438 ms | 60 ms | 10002 ms | 26966 | Check Data |
| DreamPress | 447 ms | 76 ms | 1217 ms | 33277 | Check Data |
| HostGator | 800 ms | 69 ms | 10002 ms | 15056 | Check Data |
| ChemiCloud | 963 ms | 29 ms | 11108 ms | 13592 | Check Data |
| Hostinger | 2412 ms | 20 ms | 6024 ms | 5776 | Check Data |
| WP Engine (Incomplete) | 71 ms | 47 ms | 489 ms | 1307 | Check Data |
Load Testing – Clients Per Test (500 clients):
Rocket (19ms), WPX (24ms), Kinsta (47ms), ChemiCloud (62ms), and GreenGeeks(77ms) secured the top positions in WordPress load testing.

Benchmark Test 4 – Core Web Vitals
Core Web Vitals is the new performance metric developed by Google.
The test sites are tested using GTmetrix, and the Core Web Vitals metrics like Largest Contentful Paint and Cumulative Layout Shift are calculated in this test.
The First Input Delay is field data; hence, it can’t be measured in tools. However, Google recommends considering Total Blocking Time as a proxy measurement; therefore, I include Total Blocking Time in the report.
Results
| Host | LCP | TBT | CLS |
|---|---|---|---|
| GreenGeeks | 389 ms | 0ms | 0.07 |
| Templ | 429 ms | 0 ms | 0.07 |
| A2 Hosting | 458 ms | 0 ms | 0.07 |
| Bluehost | 461 ms | 0 ms | 0.07 |
| Kinsta | 462 ms | 0 ms | 0.07 |
| Nexcess | 478 ms | 0 ms | 0.07 |
| WP Engine | 500 ms | 0 ms | 0.07 |
| WPX Hosting | 514 ms | 0 ms | 0.07 |
| Rocket.net | 550 ms | 7 ms | 0.05 |
| SiteGround | 572 ms | 0 ms | 0.07 |
| FastComet | 584 ms | 0 ms | 0.07 |
| NameHero | 589 ms | 0 ms | 0.07 |
| Cloudways | 595 ms | 0 ms | 0.07 |
| ChemiCloud | 619 ms | 0 ms | 0.07 |
| Hostinger | 621 ms | 0 ms | 0.07 |
| DreamPress | 629 ms | 0 ms | 0.07 |
| HostGator | 931 ms | 0 ms | 0 |
Takeaway:
Templ, Nexcess, and ChemiCloud are the top performers in this test. However, our test is lab data, and one needs to focus on improving the field data to get a pass in “Core Web Vitals”.
Benchmark Test 5 – Global TTFB Test
The site is tested from 35 global locations to measure the server response time (TTFB). If your site has global visitors, watch these results.
Results
Based on the data, Rocket (227ms), Templ (405ms), Cloudways (437ms), Kinsta (449ms), and WPX (462ms) are the top WordPress hosts with the fastest global TTFB.
| Hosting | Global TTFB |
|---|---|
| Rocket.net | 191 ms |
| Templ.io | 243 ms |
| Cloudways | 445 ms |
| GreenGeeks | 528 ms |
| A2 Hosting | 552 ms |
| FastComet | 571 ms |
| ChemiCloud | 571 ms |
| Hostinger | 572 ms |
| Bluehost | 597 ms |
| WPX | 621 ms |
| WP Engine | 650 ms |
| Kinsta | 654 ms |
| DreamPress | 664 ms |
| Nexcess | 793 ms |
| HostGator | 809 ms |
| SiteGround | 870 ms |
Comparison of WordPress Hosting Industry Benchmarks and Standards:
Rocket.net
Rocket.net secured the top positions in most benchmark tests. It’s the only company that utilized the Cloudflare Enterprise in a better way.
Templ
Templ harnesses the complete power of Google Cloud (Server + CDN + DNS). Their benchmark results are better than other Google Cloud based WordPress hosting providers.
Cloudways
Cloudways continually provides better benchmarking results in most tests but performs slower at load tests. Since I tested them only with the basic plan, their higher plan can provide better load handling.
GreenGeeks
GreenGeeks is the surprising performer because their shared hosting outperforms many premium-priced Managed WP hosting services. The best option to get started for an affordable price.
A2 Hosting
A2 Hosting got decent benchmark scores on most tests. However, their starter plan (which I tested) is limited by many factors. But still, they’re better than many shared hosting providers.
WPX
WPX benchmarks have improved a lot compared to last year. In 2021 data, they have got frequent downtimes (apart from the 5 hours outage that happened in Aug. 2021). Since moving their tech stacks to LiteSpeed, there have been better improvements in the performance.
Kinsta
Kinsta Edge caching made big improvements in their load testing benchmarks which I ran in January 2023. Kinsta had the slowest TTFB for 12 months (Dec 21 – Dec 22), but after the introduction of Edge caching, their TTFB has improved a lot by 100-150ms this month. I expect Kinsta’s performance will be better in our Q2 2023 benchmarks.
WP Engine
WP Engine secured a decent score in TTFB and uptime test. I can’t able to run load testing as their security system blocks our test, considering it a DDOS attack. Apart from that, WP Engine is a solid contender, considering the number speed based features like Advanced Network, which got introduced last year.
ChemiCloud
ChemiCloud Load test benchmarks are impressive followed by a great show in the TTFB test. However, their uptime is poor with the starter plan. I bet their Mid and top-tier plans can have better uptime.
DreamPress
DreamPress recorded decent performance in all tests but didn’t come in the top 5 on any tests. Good in most terms but not the best at any.
FastComet
FastComet surprisingly scored better in most benchmarks except Load testing. It happens probably due to the Apache Web Servers. Their mid and top-tier plans have LiteSpeed servers that can handle a better load.
SiteGround
SiteGround scored average on all the tests. Their Global TTFB is one the slowest of all hosts benchmarked. GreeGeeks, which costs 2x lesser than SiteGround, provides 2x faster TTFB and load handling.
Nexcess
Nexcess scored average on all the tests. However, they’re feature packed with many speed features, which I don’t find in other managed WordPress hosts.
Hostinger
Hostinger scored below average on most tests. Their load handling and uptime are poor in their starter plan, which is reasonably priced.
Bluehost
Bluehost has the worst uptime on the list. All other benchmarks prove their performance is below average.
HostGator
HostGator services can be avoided at any cost. All their benchmarks performance is 2x slower compared to all other hosts combined.
Wrapping up
Based on our WordPress hosting benchmark results, I’ve identified the top performing hosting providers in terms of TTFB, Uptime, load testing, Core Web Vitals, and Global TTFB.
However, no benchmarks are perfect, and our review might not show the real face of hosting companies. For example, we tested the companies using the starter plan, but companies put the maximum speed benefits on the top-tier popular plans only.
A host mentioned as Average might be a Good top-tier plan. I suggest users sign up with companies that they think are a good fit and perform their own benchmarks. All the hosting services are covered by money-back guarantee, so you’ve nothing to lose.